Giovanni Finocchiaro, Andrea Gagna, Mariangela Soraci
In 2024, every million euros of added value in the Italian paper industry (€9.02 billion, 2020 prices) generated ≈ 420 t of CO₂, 3.20 kg of SOx, 0.41 t of NOx, 4.4 g of NMVOCs, and 0.04 t of PM10. Compared to 2023, only the intensity of CO2 (-2.1%) and SOx (-7.6%) decreased, while NOx, NMVOCs, and PM10 increased (all +8.3%). In the long-term comparison (1990-2024), two opposing stories emerge: SOx –99% (strong push towards the use of natural gas in the sector) and NMVOCs –99% (cessation of some production processes characterised by this type of emission), against CO₂ +20.4%, NOx +23.7% and PM10 +16.3%, which reflect the increase in the sector's energy needs.
The indicator compares annual emissions of CO₂, SOx, NOx, NMVOCs, and PM10 generated by the national paper industry to the sector's value added, expressed in millions of euros in 2020 (source: Istat). The result, expressed in tons of pollutant per million euros of VA (t/M€), provides an immediate indication of the sector's emissions intensity.
Monitor the paper industry's ability to decouple economic growth from emissions pressures over time, providing useful insights into supply chain environmental balance sheets and reporting required by "climate-air" regulations.
The regulatory framework of the indicator combines monitoring requirements for climate-altering emissions and emissions of other air pollutants: Regulation (EU) 2018/1999 on the Governance of the Energy Union requires Member States, in Article 26, to transmit every 15 March the national greenhouse gas inventory and the emission intensity indicators relating to the year X-2, according to the structure dictated by Implementing Regulation (EU) 2020/1208; These obligations are part of the “European Climate Law”, Regulation (EU) 2021/1119, which makes climate neutrality by 2050 and a reduction of at least 55% of net emissions by 2030 legally binding. For conventional pollutants, the indicator is aligned with the national reductions set by Directive (EU) 2016/2284 on emission limits for SOx, NOx, NMVOCs and CO, while on the industrial side, Directive 2010/75/EU on industrial emissions remains central, implemented in Italy with Legislative Decree 46/2014, which requires the adoption of best available techniques and the systematic exchange of emission data from activities subject to AIA. Taken together, these regulations set reduction targets, reporting deadlines, operating requirements for industrial plants, and requirements for accuracy, transparency, and annual review that emissions data must comply with.
ISPRA Report 428/2026 – National Inventory Document 2026 – Italian Greenhouse Gas Inventory 1990-2024.
ISPRA Report 426/2026 – Italian Emission Inventory 1990-2024. Information Inventory Report 2026
The emission series used for the indicator come from the National Inventory of Atmospheric Emissions maintained by ISPRA and can be freely downloaded from the portal emissioni.sina.isprambiente.it.
The economic denominator comes from the Istat National Accounts: the table "Value added at basic prices - sector Manufacture of paper and paper products and Printing and reproduction on recorded media - chained prices 2020" is available in open data on the I.Stat data-warehouse and exportable in CSV/SDMX formats.
National
1990 - 2024
Intensity of various pollutants (t/M€)
Green Deal - Achieving Climate Neutrality
Each year, ISPRA processes national emissions of CO₂, SOx, NOx, NMVOCs, and PM10 from the paper industry according to international guidelines (IPCC for greenhouse gases and EMEP/EEA for other air pollutants), while Istat updates the sector's value added at chain-linked prices. The emission intensity of each pollutant is obtained by dividing the tons emitted by the millions of euros of value added; to track trends over time, the series is indexed to a base of 1990 = 100.
2024 marks a slight decline in the sector's atmospheric emissions intensity compared to 2023: CO₂ intensity drops to approximately 420.8 t/M€ (-2%), as does sulfur oxide intensity, which is equal to 3.2 kg/M€ (8%); NOx, NMVOCs, and PM10 intensities show increases of just over 8%. Overall, the situation remains poor: while SOx and NMVOCs, PM10, and NOx increase, CO₂ decreases (Table 1).
Over the long term, the indicator shows an improvement for some traditional pollutants: SOx and NMVOC emissions have almost reached zero compared to 1990. Conversely, emissions of NOx, CO₂, and PM10 have increased. In 2024, CO₂ intensity is 20% higher than in 1990, indicating that the increased heating and electricity needs of the paper industry have offset the improvements achieved in energy efficiency. A similar, albeit less marked, trend is observed for NOx (+23.7%) and PM10 (+16.3%). In summary, compared to 1990, SOx and NMVOC emissions have decreased, while those of CO₂, NOx, and PM10 have increased (Table 1).
| Allegati |
|---|
Thumbnail
Titolo
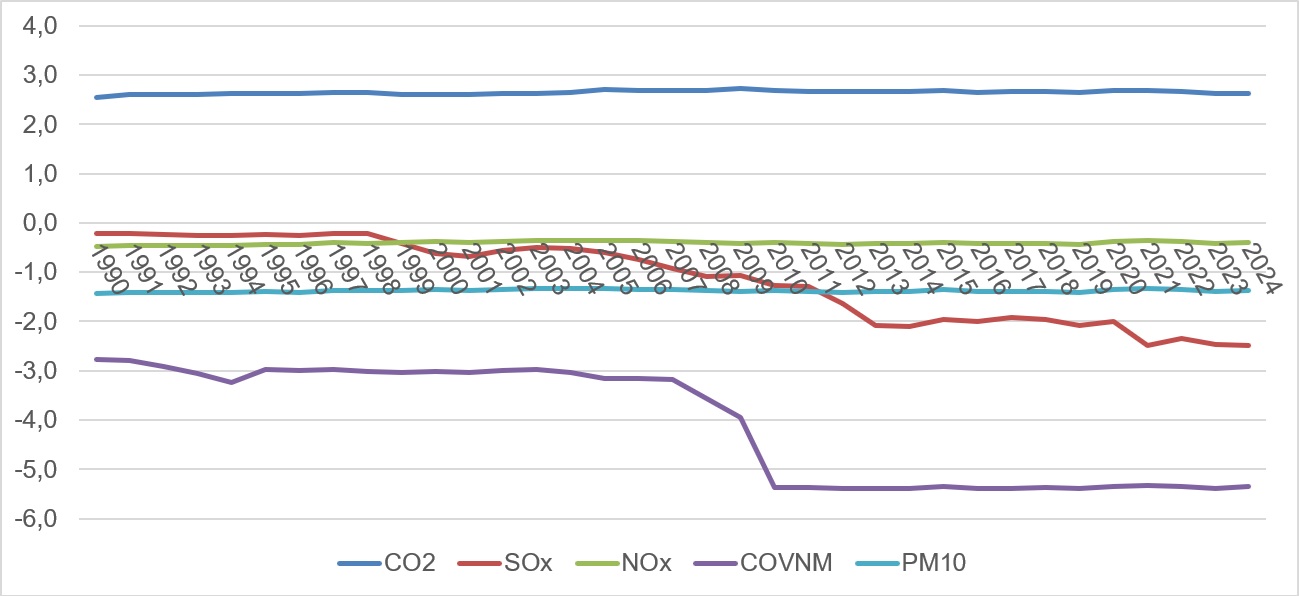
Figure 1: Emission intensity (log10 scale; CO₂, SOx, NOx, NMVOC, CO in t/M€) in the paper industry Fonte
ISPRA processing based on ISPRA and Istat data |
Thumbnail
Titolo
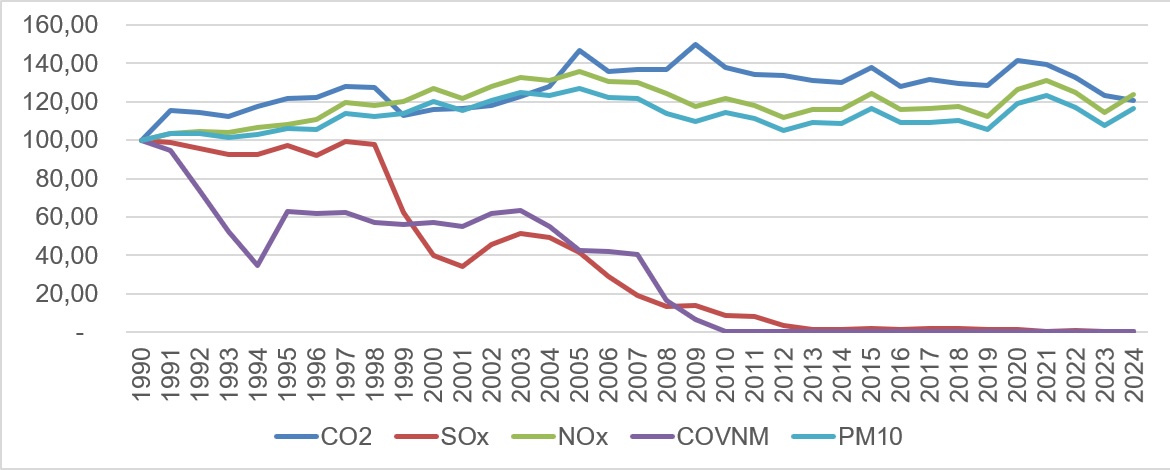
Figure 2: Emission intensity, index 1990 = 100 for CO₂, SOx, NOx, NMVOC, CO in the paper industry Fonte
ISPRA processing based on ISPRA and Istat data |
Thumbnail
Titolo
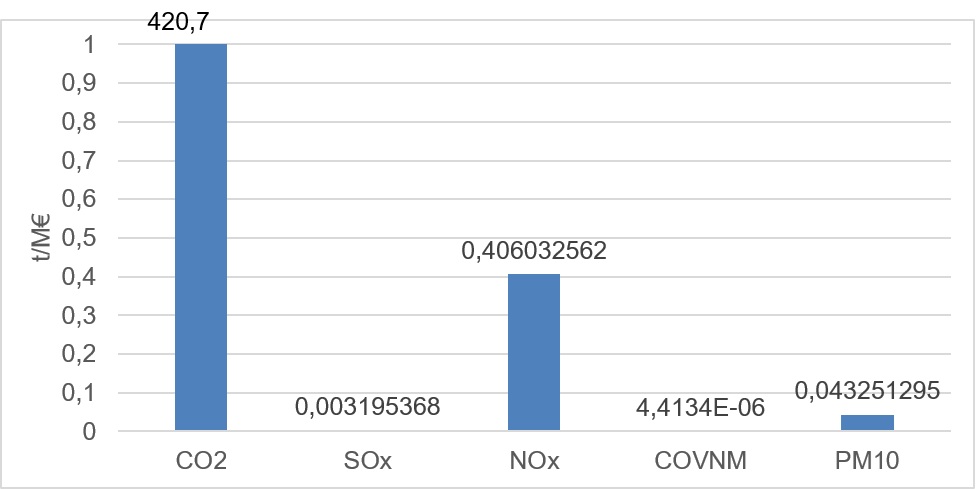
Figure 3: Emission intensity: CO₂, SOx, NOx, NMVOC, CO in t/M€ in the paper industry (2024) Fonte
ISPRA processing based on ISPRA and Istat data |
Titolo
Table 1: Emission intensity in the paper industry in Italy, compared to added value Fonte
ISPRA processing based on ISPRA data (CO2, NOx, SOx, NMVOC, and PM10 emissions) and Istat data (Value Added data). |
Over the long time span 1990-2024, the indicator shows two distinct trends, clearly visible in Figure 1. The first is represented by the notable decrease in sulfur oxides, whose emissions have fallen to a few kilograms per million euros, thanks mainly to the progressive replacement of the fuel mainly used to power the production process, while NMVOCs are approaching zero, almost to the point of disappearing, as the processes that generate these emissions gradually cease. The second trend, much slower, if not even increasing, shows what is happening to other parameters linked to the energy aspects of the production process: CO₂ remains stable at values about four orders of magnitude higher than other substances, although slightly decreasing in recent years, while NOx and PM10 have shown some fluctuations in recent years accompanied by a slight increase in emissions (Figure 1).
Figure 2 highlights with particular clarity the different speeds of evolution of the various pollutants. In 2024, SOx and NMVOCs will remain at 0.5% and 0.3% of their initial levels, respectively, while CO₂ reaches a level above 120%, NOx exceeds 123%, and PM10 is just above 116%. In other words, advanced methane conversion has made it possible to practically eliminate SOx, but has not been able to have an equally significant impact on CO2 and particulate matter (Figure 2).
The 2024 emissions profile (Figure 3) confirms that the sector's environmental footprint is now dominated by CO₂, with over 420 t per million euros of added value, while NOx and PM10 play an intermediate role, and SOx and NMVOCs are now residual. A combined reading of the three figures confirms that the abatement measures implemented to date have achieved significant results, but that the challenge of energy decarbonization of paper machines (one of the so-called hard to abate sectors) still remains to be addressed by focusing on: thermal efficiency of drying processes, advanced electrification and the use of a greater share of renewables.