Piero Fraschetti, Francesca Lena, Walter Perconti, Emanuela Piervitali, Giulio Settanta
The indicator describes the trend of intense heat events in Italy. A heat wave is defined as an event lasting at least 6 consecutive days during which the maximum temperature exceeds the 90th percentile of the daily maximum temperature distribution for the same period of the year over the 30-year climatological reference period. The indicator counts the number of days characterized by such heat waves in a given year. In 2024, an increase of approximately 29.3 heat wave days was observed compared to the average value calculated over the reference 30-year period (1991–2020).
The occurrence of extreme temperature events and any significant trends are analyzed through the examination of absolute minimum and maximum air temperature values. Specifically, the "heat wave" indicator, as defined by the CCL/CLIVAR Working Group on Climate Change Detection for the analysis of temperature extremes, identifies an event lasting at least six consecutive days during which the maximum temperature exceeds the 90th percentile of the daily maximum temperature distribution for the same period of the year over the 1991–2020 climatological 30-year reference period.
To represent the number of days characterized by a heat wave in a year, the Warm Spell Duration Index (WSDI) is used. The percentile values for the WSDI are calculated over a 5-day moving window centered on each calendar day. Unlike indices based on fixed threshold values, the WSDI counts exceedances relative to a percentile-based threshold, making it representative of local climate variability. The WSDI detects periods of relatively high temperatures ("warm spells") that can occur in any season.
The annual series of the average number of heat waves, expressed as a deviation from a climatological baseline, allows for estimating the frequency of intense heat events and assessing any significant trends over the years.
The indicator has no direct references to regulatory elements.
https://scia.isprambiente.it;
APAT-OMS, 2007, Cambiamenti climatici ed eventi estremi: rischi per la salute in Italia - Rapporti 77/2007
ISPRA, 2022, I normali climatici 1991-2020 di temperatura e precipitazione in Italia - Stato dell'Ambiente 99/2022
ISPRA, 2018, Variazioni della temperatura in Italia: estensione della base dati e aggiornamento della metodologia di calcolo - Stato dell’ambiente 81/2018;
ISPRA, 2016, Controlli di qualità delle serie di temperatura e precipitazione - Stato dell'Ambiente 66/2016
ISPRA, 2015, Valori climatici normali di temperatura e precipitazione in Italia - Stato dell'Ambiente 55/2015
ISPRA, 2014, Focus su "Le città e la sfida ai cambiamenti climatici" - Stato dell'Ambiente 54/2014
ISPRA, 2013, Variazioni e tendenze degli estremi di temperatura e precipitazione in Italia - Stato dell'Ambiente 37/2013
ISPRA, 2012, Elaborazione delle serie temporali per la stima delle tendenze climatiche - Stato dell'Ambiente 32/2012
Peterson T.C ., Folland C , Gruza G, Hogg W, Mokssit A e Plummer N., 2001, Report on the activities of the Working Group on Climate Change Detection and Related Rapporteurs 1998-2001. World Meteorological Organization, Rep. WC DMP-47, WMO -TD 1071, Geneva, Switzerland, 143 pp.;
SNPA, 2025, Il clima in Italia nel 2024 - Report ambientali SNPA n. 44/2025
Kuglitsch F.G., Toreti A., Xoplak i E., Dlla-Marta, P.M., Zerefos C . S., Turk e s M., Luterbache r J., 2010, Heat wave changes in the eastern Mediterranean since 1960. Geophysical Res arch Letters, 37, L04802, DO I: 10.1029/2009GL041841
Improvements in the estimation of heatwave events in Italy could be achieved by extending the indicator calculation system to additional primary data sources, thereby increasing the availability of temperature time series that fulfill the criteria of duration, continuity, and completeness
ISPRA
SCIA – Sistema nazionale per l’elaborazione e diffusione di dati climatici (https://scia.isprambiente.it)
Italy
1961-2024
To identify a heatwave event, daily maximum temperature data are required. The software used by the SCIA system (National System for the Processing and Dissemination of Climate Data) processes raw data and produces a daily maximum temperature value, which is accepted as valid only if it passes specific quality controls. Using the validated daily maximum temperature data, the heatwave indicator, known as the Warm Spell Duration Index (WSDI), is calculated; this index represents the number of days characterized by a heatwave in a given year. This value is considered valid only if at least 75% of daily temperature data for that year are available and validated. The climatological baseline for anomaly calculations has been updated to the most recent 30-year period, 1991-2020. This choice follows the recent recommendations of the World Meteorological Organization to update climatological baselines every ten years for operational climatology purposes.
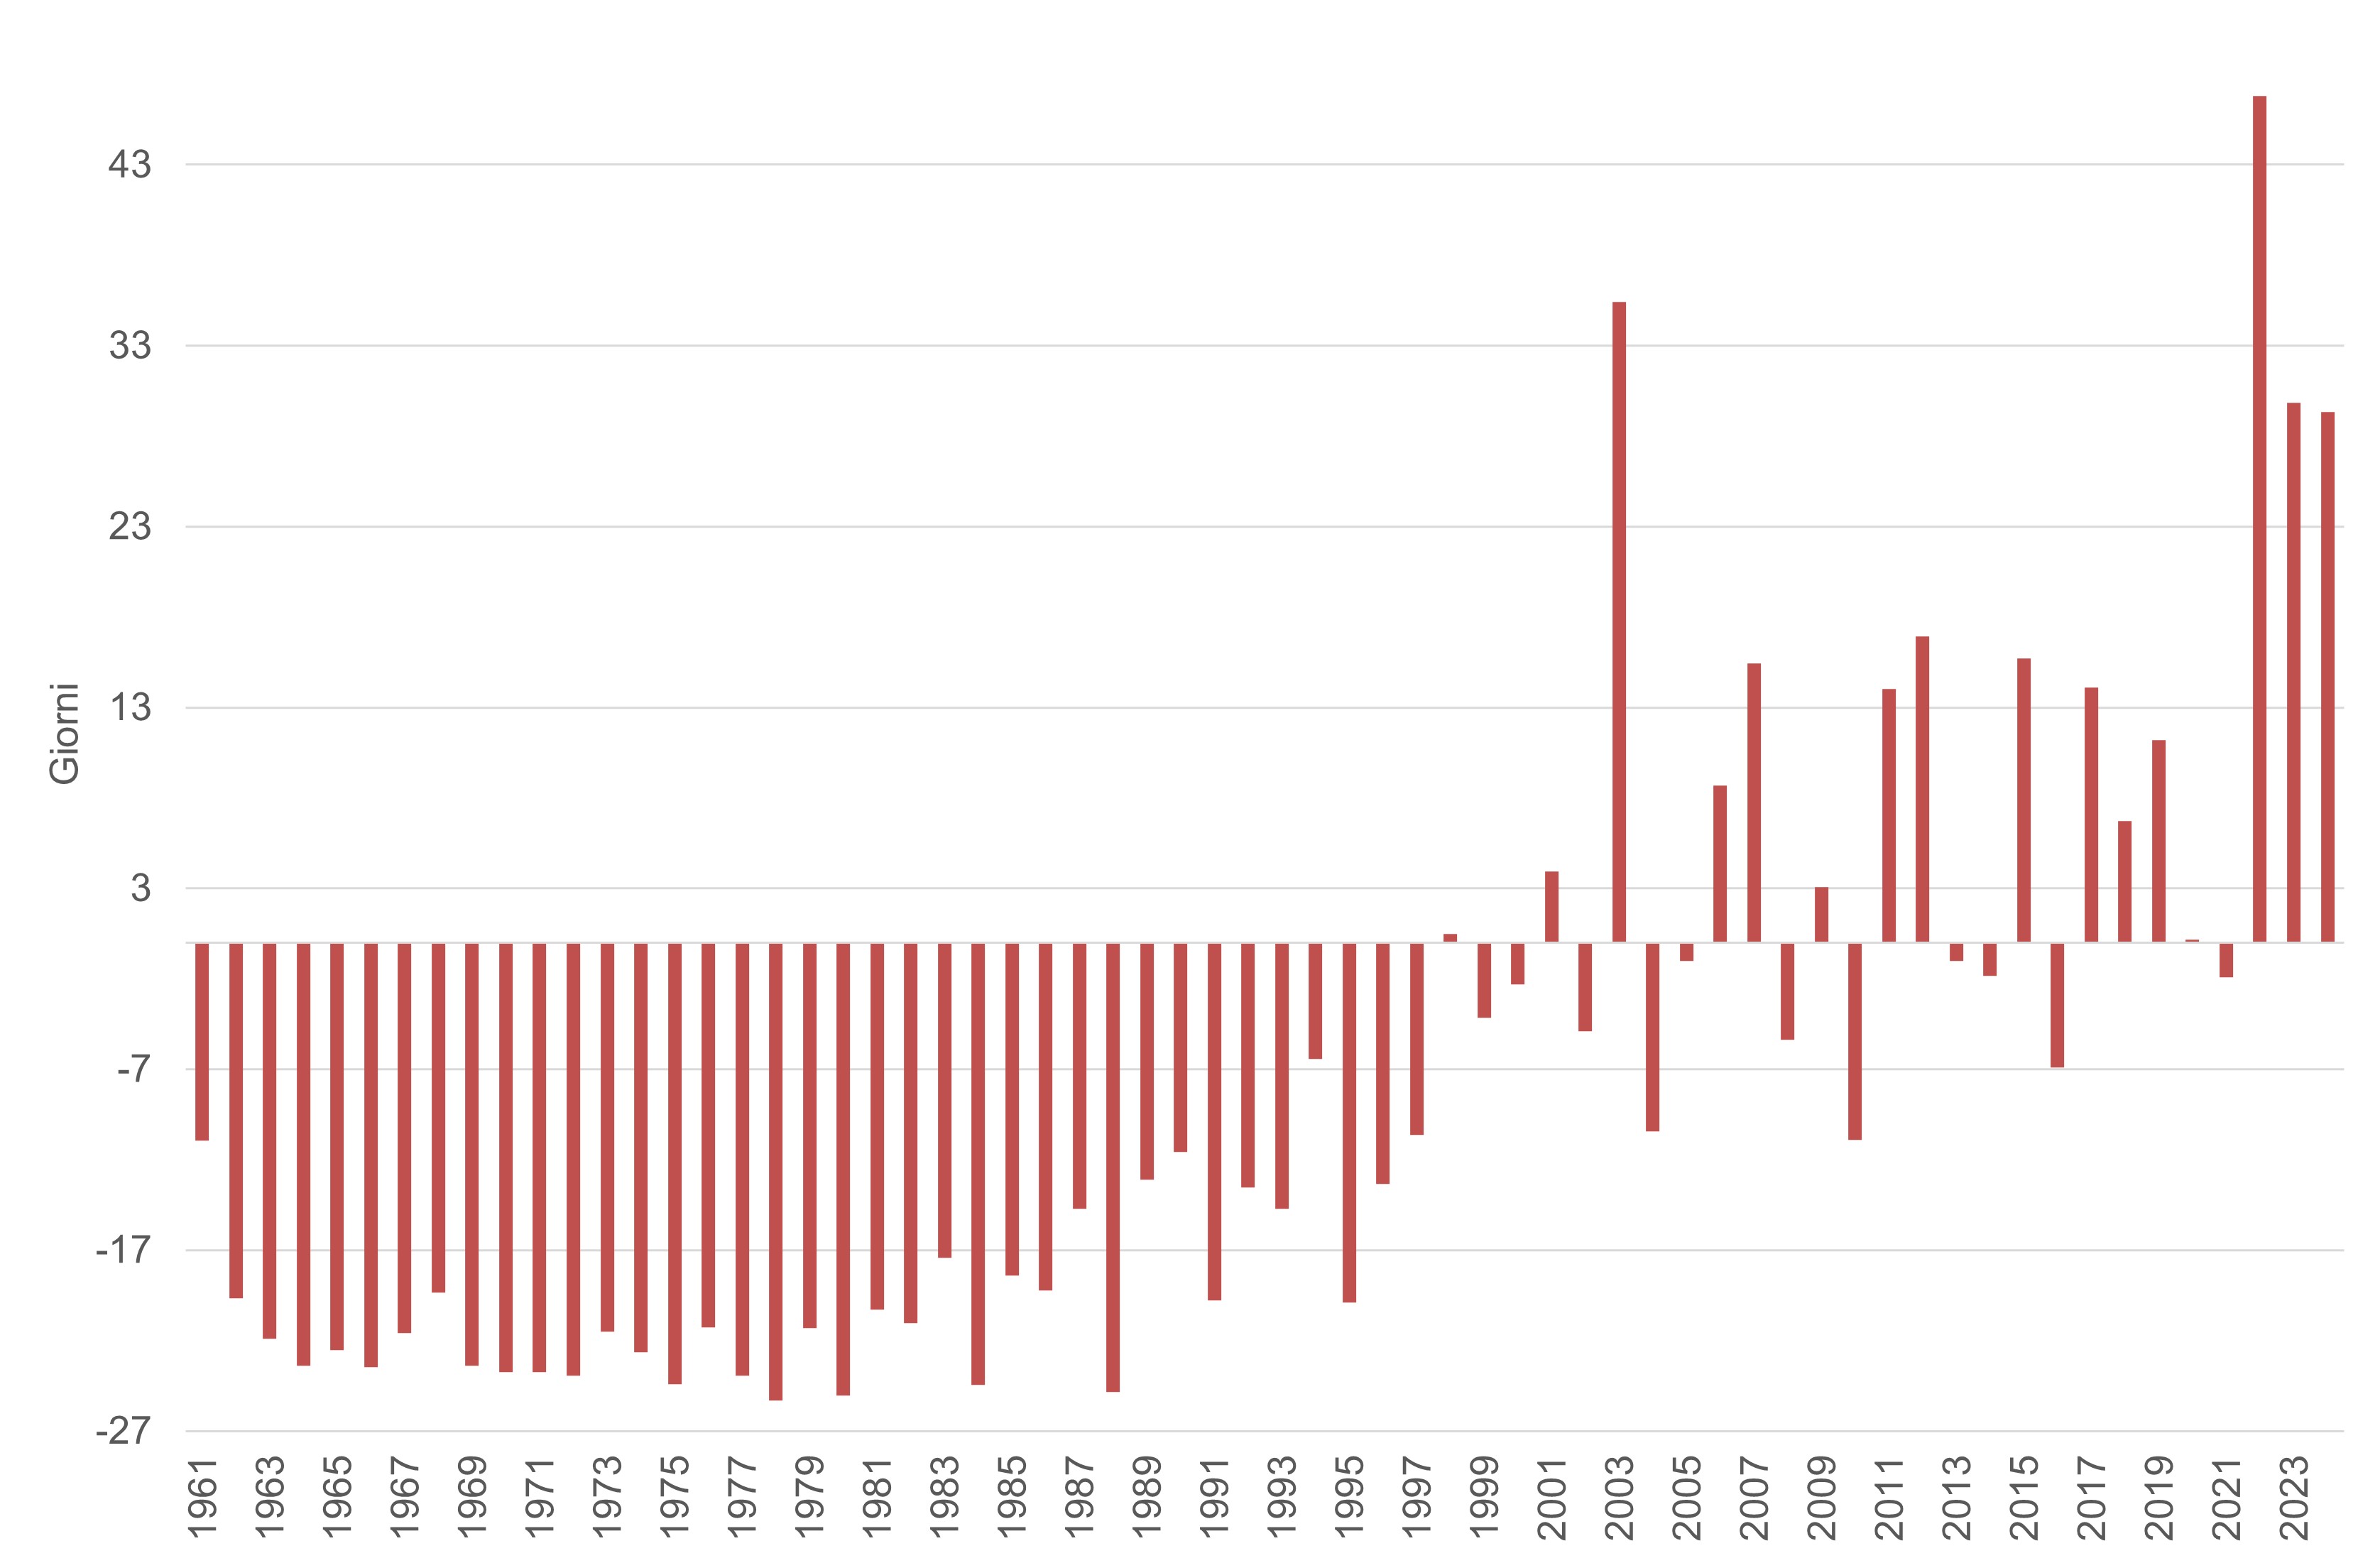
In 2024, an increase of approximately 29.3 heatwave days (WSDI) was observed compared to the average value calculated over the 1991-2020 reference period.
The annual time series of the average number of heatwave days (WSDI – Warm Spell Duration Index), expressed as deviations from the 1991-2020 reference period average, shows an increase in heatwaves over the past twenty years (Figure 1). Since the main international climate strategies and policy programs aim to counteract ongoing warming of the climate system, the observed unfavorable trend and the assignment of the related indicator icon can be interpreted as moving away from this objective.
| Allegati |
|---|
Thumbnail
Titolo
Figure 1: Time series of annual average anomalies of the number of heatwave days (WSDI) in Italy compared to the 1991-2020 baseline. Fonte
ISPRA |
With an increase of approximately 29.3 days compared to the average value calculated over the reference 1991–2020 climatological period, 2024 ranks fourth highest in the entire historical series (Figure 1).