Piero Fraschetti, Francesca Lena, Walter Perconti, Emanuela Piervitali, Giulio Settanta
The indicator describes the trend of intense heat events in Italy, more precisely, it expresses the number of days with maximum air temperatures above 35°C. In 2025, an increase of 7.0 torrid days was observed compared to the average value calculated in the thirty-year reference period (1991-2020).
The existence of extreme thermal events and the presence of any significant trends is analyzed by examining the absolute minimum and maximum air temperatures. In particular, the "hot days" indicator, defined by the "Expert Team on Sector-Specific Climate Indices (ET-SCI)" for the analysis of temperature extremes, expresses the number of days with maximum air temperatures above 35°C.
The annual series of the average number of hot days, expressed as a difference from a climatological baseline, allows us to estimate the frequency of intense heat events and evaluate any significant trends over the years.
The indicator has no direct references to regulatory elements
https://scia.isprambiente.it;
APAT-OMS, 2007, Climate change and extreme events: health risks in Italy - Reports 77/2007
ISPRA, 2022, 1991-2020 climate normals for temperature and precipitation in Italy - State of the Environment 99/2022
ISPRA, 2018, Temperature variations in Italy: extension of the database and update of the calculation methodology - State of the Environment 81/2018;
ISPRA, 2016, Quality controls of temperature and precipitation series - State of the Environment 66/2016
ISPRA, 2015, Climate normals for temperature and precipitation in Italy - State of the Environment 55/2015
ISPRA, 2014, Focus on "Cities and the challenge of climate change" - State of the Environment 54/2014
ISPRA, 2013, Variations and trends in temperature and precipitation extremes in Italy - State of the Environment 37/2013
ISPRA, 2012, Processing of time series for estimating climate trends - State of the Environment 32/2012
Peterson T.C., Folland C, Gruza G, Hogg W, Mokssit A and Plummer N., 2001, Report on the activities of the Working Group on Climate Change Detection and Related Rapporteurs 1998-2001. World Meteorological Organization, Rep. WC DMP-47, WMO -TD 1071, Geneva, Switzerland, 143 pp.;
SNPA, 2026, The climate in Italy in 2025; SNPA environmental reports n. 48/2026;
Toreti A. and Desiato F., 2007, Changes in temperature extremes over Italy in the last 44 years, Int. J. Climatology, DO I 10.1002/joc.1576;
Improvements in estimating hot days in Italy could result from extending the indicator's calculation system to other elementary data sources, in order to increase the availability of historical temperature series that meet the requirements of duration, continuity, and completeness of the time series.
ISPRA (Higher Institute for Environmental Protection and Research)
SCIA – National System for the Processing and Dissemination of Climate Data (https://scia.isprambiente.it)
National
1961-2025
Annual average anomaly in the number of hot days
To determine whether a given day of the year can be defined as a hot day, the maximum temperature for that day is compared to the 35°C threshold. Therefore, the daily maximum temperature must be available. The program used by the SCIA (National System for the Processing and Dissemination of Climate Data) system processes the elementary data and returns a daily maximum temperature value that is accepted as valid only if it passes certain checks. If the daily maximum temperature is correct, the difference between it and the 35°C threshold is calculated and it is determined whether the day can be considered a hot day. The annual value of the indicator is calculated by adding the number of hot days present in a given year. This value is accepted as valid only if at least 75% of valid daily data is available in the year in question. The climatological basis for calculating anomalies has been updated to the most recent thirty-year period, 1991-2020. This choice stems from the World Meteorological Organization's recent recommendations to update the climatological base every ten years for operational climatology purposes.
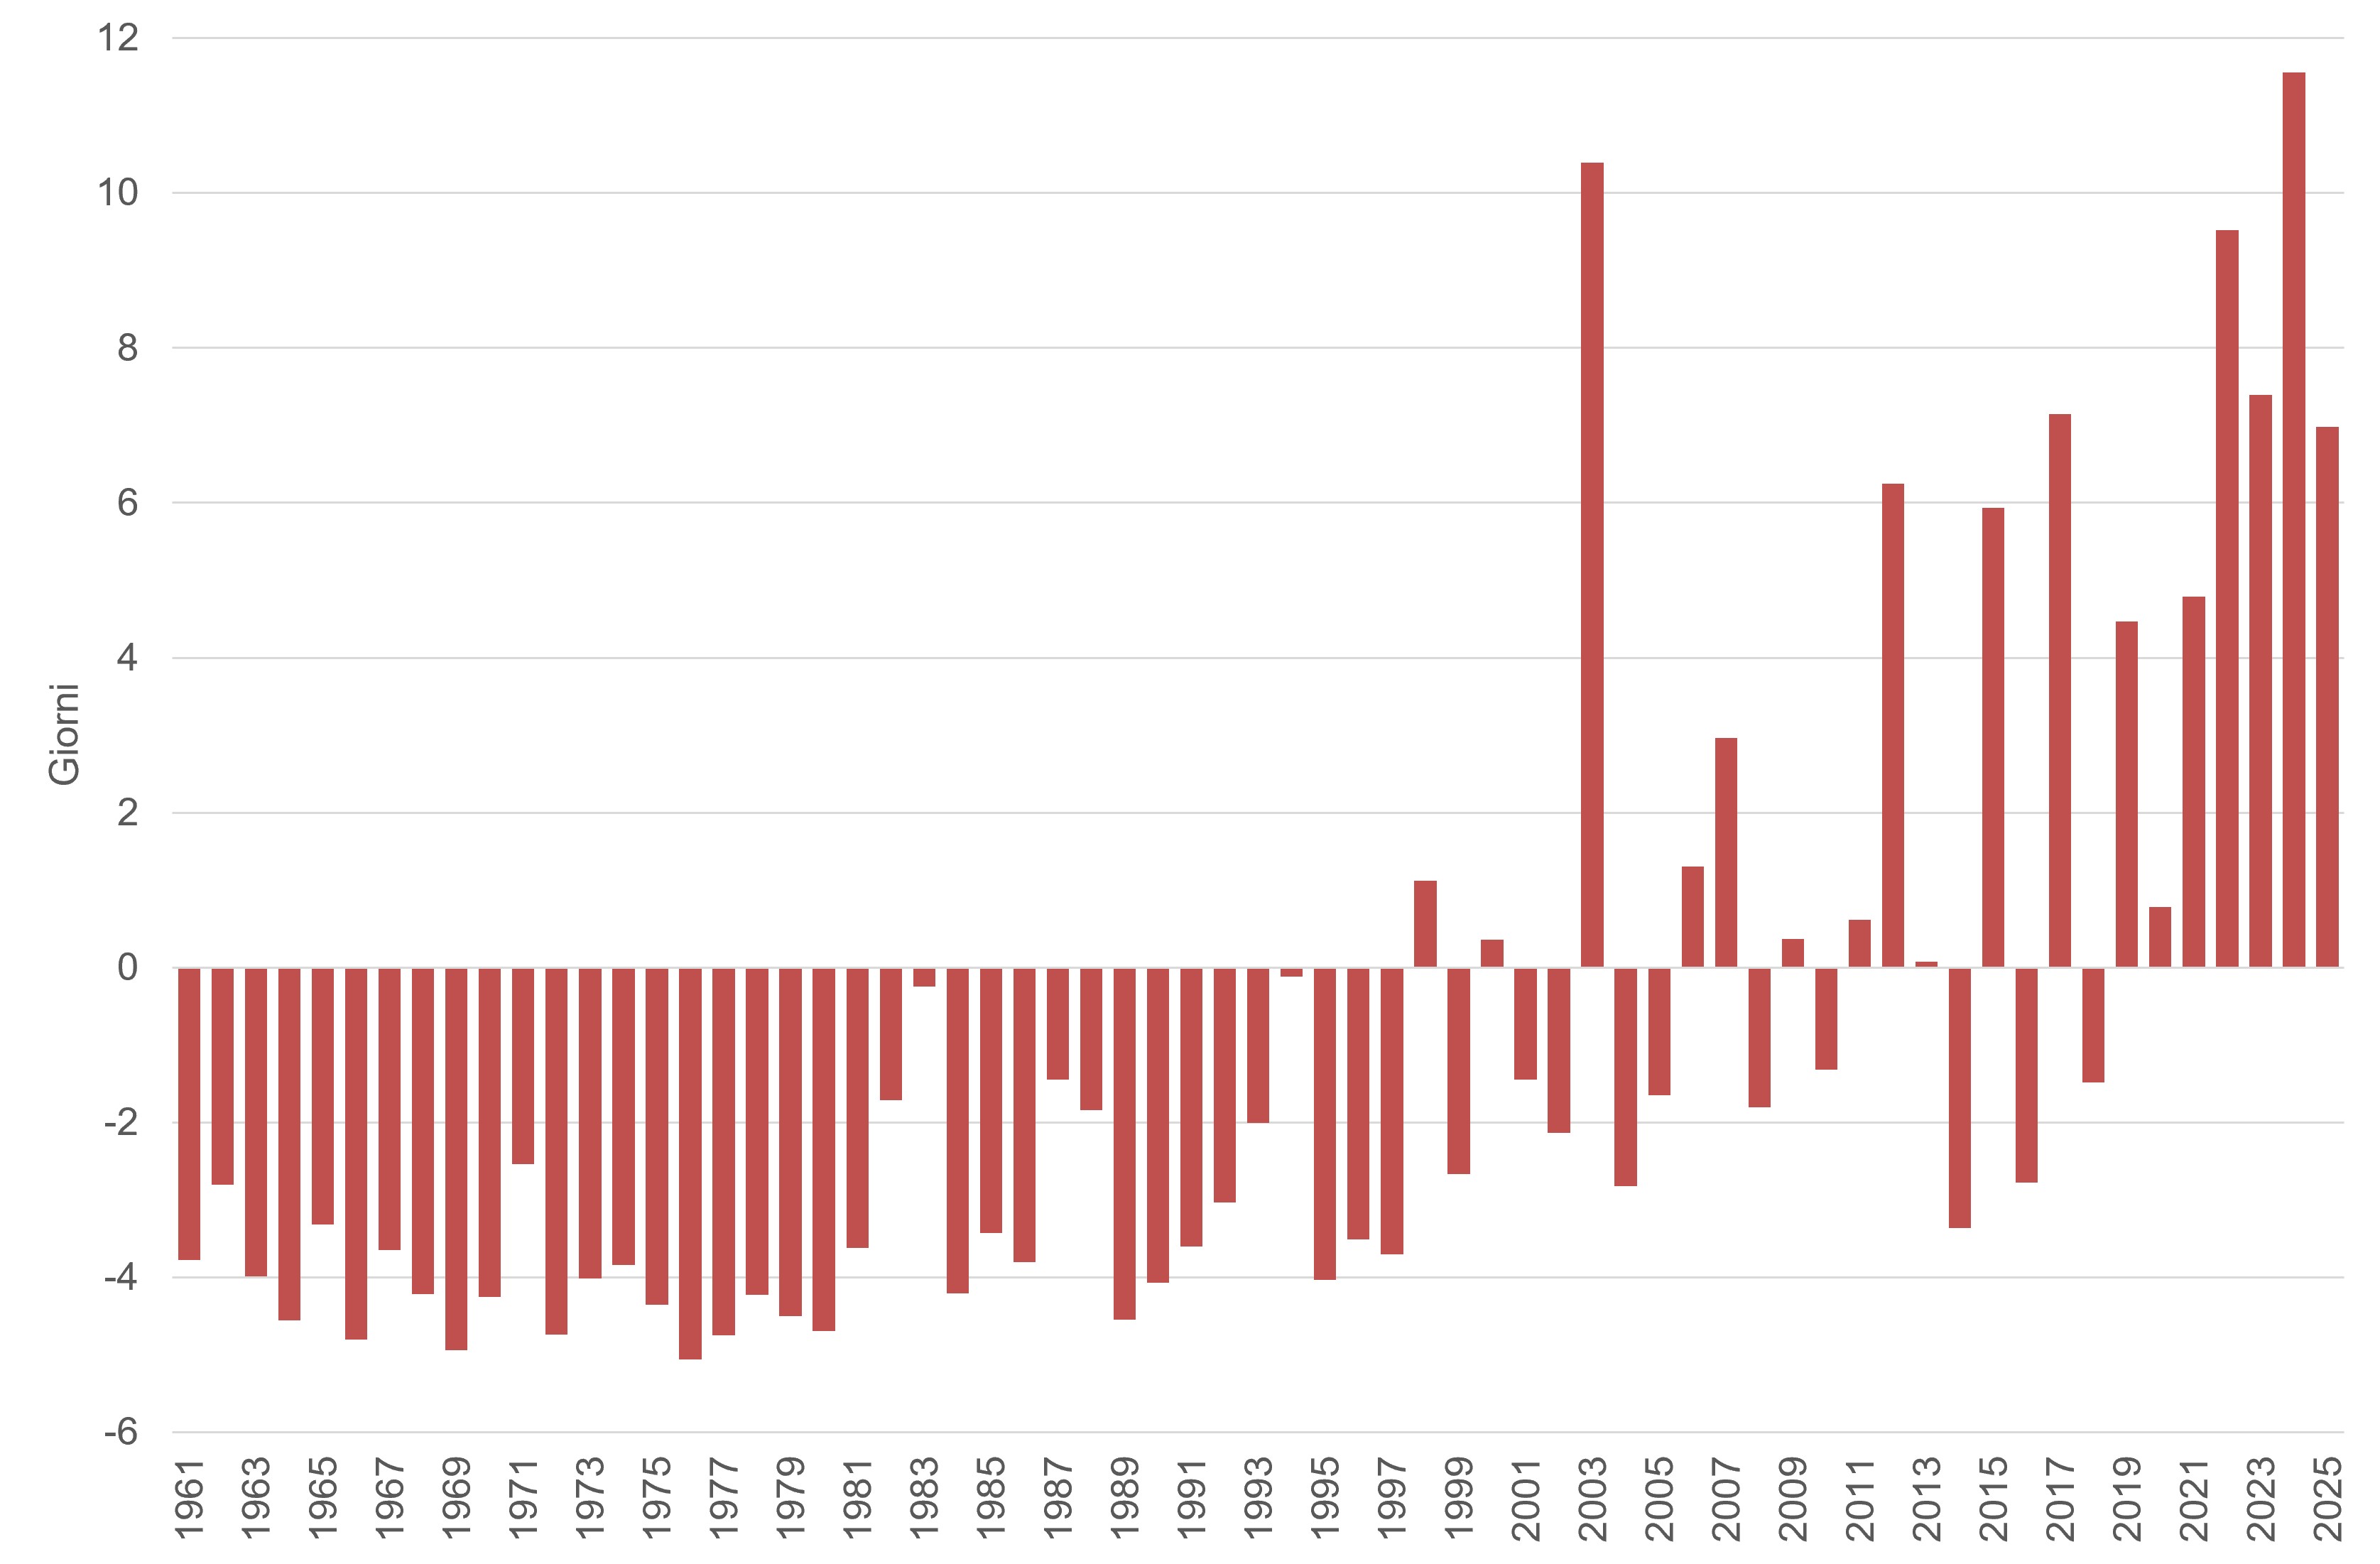
In 2025, an increase of 7.0 hot days was observed compared to the average value calculated in the reference thirty-year period 1991-2020.
Over the last 11 years, the number of hot days has always been higher than the reference thirty-year period 1991-2020, with the exception of 2016 and 2018, and since the main international strategies and political programs regarding climate change aim to counteract the ongoing warming of the climate system, the evaluation of an unfavorable trend and the assignment of the related icon can be considered in terms of a departure from this objective.
| Data |
|---|
Thumbnail
Headline
Figure 1: Time series of average annual anomalies in the number of hot days in Italy compared to the 1991-2020 reference value. Data source
ISPRA |
The historical series of annual mean anomalies in the number of hot days in Italy indicates that 2025, with an increase of 7.0 days compared to the average value calculated in the thirty-year reference period (1991-2020), ranks sixth among the highest in the entire historical series (Figure 1).