Monica Pantaleoni, Antonio Caputo
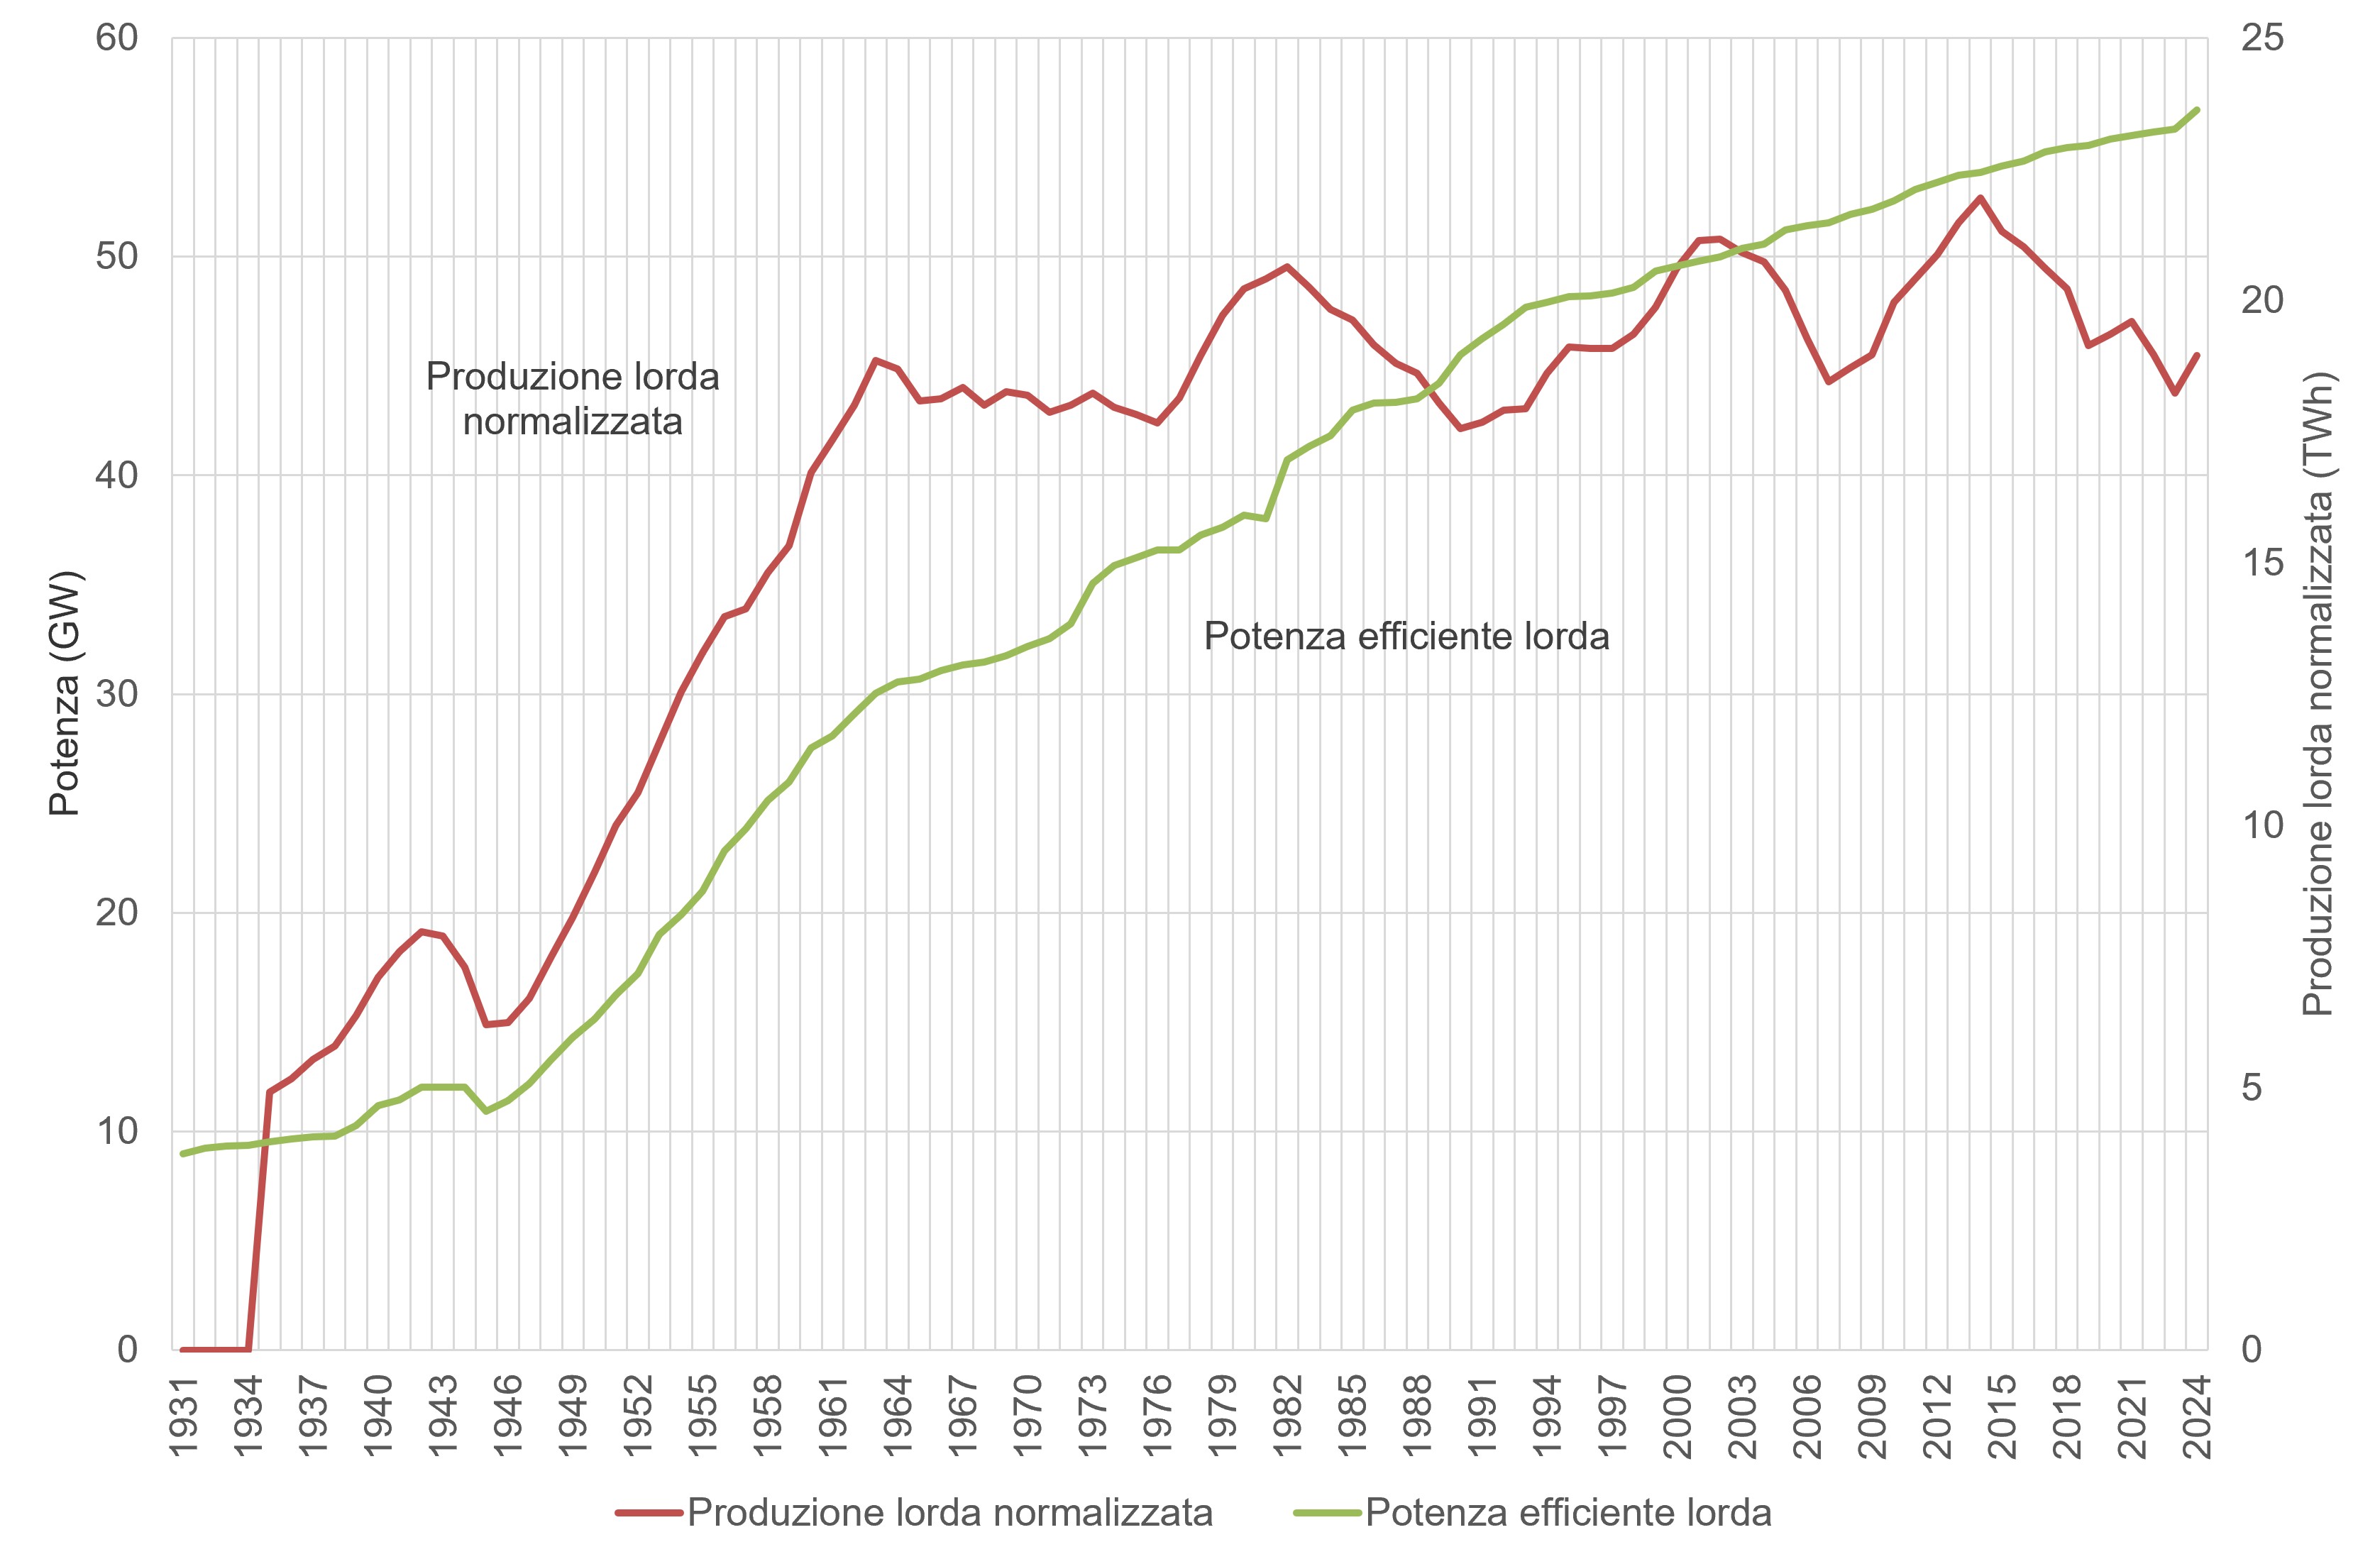
The indicator provides information on normalized gross hydroelectric energy production (in TWh) and gross efficient power (in GW) in Italy from 1931 to 2024, with the aim of analyzing their temporal trends and assessing any significant trends, including those related to climate change. Hydroelectric production, in fact, is an energy source strictly dependent on meteorological and climate variables, which has led, and will lead over time, to a reduction in water availability and greater difficulty in its management. Adding the effects of climate change to the impact of human use, future scenarios generally estimate a decline in potential hydroelectric production. Installed capacity has grown steadily from 3.7 GW in 1931 to 23.6 GW in 2024. Normalized hydroelectric production went from 11.8 TWh in 1935 to a peak of 52.7 TWh in 2014, before settling at between 43 and 47 TWh over the last decade, reaching 45.5 TWh in 2024.
The indicator provides information on gross hydroelectric energy production in Italy. The data has been normalized—following the criteria set out in Directive 2009/28/EC (Annex II)—to smooth out annual fluctuations. For a more complete interpretation, an analysis of installed capacity, in terms of gross efficient power (GW of electricity), is also provided.
Analyze the trend of hydroelectric power generation in Italy, as a source closely dependent on meteorological and climate variables. The indicator is therefore of significant interest in studying the impacts of climate change, as it can improve understanding of the correlation between climate phenomena, water resource management, and the resulting dynamics inherent in hydroelectric power generation.
The regulatory framework for the Italian hydroelectric sector has developed through a complex legislative layering that combines the needs of resource regulation, environmental protection, and market access. The historical foundation is Royal Decree 1775/1933, the Consolidated Law on Water and Electricity Systems, which has governed concessions for water diversion for hydroelectric use for nearly a century. This basic framework has been progressively supplemented by EU and environmental regulations, most notably Directive 2000/60/EC (Water Framework Directive), which introduced rigorous principles for the protection of water bodies and the requirement to comply with the Minimum Vital Flow (MVF)—now known as the Ecological Flow—directly impacting the operation and productivity of the plants. In the context of market reorganization and sustainability, Legislative Decree 79/1999 (Bersani Decree) and the subsequent Legislative Decree 152/2006 (Consolidated Environmental Act) defined both the regulatory framework for hydroelectric concessions and the procedures for environmental impact assessments.
The main limitation associated with the indicator is its interpretation, which must be made taking into account that it is also influenced by non-climatic factors. However, it can be considered an indicator of interest for the topic of climate change impacts, capable of providing useful information for studying the effects on the hydroelectric sector.
Evaluations of the indicator's correlation with precipitation trends could help better understand the impact of this climate variable on hydroelectric production.
Terna - National Electricity Network S.p.A.
Terna - Annual statistics on electricity production and consumption in Italy
National Team (I)
1935-2024
Gross efficient power (GW); Normalized gross production (TWh)
The hydroelectric production data was normalized according to the criteria set out in Directive 2009/28/EC (Annex II). Gross production, including pumped storage energy, reflects the average production over a five-year period.
Hydroelectricity represents the most historically mature and consolidated renewable resource in the Italian electricity generation landscape, with a gross efficient capacity of 23.6 GW and a production of 45.5 TWh in 2024. Despite the continuous increase in installed capacity, the national water resource is essentially saturated at sites geographically and ecologically suitable for large-scale plants. The production share is increasingly affected by climate variability and water availability, with significant fluctuations between hydrologically favorable years and those marked by prolonged droughts.
The historical evolution can be divided into three main phases. A first phase of strong expansion (1931–1960), coinciding with the country's industrialization, during which power tripled from 3.7 to 11.5 GW and production exceeded 40 TWh. A second phase of moderate growth (1961–2010), characterized by the completion of large reservoirs and the launch of pumped storage plants, with power increasing from 11.7 to 21.9 GW. Finally, a third stabilization phase (2011–2024), in which power grew only marginally (from 22.1 to 23.6 GW) and production stabilized around an average of 46–48 TWh, highlighting how new power increases consisted primarily of small-scale plants (small hydroelectric or small-hydro) and the repowering of existing facilities. During the period 1935–1963, installed capacity showed a constant increase, and hydroelectric production followed a parallel trend. Subsequently, cyclical trends were observed around an average value of electricity production with a slight upward trend. Furthermore, Figure 1 shows that the ratio between production and installed power underwent a significant decrease, indicating the need for greater installed power per unit of production. In the 1960s, the average ratio was approximately 3.4 TWh/GW, compared to 2.0 TWh/GW in the last five years. Hydroelectric production has been steadily decreasing since 2015, reaching its lowest point in 2022 with production of 30.3 TWh. Peak production was recorded in 2014 at 60.3 TWh.
| Data |
|---|
Headline
Table 1: Gross hydroelectric production and installed capacity in Italy Data source
ISPRA processing on TERNA data |
Thumbnail
Headline
Figure 1: Gross hydroelectric production and installed capacity in Italy Data source
ISPRA processing on TERNA data |
Hydroelectric production trends can provide insights into changes in the hydrological cycle resulting from changing climate conditions, especially when simultaneously considering the evolution of installed electricity generation capacity over time. Integrated water resource management will become increasingly crucial to balancing clean energy production with agricultural and residential uses in a changing climate.