Antonio Caputo
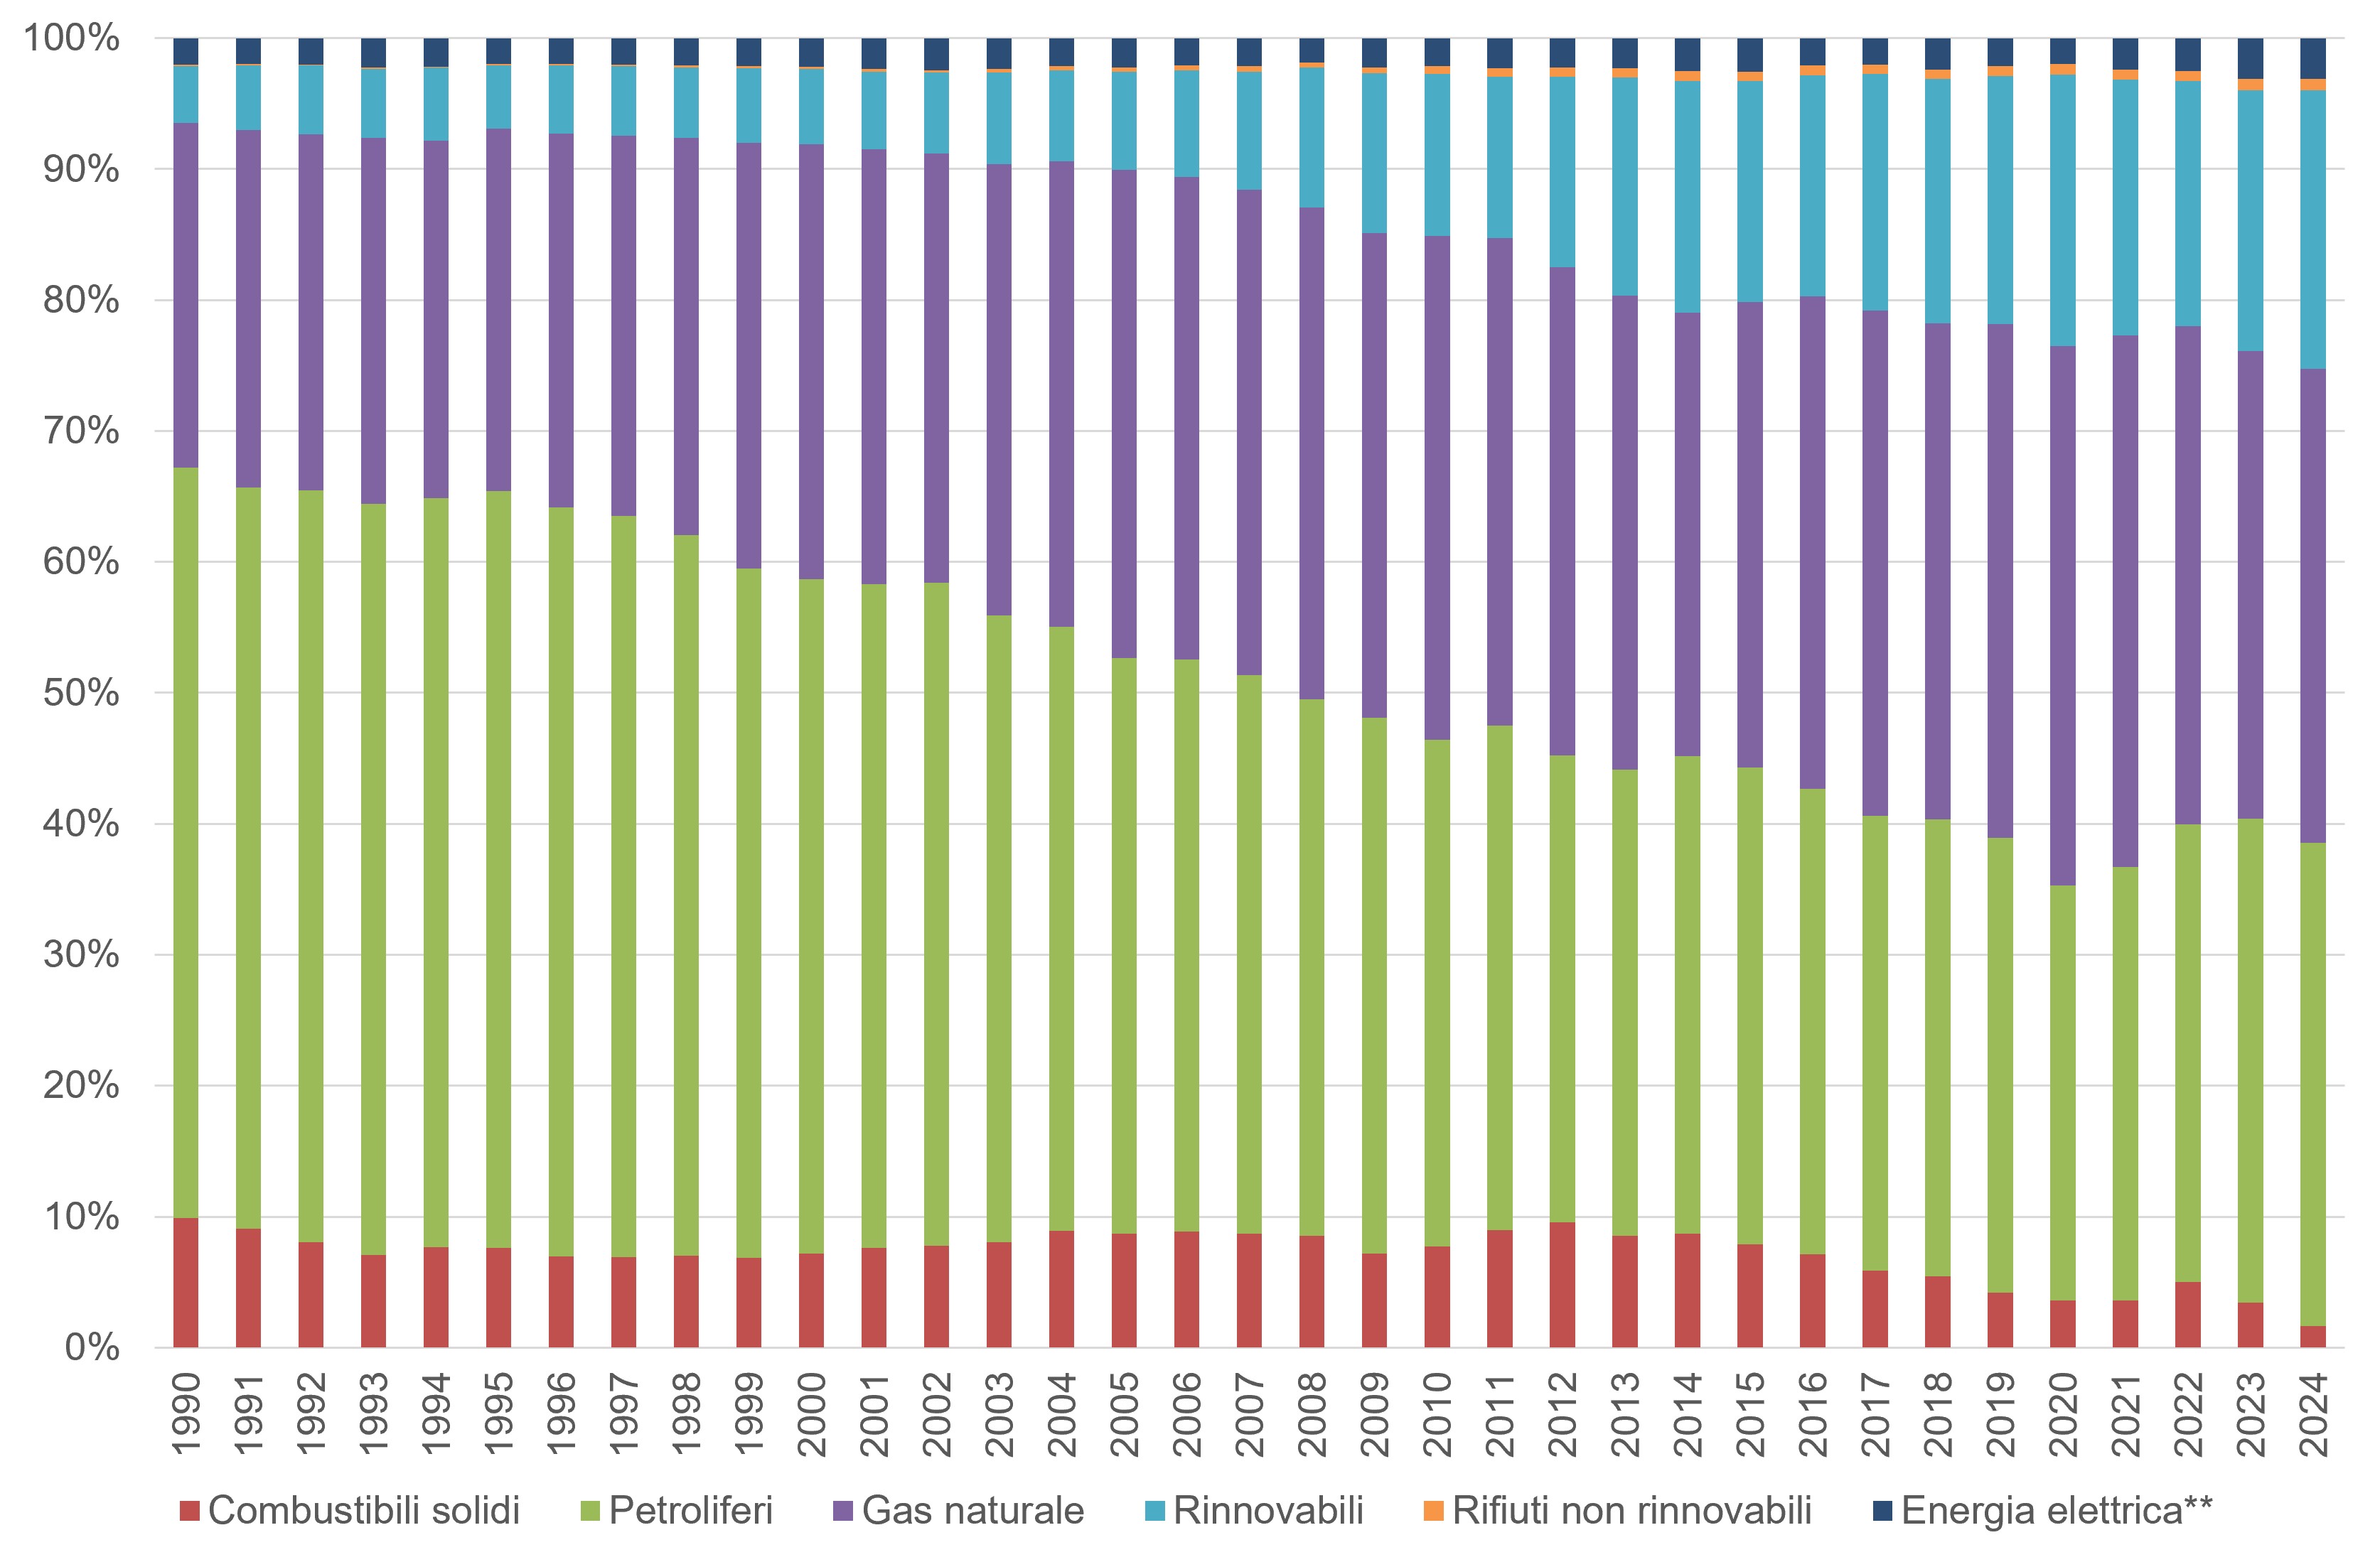
The analysis of the composition of gross domestic energy consumption highlights a progressive reduction in the historical role of petroleum products. This decline corresponds to the growth of natural gas and renewable sources, which in 2024 reached shares of 36% and 21% respectively. Such diversification of the energy basket, driven by renewables, generates a positive impact on the security of supplies and on Italy's rate of energy self-sufficiency, historically among the lowest within the panorama of industrialized countries. Over the last 35 years, renewables have grown almost five times, going from 6.47Mtoe to 29.76Mtoe.
The indicator measures energy production from each of the primary energy sources.
Evaluate the contribution of different primary energy sources to energy production, in order to increase the use of less polluting fuels.
The European environmental regulatory framework has evolved from the VII General Program of Action (Decision No. 1386/2013/EU), concluded in 2020, towards the current VIII Program of Environment Action (8th EAP), formally adopted by the Council of the EU on 29 March 2022 and in force until 2030. Although the 8th EAP defines the strategy to monitor and accelerate the Union's green transition, for this indicator it does not quantitative targets or specific binding objectives have been set out.
MASE, National Energy Balance (BEN), various years, https://sisen. mase. gov. it/dgsaie/
MASE, Eurostat
MASE, National Energy Balance (BEN), https://sisen. mase. gov. it/dgsaie/
National
1990-2024
The data is collected by the Ministry of the Environment and Energy Security and is processed according to the Eurostat methodology.
In 2024, the panorama of gross domestic energy consumption highlights a system dominated by petroleum products (51.55 Mtoe) and natural gas (50.63 Mtoe) which together cover approximately 73% of the total. Renewable sources are positioned immediately behind, with 29.76 Mtoe (21%). Solid fuels are in a condition of almost total marginality, reduced to a value of just 2.30 Mtoe (1.6% of the total). Imports of electricity and energy from non-renewable waste complete the picture, occupying a minority but stable share, at 4.4 Mtoe and 1.2 Mtoe respectively (Table 1). The overall total consumption stands at 139.81 Mtoe, a value that reflects an overall lighter system compared to previous decades (-6% compared to 1990 and -1% compared to 2023).
The historical evolution of the data describes a parabolic trajectory for total consumption, which grows constantly from 148.13 Mtoe in 1990 until reaching a historical peak of 189.45 Mtoe in 2005, and then begins a structural contraction that brings the final figure for 2024 below the levels of the early nineties. Within this global trend, a radical rearrangement of individual sources is taking place. Petroleum products are suffering a profound decline, falling from 84.89 Mtoe in 1990 (when they represented the absolute majority of consumption) to the current 51.55 Mtoe (-39%). On the contrary, natural gas experienced strong expansion until the end of the 2000s (from 1990 to 2005 it recorded a growth of 81%), then stabilizing as a reference source. The most disruptive and linear dynamic, however, is that of renewable sources, which are growing almost five times, progressively rising from 6.47 Mtoe in 1990 up to the record of 29.76 Mtoe in 2024 (+360%). Solid fuels show an oscillating trend, with a continuous decrease from 1990 to 2000 (-14%) followed by growth until 2007 (+30% compared to 2000) and finally a continuous decrease until 2024 (-86%). Non-renewable waste and balances of electricity exchanged with foreign countries show a long-term growth trend, while maintaining limited volumes. Non-renewable waste goes from 0.16 Mtoe in 1990 to 1.18 Mtoe in 2024 while electricity balances go from 2.98 Mtoe to 4.29 Mtoe (Table 1).
| Allegati |
|---|
Headline
Tabella 1: Consumo interno lordo di energia per fonti primarie Data source
MASE, Eurostat |
Thumbnail
Headline
Figura 1: Consumi totali di energia per fonti primarie Data source
MASE, Eurostat |
The profound changes in the national energy mix are explained by a convergence of economic, technological and regulatory factors. The reduction of oil and solid fuels is the direct effect of European and national climate policies, which through CO2 taxation and severe limits on harmful emissions have made the use of coal and fuel oil economically disadvantageous. The structure of Italian energy supplies is changing towards greater diversification of the energy sources used. The predominant role of petroleum products is reducing in favor of the increase in natural gas and renewable sources (Figure 1). Natural gas has benefited from this transition, being chosen as the ideal bridge fuel for electricity generation and heating thanks to its lower emissions and the technological flexibility of modern plants. The constant growth of renewable sources instead reflects the significant increase in investments in the photovoltaic and wind sectors, encouraged by public plans and driven by a drastic reduction in the production costs of clean technologies. Finally, the contraction in total consumption recorded since 2005 indicates a development in energy efficiency in the productive and civil sectors, combined with a progressively tertiary economy that requires less primary energy for the same value produced. The temporary peak of fossil fuels in 2022, followed by the collapse of 2023 and 2024, finds its motivation in the international geopolitical crisis and in the consequent temporary need to restart coal-fired power plants to deal with the gas shortage, an emergency parenthesis which has quickly receded as soon as the markets stabilized. Greater diversification and the increased role of renewable sources have positive effects on Italy's level of energy self-sufficiency, which is among the lowest among industrialized countries.