Barbara Lastoria
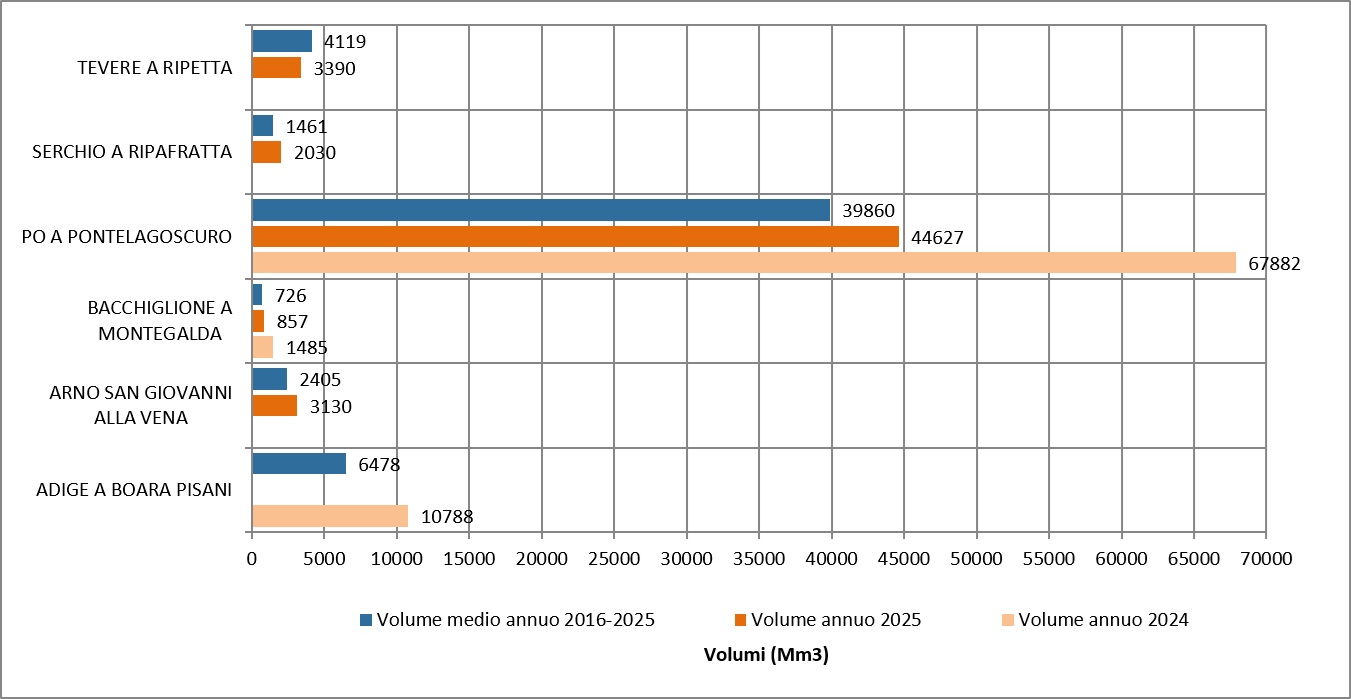
The indicator provides an assessment of the trend of water volumes measured in bed sections of some of the main Italian waterways compared to the previous year and decade. For 2025 it was possible to represent the flow data for 6 closing sections of as many waterways of national importance (Po, Arno, Adige, Bacchiglione, Serchio and Tiber). In 2025, the annual volumes that have flown into the measurement sections, have significant increases compared to the previous decade, with increases of between 12% and 40%, with the exception of the sections on Adige for which it was not possible to evaluate the annual volumes due to the unavailability of the flow data in the months from June to September 2025 and the Tiber for which there was a decrease of just under 20%.
It is a status indicator that measures the volume of water (cubic meters) that passes through a given section of a waterway in the unit of time (second). The extent of the flow rate of the watercourses is carried out by the regional structures that took over from the peripheral offices of the National Hydrographic and Tidal Service according to standards and procedures published by the SIMN in the notebook "Technical rules for the collection and processing of hydrometeorological data - part II", in compliance with the standards of the World Meteorological Organization (WMO).
The systematic measure of the flow rates of the watercourse plays a fundamental role because it allows to: evaluate the response capacity of a basin to a meteoric event, essential for the purposes of soil protection and to fulfill the obligations provided for in the D. Legislative Decree 49/2010, implementing the European Directive on floods 2007/60/EC; determining the amount of resource available in the period, necessary for the evaluation of the hydrological budget; defining the qualitative parameters as indicated in the D. Lgs. 152/06 and in Framework Directive 2000/60/EC.
- D. Lgs. 112/1998
- Direttiva 2000/60/CE
- D. M. 28/07/2004
- D. Lgs. 152/2006
- Direttiva 2007/60/CE
- D. Lgs. 49/2010
- European Water Resilience Strategy, adottata dalla Commissione europea il 4 giugno 2025.
The current Italian legislation obliges the achievement of specific environmental objectives for waterways also in quantitative terms (e.g., minimum life runoff / ecological outflow). The indicator provides information on possible criticalities due to alterations in hydrological regimes that could affect the achievement of the environmental objectives set by the D. Lgs. 152/06.
WMO (2008) No. 168: Guide to Hydrological Practices Volume I: Hydrology, From Measurement to Hydrological Information
Servizio Idrografico e Mareografico Nazionale, Roma 1997 - Norme tecniche per la raccolta e l’elaborazione dei dati idrometeorologici
Servizio Idrografico e Mareografico Nazionale - Pubblicazione n. 17, Roma 1970
Servizio Idrografico e Mareografico Nazionale - Annali Idrologici
Barbara Lastoria (2008): "Hydrological processes on the land surface: A survey of modelling approaches". FORALPS Technical Report, 9. Università degli Studi di Trento, Dipartimento di Ingegneria Civile e Ambientale, Trento, Italy, 56 pp. ISBN 978-88-8443-228-5.
Giovanni Braca (2008): "Stage-discharge relationships in open channels: Practices and problems". FORALPS Technical Report, 11. Università degli Studi di Trento, Dipartimento di Ingegneria Civile e Ambientale, Trento, Italy, 28 pp.;24 cm. ISBN 978-88-8443-230-8
The extent of the flow rate in a section of a waterway is a very onerous activity, since it requires highly specialized staff and the contextual topographic survey of the section. For this reason, when it is considered that the section (and therefore the related runoff scale) has not undergone significant changes, it is preferred to estimate the flow rates through the measurements of the hydrometric heights, converting the latter into the corresponding flow values.
Maintenance of sections and instruments for measuring and updating runoff scales also through a systematic campaign of flow measures and topographic surveys of sections.
ISPRA, ARPA/APPA
The data of scope are among the hydrological data and are therefore published by the regional and provincial structures to which, according to Article 92 of the D. Legislative Decree No. 112 of March 31, 1998, functions and tasks of the peripheral offices of the National Hydrographic and Tidal Service (SIMN) of the Department for National Technical Services, now merged into ISPRA, were transferred. The average daily data used in the processing of the indicator are partly easily accessible via the web by consulting: ARPA Emilia-Romagna: https://www. arpae. it/it/temi-ambientali/meteo/report-meteo/annali-hydrological; ARPA Veneto: https://www. arpa. veneto. it/dati-ambienteli/dati-storici/meteo-mini
6 watersheds of national importance out of 11
2016-2025
The average daily flow series are the basic figure. On it are conducted preparatory operations of verification of the completeness of the series. The calculation of the annual volumes that have been deflected in the year under analysis is carried out by integrating the average monthly average flow rates on the annual period, in turn calculated as the average on the single month of the average daily flow rates. Similarly, volumes for the previous decade are carried out, compared to which the integrated flow rates are calculated as monthly averages over the previous 10 years. With regard to the analysis of the monthly flow rates, the ratio is carried out between the average monthly flow rates of the year being analyzed and the average of the average monthly flow rates calculated over the previous 10 years.
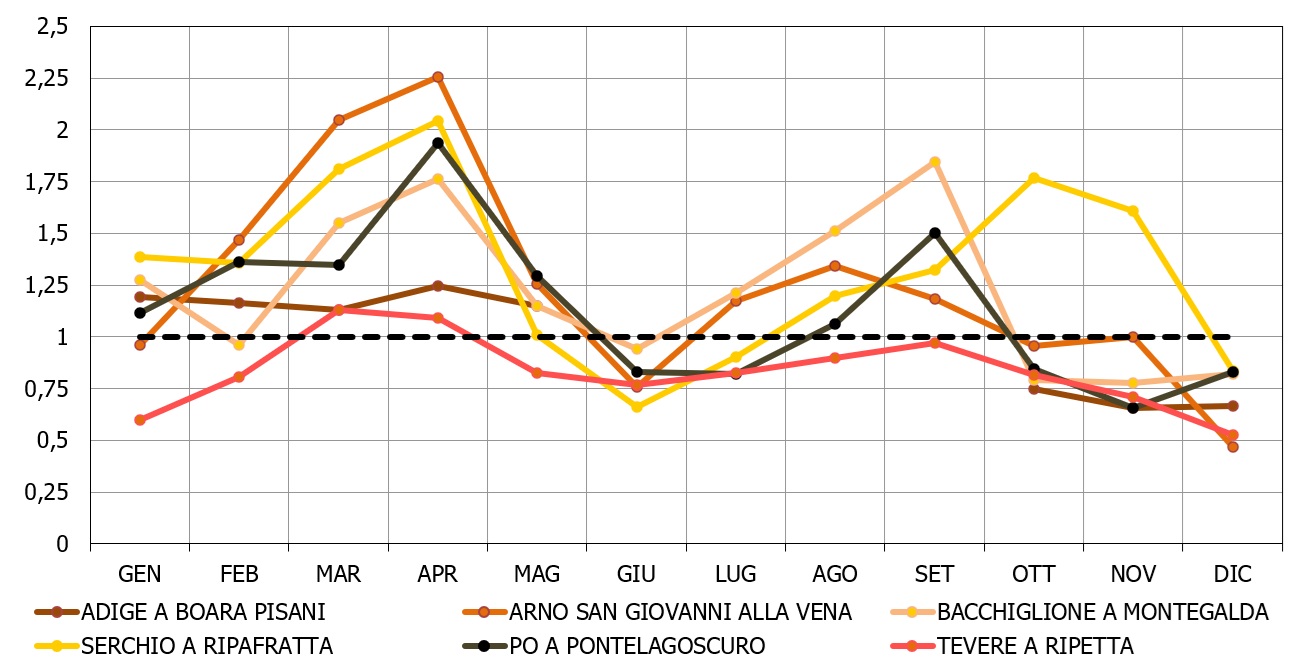
In 2025, in four of the six basins, the annual volumes that have flowed into the measurement sections, have significant increases compared to the previous decade, with increases of between 12% and 40%. The exception is the Adige for which the lack of relief of the flow rates to the section of Boara Pisani in the months from June to September prevents to estimate the annual volumes and the Tiber for which the annual volumes dislodged through the section of Ripetta have a reduction compared to the previous decade of about 18% (Figure 1). Compared to 2024 there is a decrease in volumes in 2025 for the sections of Pontelagoscuro sul Po (34%) and Montegalda sul Bacchiglione (42%). It is not possible to make comparisons with 2024 in terms of volumes for the other sections for the partial unavailability of the monthly flow data for 2024 or as mentioned for the Adige in Boara Pisani for 2025. For all sections, the months of March and April 2025 show average monthly flow rates above the average values for the previous decade, as shown in the trend of the ratios between the average monthly flow rates (Figure 2). For the sections of San Giovanni alla Vena sull'Arno and Ripafratta sul Serchio, this condition occurred for 8 and 9 months respectively. In particular, more than doubles flow rates were recorded in the months of March and April for the section of San Giovanni alla Vena, and in April for the section of Ripafratta sul Serchio. These flow surpluses partly offset the effect of the reduction in flow rates in particular in June and December in which in particular at the section of San Giovanni alla Vena sull'Arno the average monthly flow rate was less than half that of the previous decade. The month of December was critical for all sections with monthly average flow reductions compared to the previous decade between 17% and 53%. In the section of Ripetta sul Tibere, with the exception of the months of March and April, the flow rates have always remained below those of the previous decade, with values 40% lower in January and December. For the Adige in Boara Pisani the flow rates in the months from January to May, before the period of non-operation of the hydrometer, the average monthly flow rates were on average 18% higher than those of the previous decades. In 2025 the least favorable months with reference to the measurement sections considered were, in addition to December, those of June and October in which the flow rates of five of the six sections considered were all kept below the average values for the decade.
It is not possible to make a judgment on the trend of this indicator as it should be traced back to natural conditions, i.e. not affected by anthropogenic action (withdrawals, derivations, works of reservoir). Moreover, although it is possible to easily make comparisons with the previous decade, it is complex to analyze the reasons for imputing sensitive deviations due to the different interactions that pressures can exert between them.
| Data |
|---|
Thumbnail
Headline
Figure 1: Comparison between annual volumes that flowed in 2025 and those flown respectively in the year and in the previous decade for the sections of Adige in Boara Pisani, Arno in San Giovanni alla Vena, Bacchiglione in Montegalda, Po in Pontelagoscuro, Serchio in Ripafratta and Tiber in Ripetta Data source
ARPA/APPA, Regional Civil Protection Functional Centers |
Thumbnail
Headline
Figure 2: Ratio between the average monthly flow rate of the year 2025 and the average monthly flow rate calculated on the previous decade for the sections of Adige in Boara Pisani, Arno in San Giovanni alla Vena, Bacchiglione in Montegalda, Po in Pontelagoscuro, Serchio in Ripafratta and Tiber in Ripetta Data source
ARPA/APPA |
Thumbnail
Headline
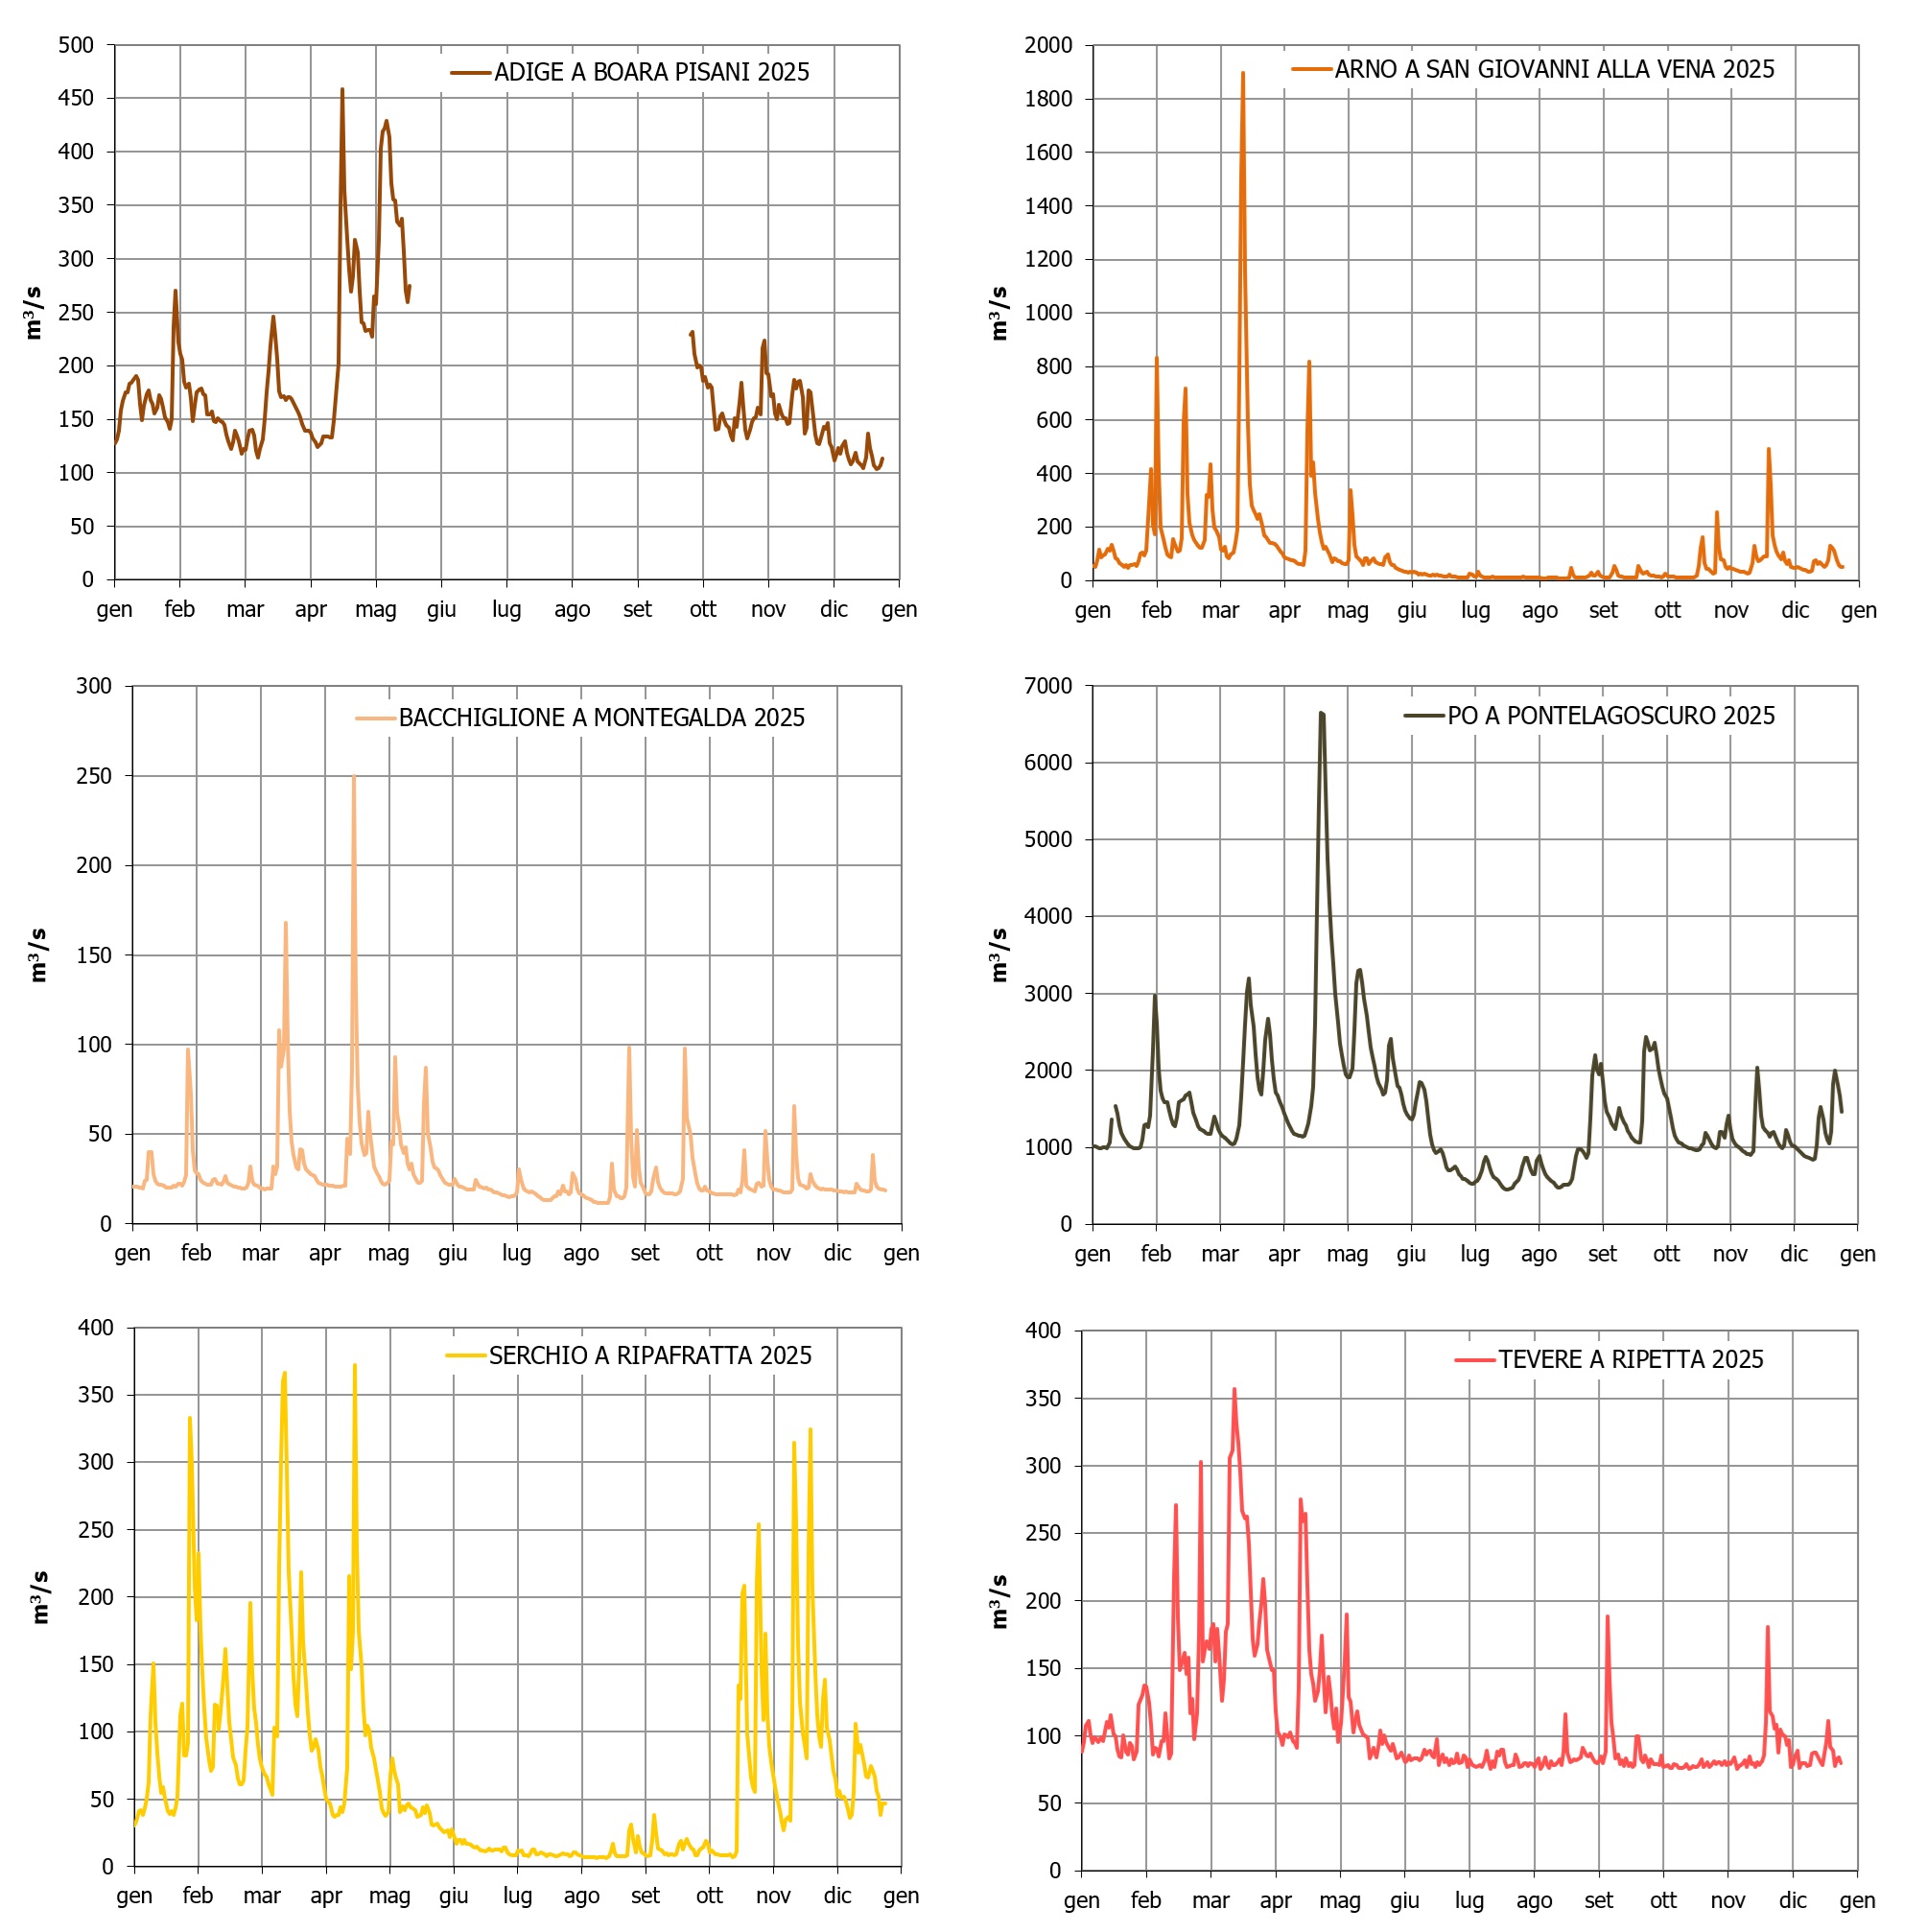
Figure 3: Average daily courses recorded during 2025, in the sections of Adige in Boara Pisani, Arno in San Giovanni alla Vena, Bacchiglione in Montegalda, Po in Pontelagoscuro, Serchio in Ripafratta and Tiber in Ripetta Data source
ARPA/APPA,Regional Civil Protection Functional Centers |
Thumbnail
Headline
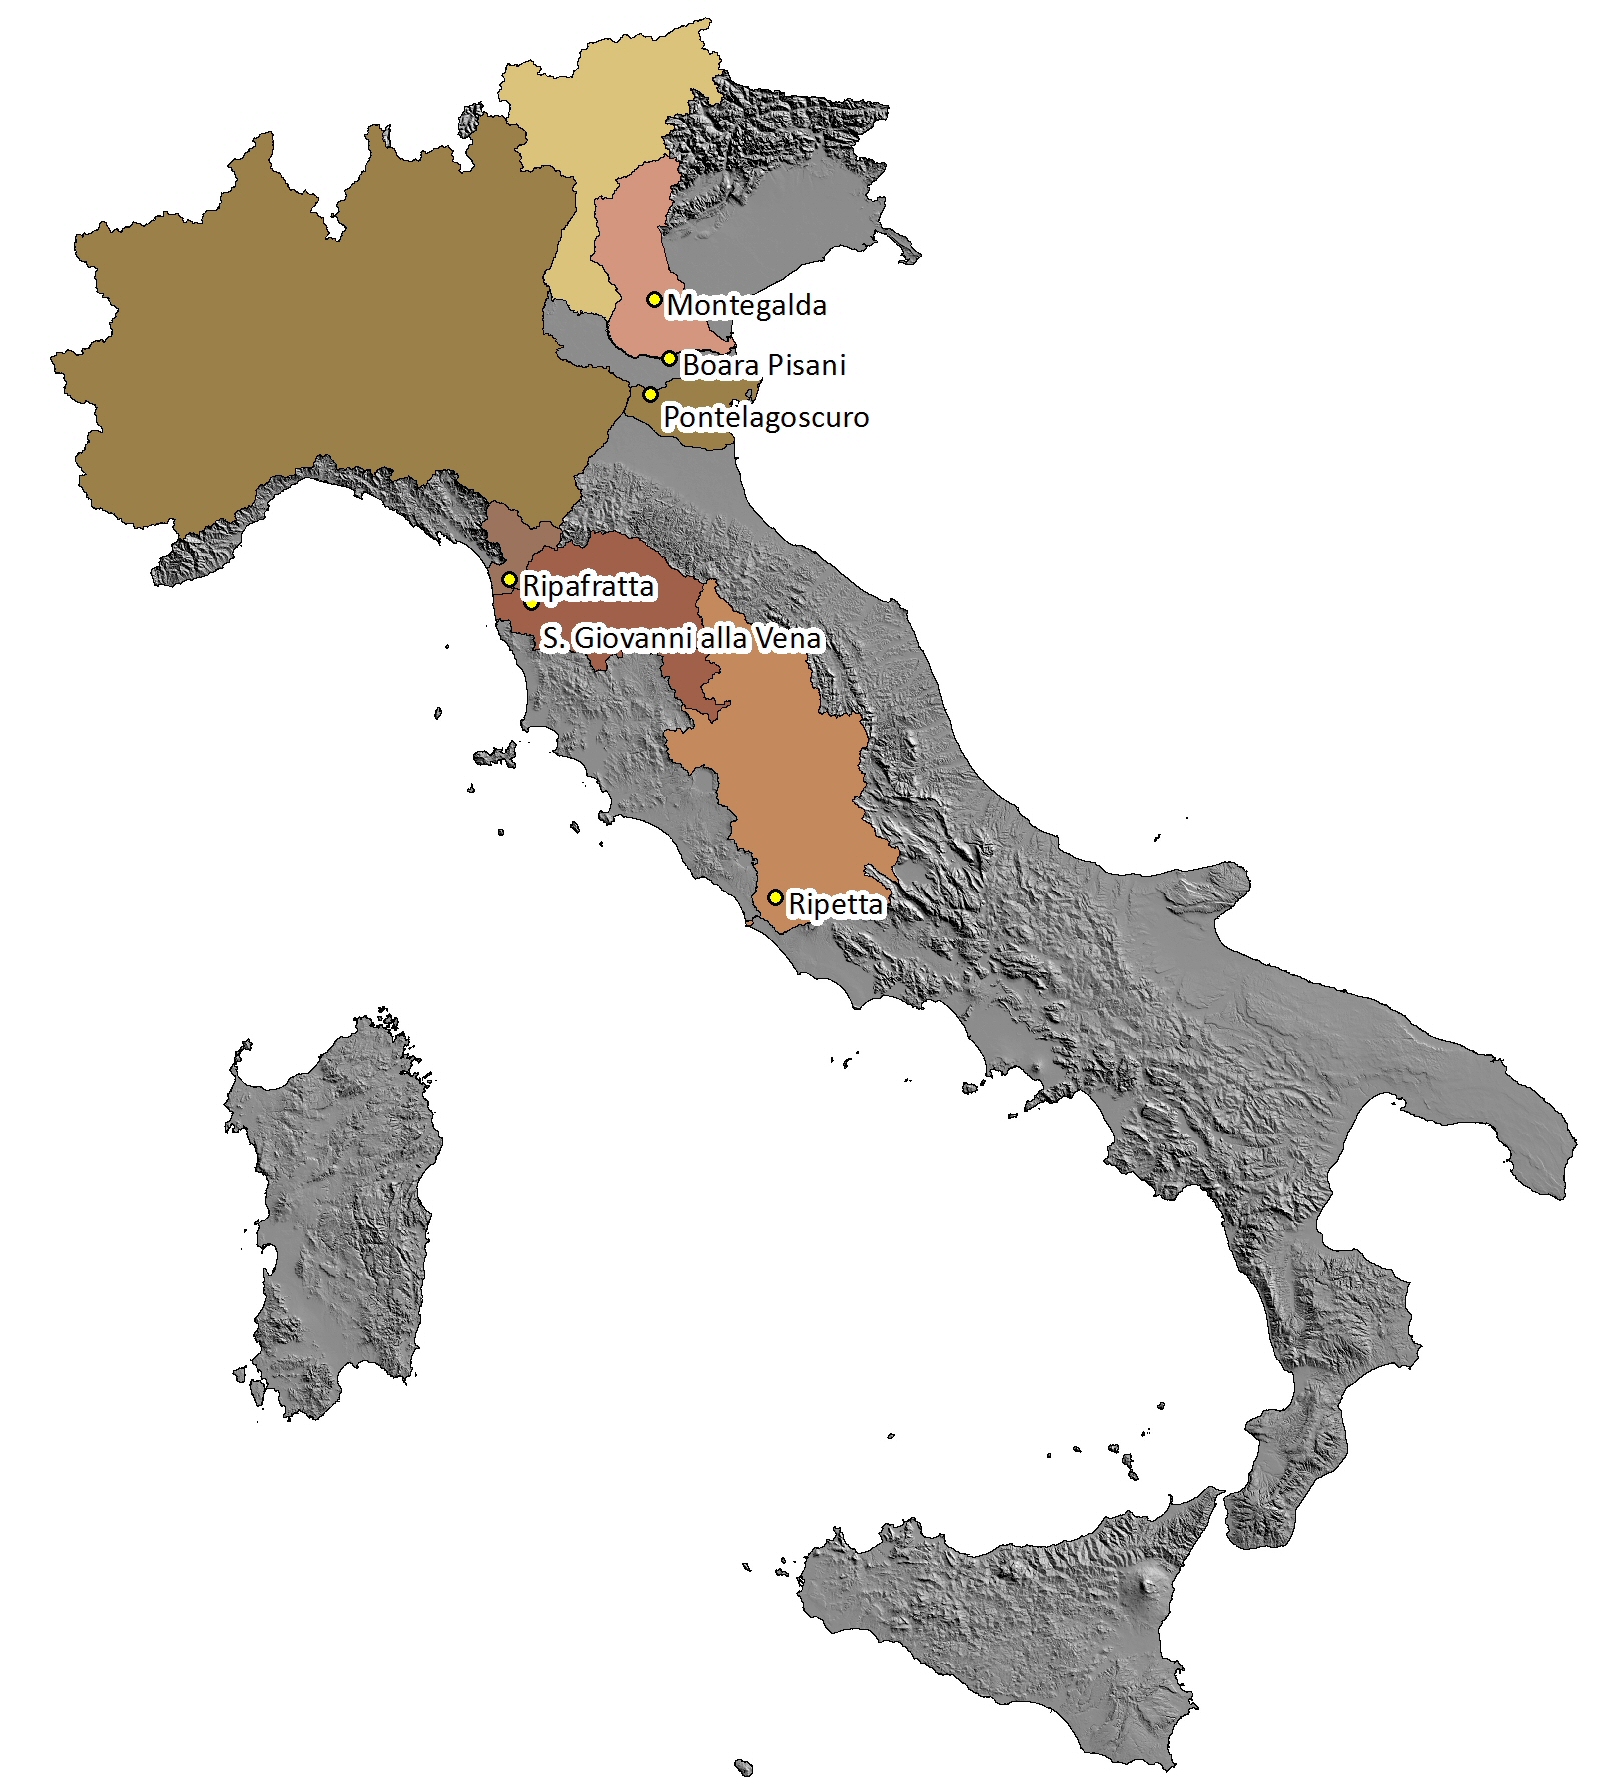
Figure 4: Localization of the flow measurement sections (Adige a Boara Pisani, Arno a San Giovanni alla Vena, Bacchiglione in Montegalda, Po in Pontelagoscuro, Serchio a Ripafratta and Tiber in Ripetta) compared to the relative hydrographic basins Data source
ISPRA processing on data provided by ARPA/APPA, Regional Civil Protection Functional Centers |
Thumbnail
Headline
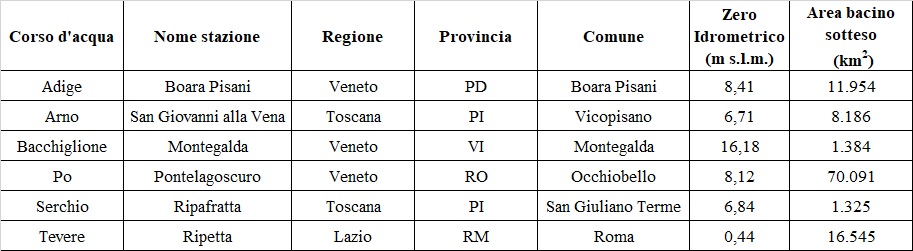
Figure 5: Characteristic information of the measuring stations of the flow rates considered Data source
ISPRA processing on data provided by ARPA/APPA, Regional Civil Protection Functional Centers |
For 4 of the 6 measurement sections considered (whose spatial location and their characteristics are shown respectively in Figure 4 and Figure 5), the annual volumes recorded in 2025 are higher than those of the decade of comparison (2016-2025), with percentages that for 2 of the 4 sections exceed 30%, while compared to the values of 2024 (Figure 1) it is not possible to establish comparisons except for the sections of Montegalda on the Bacchiglione and Pontelagoscuro for the Po In particular, for the Adige in Boara Pisani, the flow data of the months from June to September 2025 are unavailable. In the previous months the section recorded average monthly flow rates above the decade of comparison, while in the months following the restoration of the measuring station, from October to December, the flow rates remained below the average values of the decade with reductions of up to 34% in November. In December, overall, the most critical, the largest reduction was recorded in the section of San Giovanni alla Vena sull'Arno where the average monthly reach was 47% of the average value of the decade. The same section recorded modest reductions (of the order of 5%) in January and October and more marked in June, in which the reduction was more than 20%. The surplus recorded in the other months and which in March and April was more than double offset the reductions by determining an annual volume value of 30% higher than that of the decade of comparison. These assessments can be found from the observation of the graph shown in Figure 2 in which the normalized value of the average monthly flow rate is represented, obtained from the ratio between the average monthly flow rates recorded in 2025 and those derived by mediating the values of the previous decade, for which you have a continuous series of data. If the most critical months were those of June, October and December, against in the period March-April 2025, all sections recorded average monthly flow rates higher than those of the decade of comparison. This condition with the exception of the Tiber in Ripetta has also continued for the month of May although with more contained increments. Shortages of more than 20% compared to the decade of comparison occurred in November in 4 of the 6 sections considered and for the Tiber in Ripetta this condition occurs for 4 months and in general for 10 months the flow rates are kept below the average values of the decade. For the section of the Po in Pontelagoscuro as for the Bacchiglione in Montegalda there are surplus conditions of the average monthly flow rates compared to the decade for 7 months, however not able to compensate for the shortfall deficits that characterize these sections in the last months of 2025. In most of the measurement sections of the flow rates considered, the most significant floods occurred in the months between March and May months in which almost all sections record surpluses of average monthly scope compared to the decade of comparison (Figure 3).