Antonio Caputo, Daniela Romano
The indicator concerns the emissions of greenhouse gases into the atmosphere that influence climate balances. In 2024, energy processes were at the origin of 95.4% of carbon dioxide emissions, 12.4% of methane emissions and 25.1% of nitrous oxide emissions, while they did not contribute to the emissions of fluorinated substances; overall, 81% of greenhouse gas emissions were of energy origin. Between 1995 and 2024, the trend in greenhouse gas emissions from energy processes initially paralleled that of energy consumption. However, from 2004 onwards there has been a progressive decoupling, which has become more pronounced in recent years. This turning point is not due to economic decline - given that GDP shows a general upward trend - but rather to a clear reduction in energy intensity, the replacement of fuels with a high carbon content with natural gas and the growing share of renewable sources in the electricity sector and industry. In 2024 there will be a reduction in emissions from energy processes of 3.5% compared to 2023.
The indicator monitors anthropogenic emissions of greenhouse gases responsible for altering global climate balances. While the Kyoto Protocol initially regulated six main substances — specifically carbon dioxide (CO 2), methane (CH 4), nitrous oxide (N 2 O) and the fluorinated gases HFC, PFC and SF 6 — during its second commitment period (2013-2020) the regulation was extended to also include nitrogen trifluoride (NF 3). The sources of these substances reflect very different economic and environmental dynamics. Carbon dioxide comes largely from the use of fossil fuels in transport, civil heating and energy generation plants, as well as from deforestation and some industrial sectors. On the contrary, methane and nitrous oxide are mainly attributable to the primary sector, being generated by agricultural practices and livestock farming, although methane also derives from waste management and from fossil sources themselves, and nitrous from specific manufacturing chains. A separate discussion applies to fluorinated gases (F-gas) and the latest arrival NF 3: excluded from the constraints of the Montreal Protocol, they have no correlation with energy processes, but originate exclusively from dedicated industrial activities, such as the production and use of refrigeration systems.
Evaluate the role of energy processes with respect to greenhouse gas emissions, in order to reduce the impact of energy use on climate change.
The regulatory framework on the reduction of greenhouse gas emissions has undergone a profound evolution, starting from the Kyoto Protocol which imposed on Italy a reduction objective of 6.5% for the period 2008-2012 compared to 1990 levels. Although the Doha Conference in 2012 extended the Protocol until 2020, the real global turning point came with the Paris Agreement of 2015, which formalized the commitment to keep global temperature rise well below 2°C above pre-industrial levels, pursuing active efforts to limit it to 1.5°C.
At a European level, the first targets defined for 2020 included a 20% reduction in emissions compared to 1990, the satisfaction of 20% of energy needs through renewable sources and an indicative 20% improvement in energy efficiency. In that phase, emissions were divided between energy-intensive industrial plants, regulated by the European Emissions Trading System (ETS) with a national reduction target of 21% compared to 2005, and the remaining sectors regulated by the Effort Sharing Decision (ESD), for which Italy had to achieve a 13% cut compared to 2005, against a national objective of 17% of energy from renewable sources in final consumption gross.
With the launch of the European Green Deal and legislative package Fit for 55, the European Union has drastically raised its ambitions for 2030, making it binding to reduce greenhouse gas emissions by 55% compared to 1990 and translating into law the objective of climate neutrality by 2050. The 2030 targets have been consolidated by setting a binding share of renewable energy equal to at least 42.5% of the energy mix and efficiency improvements that reduce consumption by 36% for final energy and 39% for primary energy compared to the trend scenario of the PRIMES 2007 Model.
This new structure has imposed a strong reduction in emissions: the sectors covered by the European ETS system must record a contraction of 62% compared to 2005, while the non-ETS sectors are required to make an overall cut of 40%. For the latter, the distribution between the member states was governed by the Effort Sharing Regulation (ESR), which for Italy set a binding and challenging reduction objective of 43.7% compared to 2005 levels.
The planning and monitoring of these measures are coordinated by the Energy Union governance system established by EU Regulation 2018/1999, within which long-term decarbonisation strategies are inserted. Italy adopted its National Strategy to 2050 at the beginning of 2021, moving in synergy with medium-term programmatic tools. The guidelines of the Green Deal and the REPowerEU plan were initially integrated into the National Recovery and Resilience Plan (PNRR). Subsequently, the entire system of national energy and climate policies was conveyed into the National Integrated Plan for Energy and Climate (PNIEC). After the transmission of the preliminary draft, the definitive and structured text of the PNIEC was officially transmitted to the European Commission, stably aligning the Italian decarbonisation trajectories with the community objectives of the Fit for 55 and outlining a policy that combines environmental sustainability with socio-economic stability during the energy transition.
ISPRA, Italian Greenhouse Gas Inventory 1990-2024, National Inventory Report 2026 ( https://emissioni. sina. isprambiente. it/economia-nazionale/)
ISPRA, Quality Assurance/Quality Control Plan for the Italian Emission Inventory, Year 2023 ( https://emissioni. sina. isprambiente. it/economia-nazionale/)
The accuracy of the indicator decreases when moving from the national to the local level, due to the non-uniform distribution of energy production and consumption across the national territory.
ISPRA
ISPRA, Inventory of atmospheric emissions, https://emissioni. sina. isprambiente. it/economia-nazionale/
National
1990-2024
Estimate carried out as part of the preparation of the national emissions inventory. The carbon dioxide equivalent value is calculated by multiplying the emissions of each gas by the relative global warming potential with respect to carbon dioxide; for example, the conversion factors are 25 for methane and 298 for nitrous oxide according to the IPCC IV AR guidelines.
In 2024, greenhouse gas emissions were 363.5 million tonnes of CO 2 equivalent (-3.6% compared to the previous year). Emissions from energy processes were 294.5 million tonnes of CO 2 equivalent (-3.5% compared to the previous year) (Table 1).
Total greenhouse gas emissions are reduced by 30.2% in the period 1990-2024, from 520.6 to 363.5 million tonnes of CO 2 equivalent, while greenhouse gas emissions from energy processes decreased by 30.9%. Since 2005, greenhouse gas emissions from the energy sector have been decreasing thanks to the policies adopted at European and national level to promote the production of energy from renewable sources. Starting from the same year, a further shift from petroleum products to natural gas in energy production was also observed, as a consequence of the launch of the European Emissions Trading System (EU ETS). Since 2009, a further decline in sectoral emissions is due to the economic recession; an increase was recorded only between 2009 and 2010 (+2.7%) and, subsequently, in 2021 and 2022, due to the recovery from the pandemic period. The overall trend of greenhouse gases is mainly determined by the energy sector and therefore by CO emissions 2 which represent just over four-fifths of total emissions over the entire period 1990-2024 (Table 1).
| Allegati |
|---|
Thumbnail
Headline
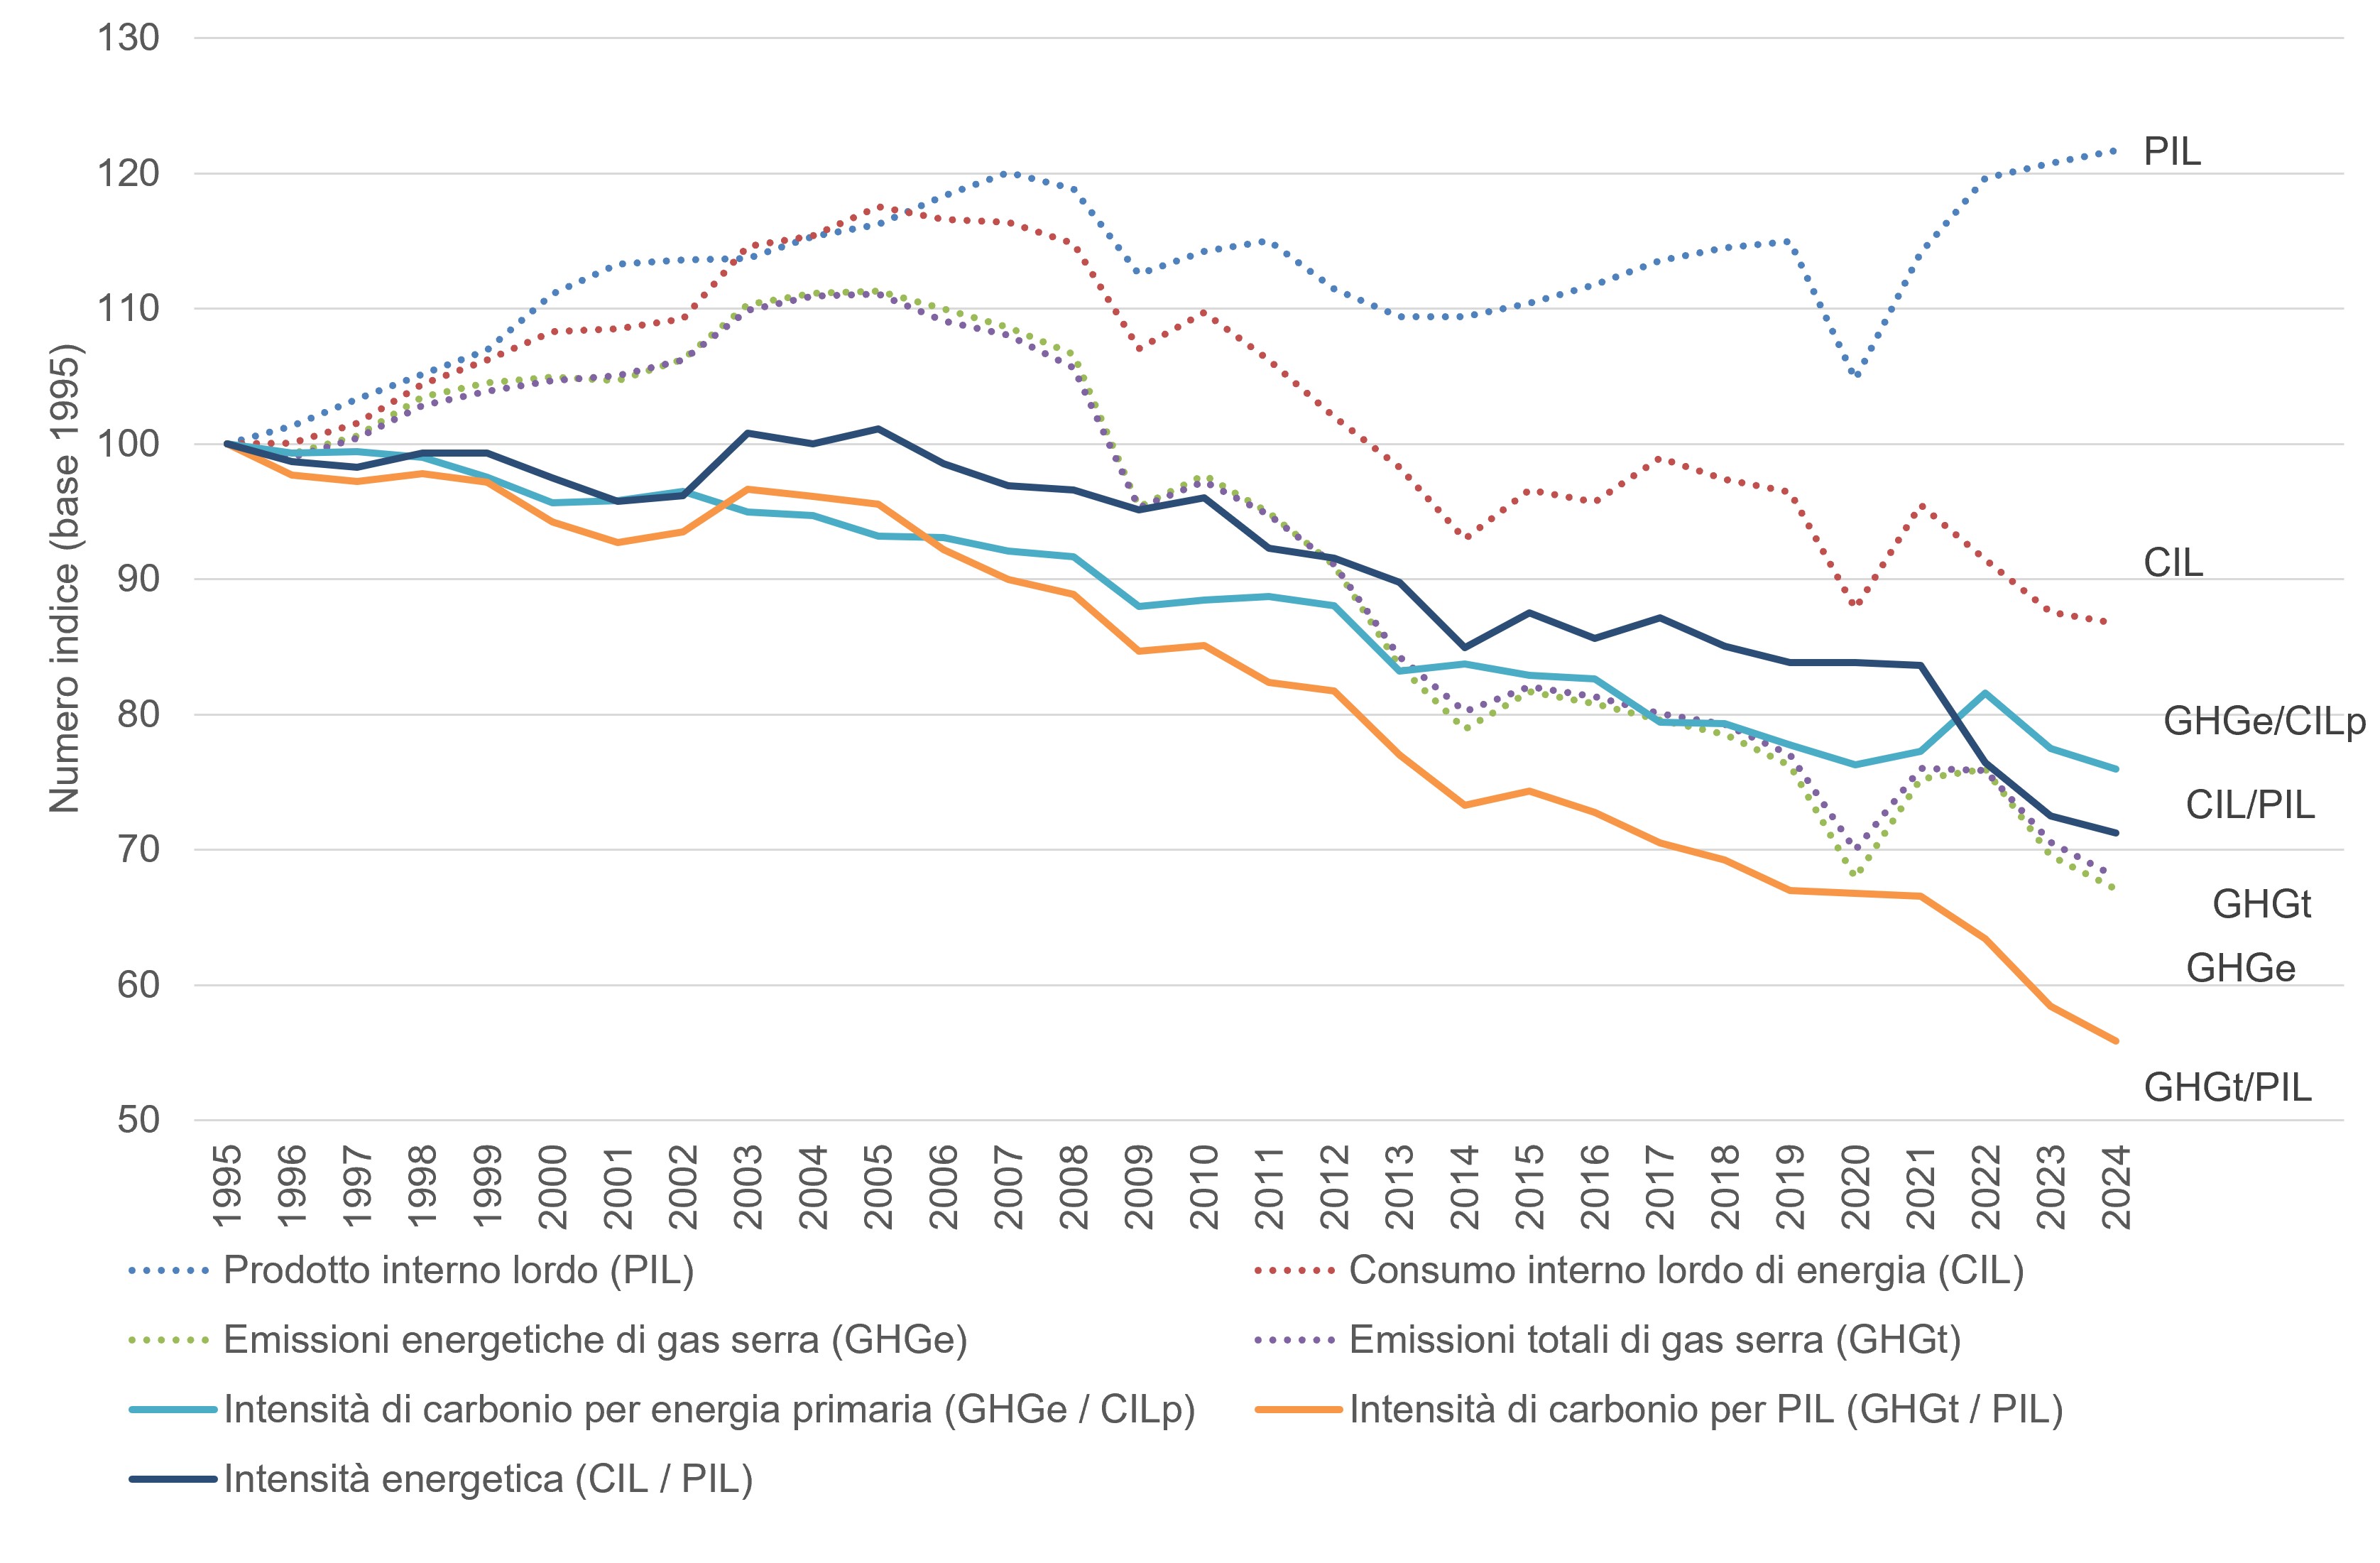
Figura 1: Emissioni di gas serra complessivi e da processi energetici Data source
ISPRA |
Headline
Tabella 1: Emissioni di gas serra da processi energetici Data source
ISPRA |
The trend in greenhouse gas emissions resulting from energy processes has experienced two clearly contrasting phases. After uninterrupted growth recorded between 1996 and 2005, the trend reversed course, ushering in a phase of constant decline. This reduction path was punctuated only by temporary economic rebounds that occurred in 2010, 2015 and 2021. Overall, the medium and long-term trajectory highlights the consolidation of a strong decarbonization process: in 2024, in fact, emissions from the energy sector recorded a contraction of 39.7% compared to 2005 levels. (Table 1). In 2024, energy processes were confirmed as the main cause of the presence of greenhouse gases in the atmosphere, originating a total of 81% of total emissions. Analyzing the individual gases, the energy sector generated 95.4% of the carbon dioxide, 25.1% of the nitrous oxide and 12.4% of the methane, without recording any contribution in terms of fluorinated substances. Isolating the perimeter of energy emissions alone, carbon dioxide represents by far the largest share with 97% of the total, despite having recorded a contraction of 30% in the period between 1990 and 2024. The remaining energy contribution is attributable to methane, which accounts for 1.8% and has fallen by 59%, and to nitrous oxide, which represents 1.2% and shows a 15% decline compared to 1990 levels.
Between 1995 and 2024, the trend in greenhouse gas emissions from energy processes initially paralleled that of energy consumption. However, from 2004 onwards there has been a progressive decoupling, which has become more pronounced in recent years. This turning point is not due to economic decline - given that GDP shows a general upward trend - but rather to a clear reduction in energy intensity, the replacement of fuels with a high carbon content with natural gas and the growing share of renewable sources in the electricity sector and industry. Figure 1 perfectly photographs the impact of recent global events: from the historic low of 2020 caused by the Covid-19 pandemic, there was a drastic and simultaneous nosedive of almost all curves (GDP, consumption and emissions) to the post-pandemic rebound: Between 2020 and 2022 there was a strong economic recovery (surge in the blue GDP line). However, it is interesting to note that while GDP soared well above pre-pandemic levels, total (GHGt) and energy (GHGe) emissions suffered only a slight rebound and then immediately resumed their decline in 2023 and 2024. This shows that the decoupling is now structural and not just cyclical. The green (GHGe) and purple (GHGt) curves move practically identically along the entire time axis. This data is fundamental because it shows that the vast majority of total greenhouse gas emissions directly depend on energy processes. Consequently, any decarbonisation policy in the country cannot ignore the transformation of the energy system.
To guarantee the consistency and comparability of the inventory, the annual update of emissions involves the review of the entire historical series on the basis of available information and the most recent methodological developments. The emission estimates are also subjected to a review process within the framework of the Framework Convention on Climate Change which verifies their compliance with the requirements of transparency, consistency, comparability, completeness and accuracy, identifies any errors, identifies estimates not supported by adequate documentation and justification in relation to the chosen methodology, thus inviting the country to review them.