Giovanni Braca, Robertino Tropeano
The indicator provides on an annual basis the evaluation, expressed as a percentage, of the relationship between the annual volume of runoff (surface runoff) and the annual volume of precipitation. This indicator aims to provide an evaluation of the quantity of water that is directly transformed into surface runoff compared to the total rainfall and to evaluate the long-term trend, also in relation to the possible impact due to climate change. The annual values of the indicator are also compared with the corresponding average value calculated over the entire period 1951–2025.
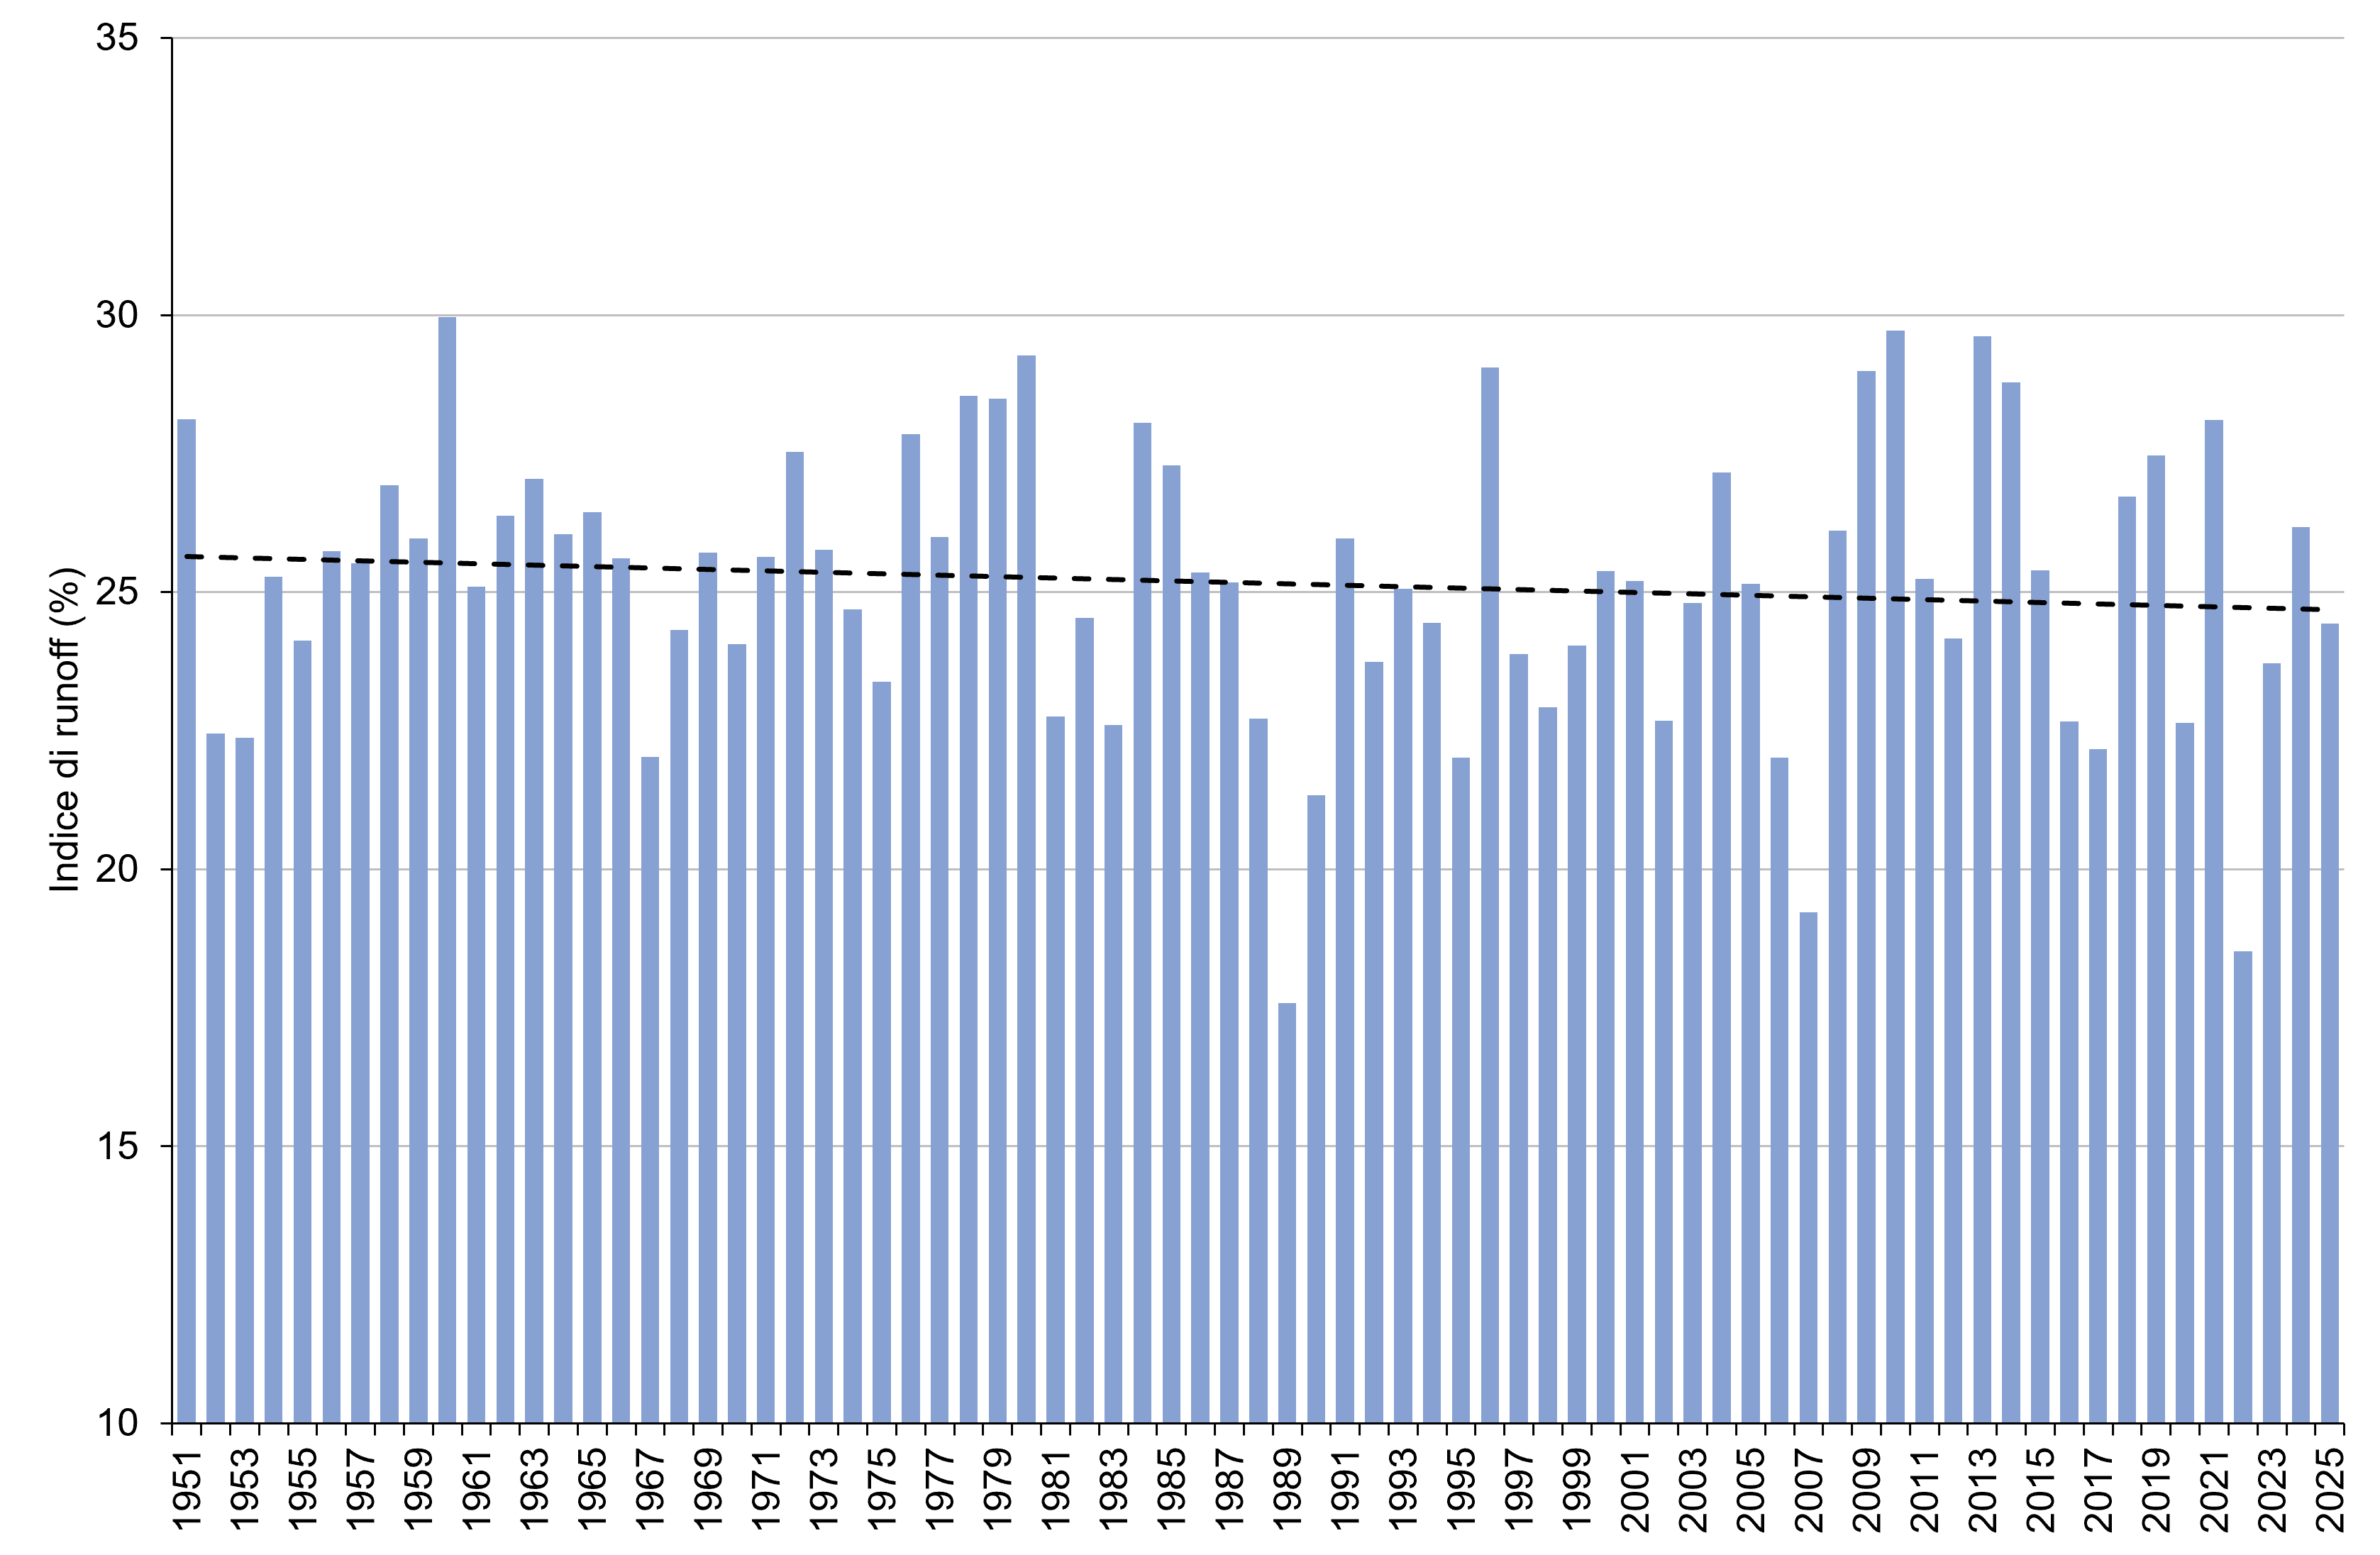
The analysis of the data for 2025 highlights an indicator value of 24.4%, remaining below the long-term historical average (25.2%). This finding marks a change in trend compared to 2024, the year in which an above-average value was recorded (26.2%). Despite this decline, the data still remains above the critical level of 2022, when the historical series had reached its second absolute minimum (18.5%).
The indicator evaluates the percentage ratio between the annual volume of surface runoff ( runoff ), i. e. The amount of precipitation that is transformed directly into surface runoff and the annual volume of precipitation compared to the national territory. In particular, runoff means the amount of precipitation which, failing to infiltrate into the ground due to soil saturation or reduced infiltration capacity, flows on the soil surface until it reaches the hydrographic network, producing surface runoff.
Provide an assessment of the amount of water that turns into surface runoff in relation to total precipitation. The indicator is specifically defined to highlight any impacts of climate change on the rainfall and runoff regime. Any trend, excluding the effect of changes in soil waterproofing, could be indicative of a change in the amount and distribution of rainfall over the course of the year.
No regulatory references.
- Amaranto, A., Mancusi, L., Viterbo, F., Bonanno, R., Braca, G., and Garofalo, E. 2025: Unraveling the uncertainties in the climate-water-energy interplay: A distributed analysis of the Italian territory. Renewable Energy, 246, 122857, DOI: 10.1016/j. renene.2025.122857.
- Braca, G., Mariani, S., Lastoria, B., Piva, F., Archi, F., Botto, A., Casaioli, M., Forte, T., Marchetti, G., Peruzzi, C., Tropeano, R., Vendetti, C., and Bussettini, M., 2023: National hydrological balance: focus on drought and natural availability of renewable water resources. Update to 2022. Reports no. 388/2023, Rome. Available online at: https://www. isprambiente. gov. it/it/pubblicazioni/rapporti/bilancio-idrologico-nazionale-focus-su-siccita-e-disponibilita-naturale-della-risorsa-idrica-rinnovabile-formazione-al-2022.
- Braca, G., Bussettini, M., Lastoria, B., Mariani, S., and Piva, F., 2021: The Gis BAsed Hydrological Balance at National Scale on Regular Grid – BIGBANG: methodology and estimates. Report on the natural availability of water resources. Reports no. 339/21, Rome. Available online at: https://www. isprambiente. gov. it/it/pubblicazioni/rapporti/il-bilancio-idrologico-gis-based-a-scala-nazionale-su-griglia-regolare-bigbang .
- SNPA, 2026: The climate in Italy in 2025, forthcoming .
- SNPA, 2023: The climate in Italy in 2022. SNPA Report n. 36/2023. Available online at: https://www. snpambiente. it/2023/07/20/il-clima-in-italia-nel-2022/.
- SNPA, 2021: Report on climate change impact indicators – 2021 Edition. SNPA Report n. 21/2021. Available online at: https://www. snpambiente. it/2021/06/30/rarancio-sugli-indicatori-di-impact-dei-cambiamenti-climatici-editore-2021/.
The indicator is constructed at the annual scale starting from the estimates of runoff and precipitation at the monthly scale carried out with the national hydrological balance model BIGBANG, version 10.0, of ISPRA on the basis of official data produced at national and local level. These temporal aggregations do not take into account the effect of precipitation intensity which influences infiltration and runoff. Furthermore, previously published estimates of the BIGBANG model may present slight deviations compared to the estimates of the latest available version as some data or schematizations underlying the model may have been improved. Correct comparisons between the indicator values must therefore be made using the same version of the BIGBANG model.
An elaboration of the indicator on a daily scale would allow us to adequately capture the effect of precipitation intensity on soil infiltration and runoff.
ISPRA
JRC (Joint Research Centre)
Regional hydro-meteorological services and those of the autonomous provinces
The precipitation and temperature data used are mostly those collected and published by the regional and provincial structures to which, based on art. 92 of Legislative Decree no. 112 of 31 March 1998, the functions and tasks of the peripheral offices of the National Hydrographic and Mareographic Service (SIMN, now merged into ISPRA) of the Department for National Technical Services were transferred. The precipitation data are collected directly from the regional structures and the autonomous provinces, while for the temperature the maps produced within the ISPRA SCIA system are used ( https://scia. isprambiente. it ). The precipitation and temperature data aggregated to the monthly scale on the BIGBANG regular grid of 1 km resolution, which covers the entire national territory, are available on the ISPRA Groupware portal ( https://groupware. sinanet. isprambiente. it/bigbang-data/library/bigbang100). Data relating to the hydraulic characteristics of soils are accessible (subject to registration) on the JRC/ESDAC portal ( http://esdac. jrc. ec. europa. eu/content/lucas-2009-topsoil-data ). For the permeability data of the hydrogeological complexes, compared to previous years, a new permeability map produced by ISPRA was used.
National
1951–2025
The estimate of the indicator series from 1951 to 2025 is carried out using the national hydrological balance model at a monthly scale developed by ISPRA, called BIGBANG-Gis BAsed Hydrological Balance at National Scale on a Regular Grid, version 10.0, which evaluates runoff as a term of the soil hydrological balance with the Thornthwaite and Mather method and precipitation as a spatial interpolation of precise data recorded by in situ networks.
The indicator is calculated starting from the monthly assessment of runoff and precipitation on a regular grid of 1 km resolution covering the entire national territory and aggregated to the annual scale. For the year the -th, the indicator IRF the (in %) is calculated as the ratio between the runoff annual RF the and annual precipitation TP the :
IRF the = ( RF the / TP the ) x 100.
In 2025 the index of runoff it is equal to 24.4% and is lower than the average calculated over the long period 1951–2025, equal to 25.2%. This means that only 24.4% of the total annual precipitation (estimated at 290.9 billion cubic meters) was directly transformed into surface runoff (71.1 billion cubic meters).
In terms of evaluating the quantity of water that transforms into surface runoff in relation to the total rainfall, resulting in the runoff lower than the long-term average, the state in 2025 can be defined as poor as it indicates a lower availability of surface water resources.
The index of runoff presents a slight decreasing trend, not statistically significant based on the Mann-Kendall test, with a significance level of 5%. The indicator takes into account the effect of the temporal variability of soil waterproofing.
The trend of the indicator is attributable to two factors, the increase in temperature and the waterproofing of the soil, which act in the opposite direction. On the one hand, the average temperature presents an increasing trend, due to climate change, which produces, due to the consequent increase in the share of evapotranspiration, a reduction in the availability of renewable water resources ( internal flow ) and therefore of the amount of precipitation that turns into runoff. On the other hand, increasing soil sealing produces the opposite effect on runoff.
| Allegati |
|---|
Thumbnail
Titolo
Figure 1: Runoff index in the period 1951-2025 Fonte
ISPRA processing on data from regional hydro-meteorological offices and autonomous provinces and historical data from the SIMN suppressed |
The index of runoff , in the period 1951–2025, varies between a minimum value of 17.6%, estimated for 1989, and a maximum value of 30.0%, estimated for 1960 (Figure 1). This means that, from 1951 to 2025, no more than 30% of the annual precipitation in Italy was transformed into surface runoff, to which base runoff, deriving from underground water circulation, must be added to obtain the total annual runoff in watercourses.
In 2025, the index of runoff (24.4%) marks a temporary reversal of trend compared to 2024, the year in which it was equal to 26.1% and higher than the long-term average (25.1%), while remaining above the relative minimum reached in 2022 (18.5%, the second smallest value in the series after that of 1989).
By analyzing the historical series of the index runoff in the long term, a slight negative trend remains, not statistically significant, which leads to a reduction in the natural availability of renewable water resources (see the "Internal Flow" indicator present in the environmental theme "Water Resources and Budget" of the Environmental Indicators Database) of which runoff constitutes a portion. This negative trend can also be attributed to the increase in temperatures. Since 2000, in Italy the average temperature anomalies compared to the 1991–2020 climatology have almost always been positive, with the exception of 2004, 2005, 2010 and 2013.
The series of values of the components of the hydrological balance, and therefore also of the index of runoff , are recalculated every year on the basis of new data sets and new schematizations, for which a correct comparison in time and space must be carried out with respect to the same version of the model.