Antonio Caputo, Giulia Iorio, Francesca Palomba
The indicator measures both the energy consumed by end users and the total energy consumption of the country. Since 1990, the available energy for final consumption has shown an upward trend, peaking in 2005. Thereafter, a reversal occurred, reaching a minimum in 2014. Between 2014 and 2018, final consumption increased again, followed by a decline in 2019 and a sharp reduction in 2020, due to the lockdown of economic activities aimed at containing the spread of the SARS-CoV-2 pandemic. Consumption then rebounded in 2021, before decreasing over the following two years. In 2023, the energy available for final consumption, calculated according to the Eurostat methodology, amounted to 110.5 Mtoe, representing a 1.3% decrease compared to 2022.
The indicator, calculated according to the Eurostat methodology, provides information on the energy requirements of the entire national economy across various sectors.
To assess trends in total energy consumption at the national and sectoral levels, with the aim of reducing overall energy use.
The European Union has updated its climate strategy framework, setting a target of a 55% reduction in greenhouse gas emissions by 2030 compared to 1990 levels, a renewable energy share of at least 42.5% (based on a provisional agreement in 2023, with an ambition to reach 45%), and an 11.7% reduction in final energy consumption relative to projections under the 2020 reference scenario.
As part of the EU energy governance process, Italy submitted the updated version of its National Integrated Energy and Climate Plan (PNIEC) to the European Commission on July 1, 2024. The PNIEC incorporates previous policy documents and outlines the necessary measures to meet EU targets on energy efficiency, renewable energy, and greenhouse gas emission reductions.
With regard to final energy consumption, and in order to contribute to the binding EU target, the PNIEC states that Italy’s final energy consumption—taking into account additional measures beyond existing policies—is expected to reach 102 Mtoe and primary energy consumption 123 Mtoe by 2030. These figures fall short of the targets set by the revised Energy Efficiency Directive (EED III), which are 93 Mtoe for final energy and 111 Mtoe for primary energy.
Binding targets for the reduction of final energy consumption are also defined, through mandatory energy efficiency schemes established under Article 7 of Directive (EU) 2018/2002. These targets entail an annual reduction of 0.8% in final energy consumption for each year from 2021 to 2030, based on the average annual consumption over the 2016–2018 period, to be achieved through active policies. This corresponds to a cumulative reduction of 73.42 Mtoe over the 2021–2030 period.
Regarding the main national legislative references for the 2020 targets, Legislative Decree No. 102/2014, as amended by Legislative Decree No. 73 of July 14, 2020, implements Directive 2012/27/EU, as amended by Directive 2018/2002/EU.
For energy efficiency targets up to 2030, the key regulatory acts include:
Regulation (EU) 2018/1999 of the European Parliament and of the Council of 11 December 2018 on the Governance of the Energy Union.
Directive (EU) 2018/2002 on energy efficiency (revising Directive 2012/27/EU), transposed into national law by Legislative Decree No. 73/2020.
Directive (EU) 2018/844, amending Directive 2010/31/EU on the energy performance of buildings and Directive 2012/27/EU on energy efficiency (Energy Performance of Buildings Directive, EPBD), transposed by Legislative Decree No. 48 of June 10, 2020.
Directive (EU) 2018/2001 on the promotion of the use of energy from renewable sources.
Directive (EU) 2023/1791 on energy efficiency.
European Environment Agency, Energy and Environment in the European Union, Environmental issue report, No. 31, 2002
European Energy and Transport Trends to 2030–2007 update. European Commission DG TREN. Office for Official Publications of the European Communities, Luxembourg, 2008
MASE, National Energy Balance, various years, https://sisen.mase.gov.it/dgsaie/
MASE, 2023, The National Energy Situation in 2023, https://www.mase.gov.it/portale/documents/20119/4325498/Relazione+Situazione+Energetica+Nazionale_+2023.pdf/a59b9cf1-42c5-7349-e4f1-11522bf500b7?t=1745351476553
Since January 2019, Eurostat has revised the historical data series by adopting a new methodology, the main change of which involves reallocating part of the consumption from the steel sector to the transformation sector. An additional methodological change was introduced in 2021, concerning the accounting of fuel consumption for self-produced heat in the industrial sector, which was previously included under transformation. As a result, the data presented are not comparable with previous editions.
ENEA (Ente per le Nuove Tecnologie, l'Energia e l'Ambiente)
EUROSTAT (Ufficio Statistico delle Comunità Europee)
MASE (Ministero dell'ambiente e della Sicurezza Energetica)
MASE, National Energy Balance, https://dgsaie.mise.gov.it/bilancio-energetico-nazionale
ENEA, Regional Energy Balances
EUROSTAT, http://ec.europa.eu/eurostat/data/database
National
1990-2023
Since 2015, Eurostat has used its established methodology for processing energy consumption data, and this applies to the entire historical data series, including data collected before 2015. In January 2019, Eurostat updated its historical data series by implementing a revised methodology. This change primarily involved shifting some consumption from the steel sector to the transformation sector. As a result, the data presented are not comparable with previous editions.
In 2023, total energy consumption amounted to 142.2 Mtoe, of which 50.3 Mtoe came from natural gas, 52.2 Mtoe from oil and petroleum products, and 29.2 Mtoe from renewable energy sources. Minor contributions came from solid fuels (4.8 Mtoe), non-renewable waste (1.2 Mtoe), and imported electricity (4.4 Mtoe) (Table 1).
Energy consumption in 2023 showed a decrease compared to the previous year (-4%). An analysis by energy source reveals the following changes compared to 2022: solid fuels: -35%, petroleum products: +1.3%, natural gas: -10.3%; renewable sources: +3.7%, non-renewable waste: +1%, electricity: +19.2%.
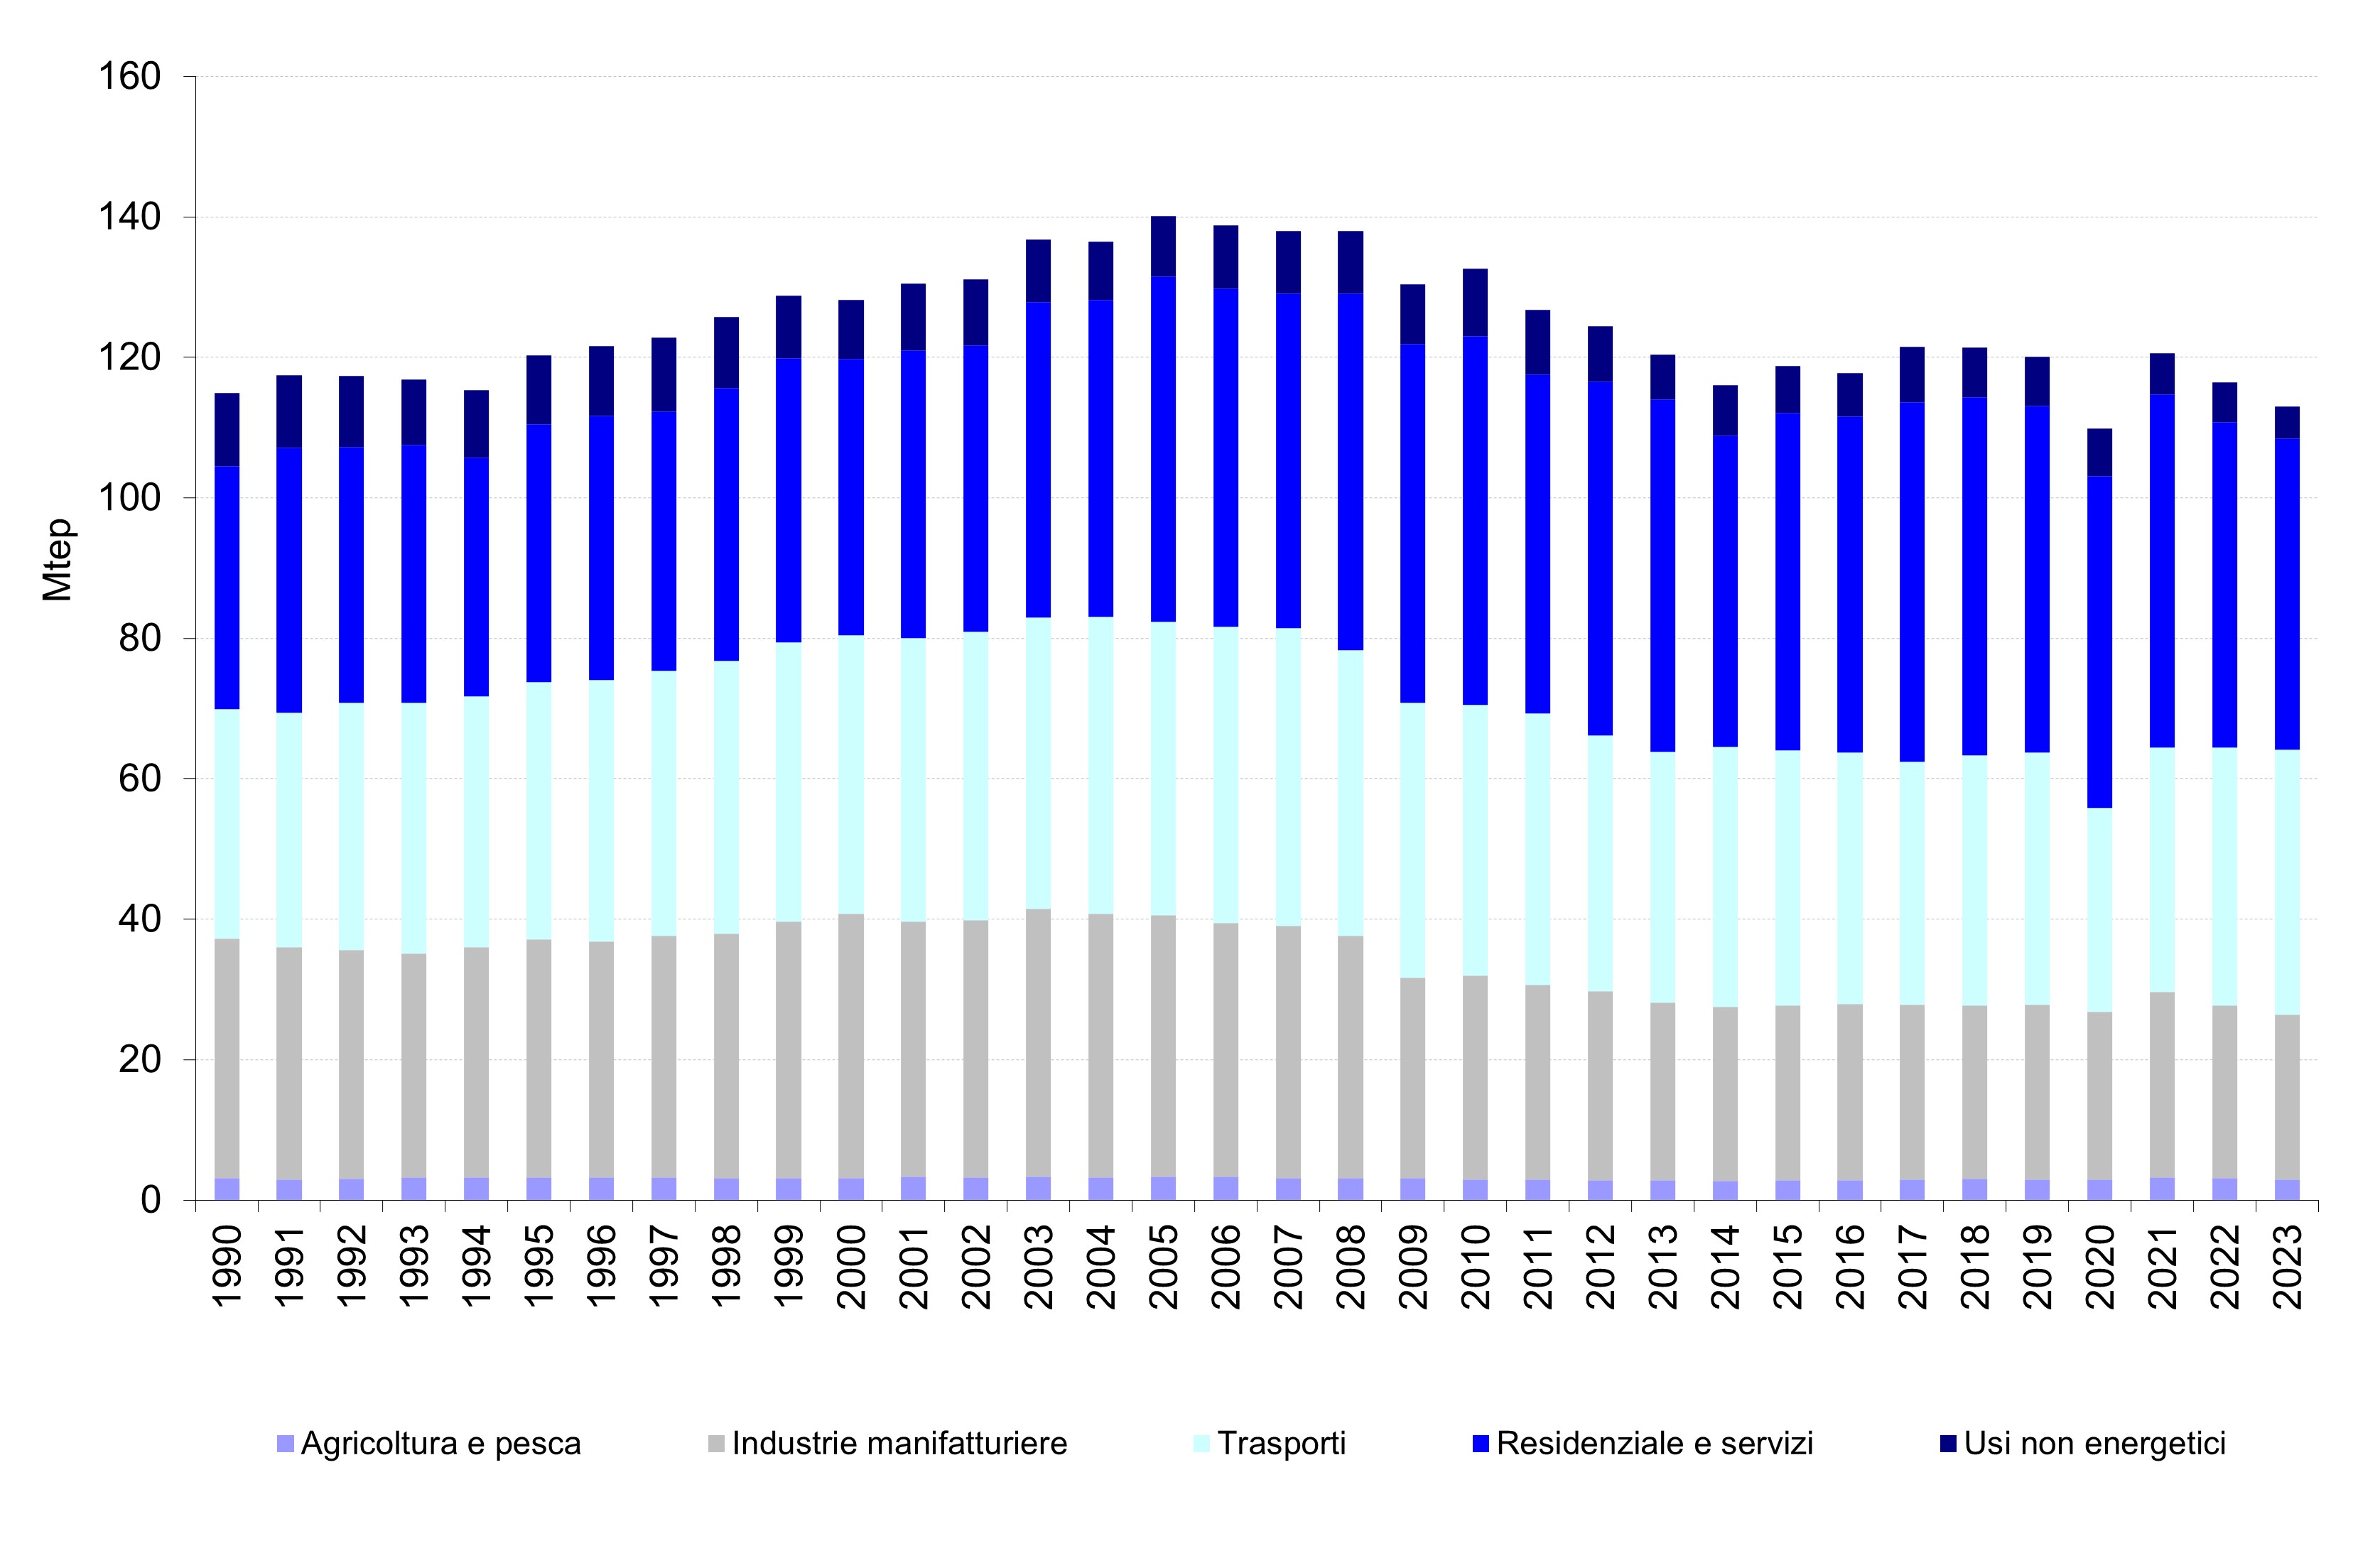
Since 1990, there has been a general upward trend in the energy available for final consumption, with a peak reached in 2005 (+21.3% compared to 1990). This was followed by a reversal of the trend, with consumption falling in 2014 by 18.4% compared to 2005 and by 1% compared to 1990 (Table 1 and Figure 1). The decline in consumption was accelerated by the economic crisis.
From 2015, energy availability for final consumption showed a recovery until 2017, followed by a downward trend in subsequent years. The significant reduction recorded in 2020 (-7.9% compared to 2019) was due to the lockdown of economic activities aimed at containing the spread of the SARS-CoV-2 pandemic. In 2021, a 10.1% increase in energy available for final consumption was observed compared to 2020, followed by declines in the subsequent years, reaching 110.5 Mtoe in 2023 — a level 4% lower than in 1990.
Final energy consumption by sector shows varying trends compared to 1990: in agriculture, consumption decreased by 4.3%, while in industry it declined by 31.4%. The transport sector recorded an increase of 15.3%, while the residential and services sectors saw growth of 5.9% and 103.1%, respectively.
| Data |
|---|
Headline
Table 1: Final Energy Consumption by Economic Sector Data source
MASE, ENEA, EUROSTAT Data legend
* Water supply consumption is included in the Services sector |
Thumbnail
Headline
Figure 1: Final Energy Consumption by Economic Sector Data source
MASE, ENEA, EUROSTAT Data legend
* Water supply consumption is included in the Services sector |
National final energy consumption peaked in 2005, followed by a sharp decline from 2009 to 2014 due to the economic crisis. The subsequent years showed a recovery up to 2017, followed by a contraction in consumption, with a particularly significant drop in 2020 as a result of the pandemic. In 2021, consumption rebounded, followed by a downward trend in the most recent years.
In 2023, the transport and services sectors were the only ones to record an increase in final energy consumption compared to the previous year, with rises of 2.8% and 2.9%, respectively. In all other sectors, consumption decreased: industry (-5%), agriculture and fisheries (-4.3%), and residential (-8.2%).