Irma Lupica
In 2023, approximately 1.1 million tons of special waste were sent for incineration, of which nearly 690 thousand tons (64.7% of the total) were non-hazardous and almost 376 thousand tons (35.3% of the total) were hazardous.
The incineration plants in operation treating such waste amounted to 74, of which 44 were located in the North, 8 in the Center, and 22 in the South.
Consistent with the distribution of the plant infrastructure, the majority of Waste from Economic Activities was treated in plants located in the North (82.6% of the total, nearly 880 thousand tons), followed by the southern regions (15.4%, 164 thousand tons) and the central regions (2%, about 22 thousand tons).
An "incineration plant" is defined as any unit and technical equipment, either fixed or mobile, intended for the thermal treatment of waste with or without recovery of the heat produced by combustion. The indicator in question measures the quantities (expressed in tons) of Waste from Economic Activities treated in incineration plants and the corresponding number of plants present in the territory.
The indicator measures the quantities (in tons) of Waste from Economic Activities treated in incineration plants and the number of incineration plants present across the country.
The European regulatory framework for waste incineration is provided by Directive 2010/75/EU of the European Parliament and Council of November 24, 2010, concerning industrial emissions (integrated pollution prevention and control), which has been implemented nationally in Title III-bis of Part IV of the Environmental Code (Legislative Decree 152/06). This directive regulates waste incineration and co-incineration for both hazardous and non-hazardous waste, from the construction of plants to the various stages of incineration, from the reception of waste to the disposal of residues.
The directive sets specific provisions regarding:
-
Emission limit values
-
Methods for sampling, analyzing, and evaluating pollutants from waste incineration and co-incineration plants
-
Technical criteria for the construction, functional, and operational characteristics of incineration and co-incineration plants, with particular emphasis on ensuring integrated environmental protection from emissions caused by these plants
-
Timelines for compliance with new provisions for existing plants.
The Commission Decision 2019/2010/EU established conclusions on Best Available Techniques (BAT) for waste incineration, which serve as a reference for setting authorization conditions, including emission limit values under normal operating conditions for installations subject to Directive 2010/75/EU (IPPC).
ISPRA - Rapporto rifiuti speciali 2025
No limitation
None
ISPRA/ARPA/APPA
Modello Unico di dichiarazione Ambientale MUD ISPRA - Catasto rifiuti (http://www.catasto-rifiuti.isprambiente.it).
National, Regional
2011-2023
The indicator measures the quantity of Waste from Economic Activities incinerated in Italy. Information is provided by the different waste types, i.e., hazardous and non-hazardous Waste from Economic Activities treated in incineration plants. Additionally, data is provided on incineration quantities both by individual plant and at a regional level. The information is based on the data contained in the Unified Environmental Declaration Form, submitted by the entities identified under Article 189, paragraph 3 of Legislative Decree no. 152/2006 to the Chambers of Commerce, Industry, Crafts, and Agriculture. The indicator also measures the number of Waste from Economic Activities incineration plants.
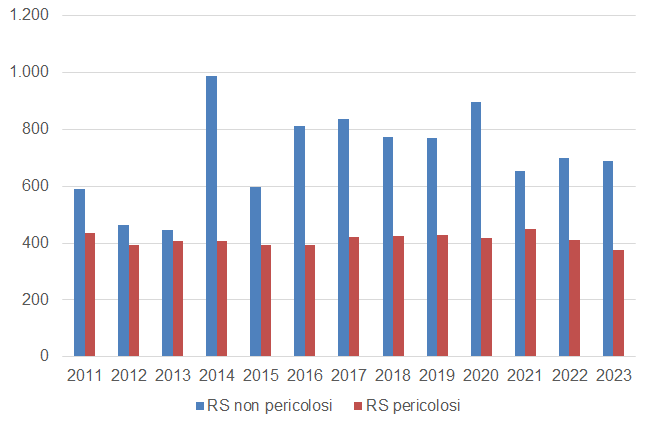
In 2023, approximately 1.1 million tonnes of Waste from Economic Activities were sent for incineration, of which almost 690 thousand tonnes (64.7% of the total) were non-hazardous and nearly 376 thousand tonnes (35.3% of the total) were hazardous (Table 1).
The total number of plants that received Waste from Economic Activities amounted to 74, 29 of which were mainly authorized for the treatment of municipal waste (Table 4).
In Italy, the incineration of Waste from Economic Activities represents a residual disposal operation, which in 2023 accounted for 0.6% of the total managed waste (around 179 million tonnes). Compared to 2022, there was a reduction of 43 thousand tonnes (-3.9%) in the quantity of special waste incinerated (Table 1).
On the other hand, the number of incineration plants increased by 4 units (Table 3).
In the period 2011–2023, the number of incineration plants decreased by 26 units, while the amount of special waste incinerated increased by 3.7% (Table 1 and Table 3).
| Data |
|---|
Headline
Table 1: Quantity of Waste from Economic Activities incinerated in Italy, by type of waste Data source
ISPRA |
Headline
Table 2: Quantity of total Waste from Economic Activities and hazardous Waste from Economic Activities incinerated in Italy Data source
ISPRA |
Headline
Table 3: Number of incineration plants for Waste from Economic Activities Data source
ISPRA |
Headline
Table 4: Quantity of Waste from Economic Activities treated in incineration plants with energy recovery (R1) – (2023) Data source
ISPRA |
Thumbnail
Headline
Figure 1: Trend of Waste from Economic Activities incinerated in Italy, by type of waste Data source
ISPRA |
In 2023, approximately 1.1 million tonnes of Waste from Economic Activities were sent for incineration, treated both in Waste from Economic Activities incineration plants and in facilities primarily dedicated to the treatment of municipal waste, authorized by the competent authorities as disposal plants (D10) and/or energy recovery plants (R1), pursuant to Note 4 of Annex C of Legislative Decree 152/06. In particular, 713 thousand tonnes of Waste from Economic Activities were treated through the R1 recovery operation (Table 4).
In 2023, the total number of Waste from Economic Activities incineration plants across the national territory was 74, of which 44 located in the North, 8 in the Center, and 22 in the South (Table 3).
Regional data show that Lombardy accounts for 51.5% of the total Waste from Economic Activitiesincinerated in Italy and 47.6% of hazardous waste, while Emilia-Romagna accounts for 13.3% of the Waste from Economic Activities incinerated (Table 2). Compared to 2022, the quantities of hazardous and non-hazardous Waste from Economic Activities decreased by 8.2% and 1.3%, respectively (Table 1 and Figure 1).