Antonio Caputo, Monica Pantaleoni
The indicator provides information on the variation in hourly peak electricity demand during the summer period (May-September) for cooling compared to peak demand for all other uses. The values show an increasing trend over the period analyzed, with different rates for the different months and particularly significant in June and July. In 2000, peak values ranged from 43.30 GW in May to 47.38 GW in July, while in 2024, maximum power absorbed reached 57.81 GW in July, confirming a structural growth in peak load driven by summer air conditioning. With the increase in average global temperatures, future scenarios predict a reduction in energy consumption for space heating and an increase for cooling: the overall effect on energy demand will depend on the trend of local and seasonal meteorological parameters as well as the structure of energy supply.
The indicator provides information on the variation in hourly peak electricity demand during the summer period (May-September) for cooling compared to peak demand for all other uses. Peak electricity demand during this time of year depends on various factors, including building cooling. Rising temperatures correspond to an increase in the use of cooling systems and therefore in electricity demand.
Evaluate the variation in hourly peak electricity demand at the national level between May and September, net of consumption for other purposes.
The indicator has no direct reference to regulatory elements. However, the regulatory framework for the management and security of the electricity grid during peak conditions includes Legislative Decree 79/1999 (Bersani Decree) for the assignment of national transmission and dispatching functions to Terna S.p.A. This is complemented by Terna's Network Code, approved by ARERA, which regulates the system's adequacy and security criteria, Legislative Decree 93/2011 on the security of electricity supplies, and the Ministerial Decree of October 28, 2019, which introduced the Capacity Market to ensure the availability of programmable power during peak summer and winter demand.
The indicator is not directly linked to climate change, as it is also influenced by non-climatic factors. However, it can be considered an indicator of interest for the topic of climate change impacts, providing useful information for studying the effects of rising average temperatures on energy demand for cooling.
Possible actions to fill knowledge gaps and improve the interpretation of the indicator could involve expanding the historical data series to cover at least the decade 1990-1999. Furthermore, assessments of the correlation with temperature trends could contribute to a better understanding of the impact of temperature on peak summer electricity demand.
Terna - National Electricity Network S.p.A.
Terna SpA - Annual statistics on electricity production and consumption in Italy
https://www.terna.it/it/sistema-elettrico/statistiche/pubblicazioni-statistiche
National Team (I)
2000-2024
Monthly peak electricity demand (GW)
Terna S.p.A. provides the monthly peak demand. The peaks of the summer months are subtracted from the average of the peaks recorded in April and October. These latter months are considered representative of consumption net of thermal uses.
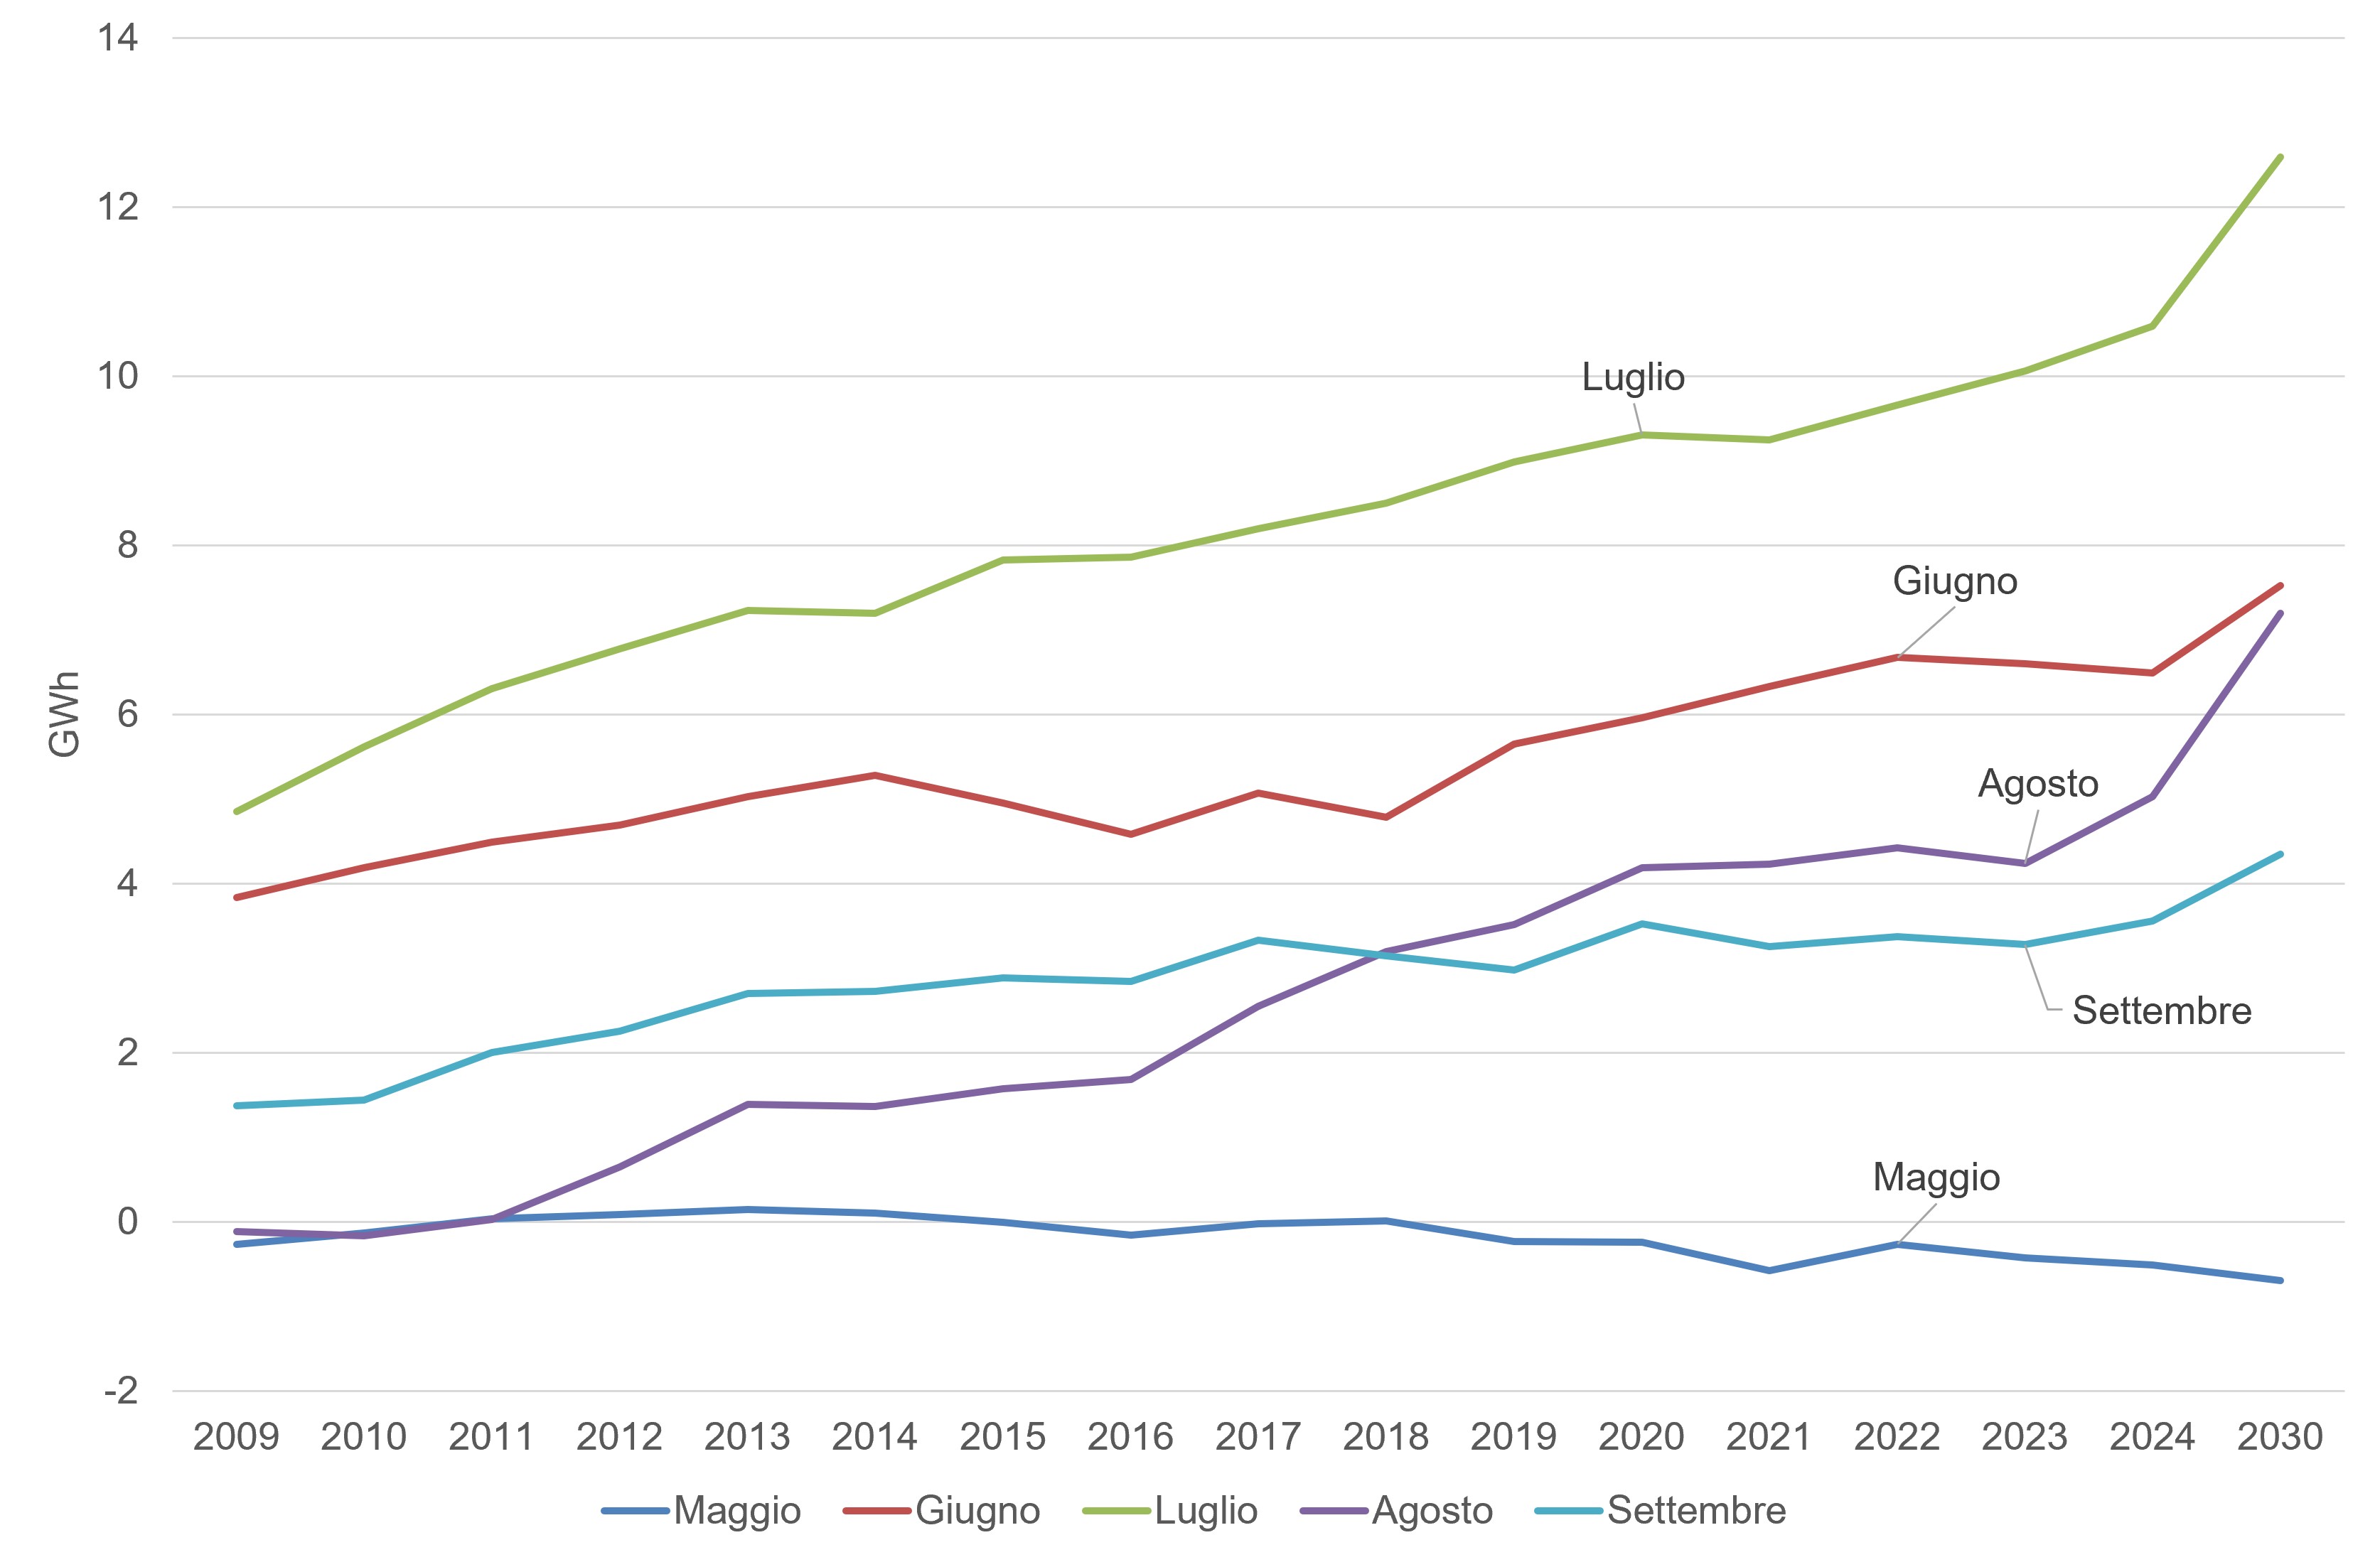
In 2024, monthly peaks reached 44.70 GW in May, 51.51 GW in June, 57.81 GW in July, 55.75 GW in August, and 52.16 GW in September. July remains the month of maximum stress for the national electricity system, followed shortly thereafter by a particularly high August compared to the historical average (Table 1).
Between 2000 and 2007, peak power experienced constant and sustained growth, exceeding the 56 GW threshold for the first time in July 2007 (56.59 GW). Between 2008 and 2016, there was a phase of stabilization and decline, influenced by the economic crisis and the decline in industrial consumption. From 2017 to 2024, the trend highlights a renewed consolidation of summer peaks at high levels (stable between 55 GW and 58 GW in July), with an extension of the stresses also in the months of August and September due to the rise in average temperatures and the extension of the hot seasons.
| Data |
|---|
Headline
Table 1: Hourly peak energy demand in the summer months Data source
ISPRA processing on TERNA data |
Thumbnail
Headline
Figure 1: Hourly peak energy demand in the summer months Data source
ISPRA processing on TERNA data |
The evolution of summer peaks highlights the profound transformation of the Italian load profile. The high concentration of demand in the months of July and August requires an increasingly flexible and resilient system, capable of managing steep load ramps. The growing trend of peak energy demand in the summer season is certainly linked to the increasingly widespread use of air conditioning systems, now widespread in public buildings as well as private apartments. The observed peaks in electricity demand (Table 1 and Figure 1) are increasingly high over time and, in all likelihood, will reach higher values than those typically seen in winter in the coming decades, resulting in record consumption. The stability of the energy system will therefore be an essential condition for ensuring the required energy supplies. Among the key factors behind this phenomenon are undoubtedly the increase in average summer temperatures and the occurrence of heat waves. In this sense, the indicator is considered of interest in terms of the impacts of climate change, in view of a future scenario most likely characterized by higher temperatures and more frequent heat waves in the Mediterranean region.