CONTAMINATED SITES OF NATIONAL INTEREST

Data aggiornamento scheda:
Immagine

The indicator describes the status of the 42 Contaminated Sites of National Interest (SIN), which together cover 148,594 hectares of land surface (0.49% of the Italian territory) and 77,136 hectares of marine areas. This issue affects all Italian regions, except Molise. As of 30 June 2024, for 65% of the total area of the 36 SINs under consideration, information is available on the progress of the procedures: characterization has been completed for 59% of the soils and 55% of the groundwater, while remediation/safety measures have been approved by ministerial decree for 13% of the soil area and 17% of the groundwater. Procedures have been completed for 17% of the soils and 6% of the groundwater. The information provided by the indicator outlines a representative picture of environmental conditions and societal responses in relation to regulatory and sustainability objectives.

ENERGY DEPENDENCY

Data aggiornamento scheda:

The indicator illustrates the national economy’s dependence on imports of various energy sources to meet its energy requirements. A reduction in the share of oil and an increase in the share of renewable energy sources contribute to a decrease in national energy dependency. Since 2007, a downward trend has been observed, with energy dependency falling from a peak of 85.5% in 2006 to a low of 75.1% in 2020. In 2021, the dependency rate rose to 76.9%, and continued to increase in 2022, reaching 78.7%.

ENERGY RESOURCE EXTRACTION SITES: GEOTHERMAL ENERGY

Data aggiornamento scheda:
Immagine

In Italy, geothermal energy, renewable and sustainable, is concentrated in 10 concessions in Tuscany with 34 plants that, in 2023, produced 5,692 GWh, covering 31% of the regional demand and 70% of Tuscany's renewable energy sources.

The direct uses of geothermal heat (climate control, spa use, district heating) and geothermal heat pumps, about 20,000, are growing but still underutilized compared to Northern European countries. The environmental impact is limited and mitigated by abatement systems (AMIS) and reinjection of fluids. Italian resources, concentrated in the Tuscan-Lazio area, also show potential for recovery of strategic elements such as lithium, crucial for the energy transition.

ENVIRONMENTAL INFORMATION AND COMMUNICATION ON THE WEB

Data aggiornamento scheda:

As of July 2024, the provision of environmental information and communication tools on the web by the monitored institutions remains stable compared to 2023. This applies both to the overall average score of the monitored websites (31 points out of a maximum of 48), and when considering the average scores of SNPA websites (29 points) and those of research institutions and the MASE (37 points). Sixteen websites achieved a score equal to or above the overall average of 31. The institutional website with the most comprehensive set of tools and web content is that of the INGV, with 42 points.


FINAL AND TOTAL ENERGY CONSUMPTION BY SECTOR

Data aggiornamento scheda:

The indicator measures the energy consumed by end users and the total energy consumed by the country. Since 1990, there has been a general upward trend in the energy available for final consumption, reaching a peak in 2005. This was followed by a reversal, with consumption declining to a minimum in 2014. From then until 2018, a recovery in final consumption was observed, followed by a decrease in 2019 and a sharp drop in 2020 due to the lockdown of economic activities aimed at containing the spread of the SARS-CoV-2 pandemic. Consumption then rebounded in 2021, before declining again in 2022. In 2022, the energy available for final consumption—calculated according to the methodology adopted by Eurostat—amounted to 112.0 Mtoe, a 6.9% decrease compared to 2021.

FINAL ELECTRICITY CONSUMPTION BY SECTOR

Data aggiornamento scheda:

Final electricity consumption grew steadily from 1990 to 2008, then declined due to the economic crisis. From 2015, consumption resumed growth until stabilizing in 2017. Following the SARS-CoV-2 pandemic, 2020 consumption dropped by 5.7% compared to the previous year, with a rebound of 6.2% in 2021. In 2022, consumption decreased by 1.8% compared to 2021, settling at 24.7 Mtep (million tonnes of oil equivalent). The industrial sector's share of consumption fell from 51.7% in 1990 to 38.9% in 2022, while the civil sector (residential and tertiary) increased from 43.2% to 55.6%. The agriculture and fisheries sector remained nearly constant at around 2%, and the transport sector, despite fluctuations, stayed stable at 3.1%.

FREIGHT TRANSPORT DEMAND AND INTENSITY

Data aggiornamento scheda:

The indicator evaluates the demand for freight transport (also in relation to economic growth) and the evolution over time of modal split. The transport demand is increasingly met by road freight transport, which continues to dominate other transport modes in terms of growth and modal share (approximately 62% in 2023).

FROST DAYS

Data aggiornamento scheda:

This indicator describes trends in cold extremes across Italy, specifically quantifying the number of frost days, defined as days with daily minimum air temperature less than or equal to 0°C. In 2023, a reduction of approximately 10 frost days was observed compared to the 1991–2020 climatological baseline.

GREENHOUSE GAS EMISSIONS (CO2, CH4, N2O, HFCS, PFCS, SF6): TREND AND PROJECTIONS

Data aggiornamento scheda:

The indicator represents projections of national greenhouse gas emissions up to 2040, based on the current policies scenario as of 31/12/2022, including those implemented under the National Recovery and Resilience Plan (NRRP), as well as the additional policies and measures scenario defined in the Integrated National Energy and Climate Plan (INECP). The scenarios are calculated starting from the most recent consolidated historical data for 2022, and reflect the expected evolution of key macroeconomic drivers as reported to the European Commission. The projected reductions in total greenhouse gas emissions (including LULUCF) by 2030, compared to 1990 levels, are estimated at -38% under the current policies scenario and -49% under the additional measures scenario.

GROSS INLAND ENERGY CONSUMPTION BY SOURCE

Data aggiornamento scheda:

The analysis of the contribution of different primary energy sources to gross inland energy consumption shows that the dominant role of petroleum products is declining, while natural gas (37.9% of the total in 2022) and renewable sources (19.0% of the total in 2022) are increasing. Greater diversification and the growing role of renewables have a positive impact on Italy’s energy self-sufficiency level, which remains among the lowest in industrialized countries.

MAIN LANDSLIDE EVENTS

Data aggiornamento scheda:
Immagine

The indicator provides information about the major landslide events caused fatalities, injuries, evacuations, damage to buildings, cultural heritage, and primary linear communication infrastructure or service networks in the national territory in the past year. The major landslide events occurred in 2023 were 192, with 11 deaths, 24 injuries, and damage mainly to the road network and buildings.

MEAN TEMPERATURE

Data aggiornamento scheda:

The indicator describes the trend of mean temperature in Italy.
The increase in mean temperature recorded in Italy over the last thirty years has often exceeded the global average over land. In 2023, the mean temperature anomaly in Italy, relative to the 1991–2020 climatological baseline, was +1.14 °C—higher than the global land surface anomaly of +0.86 °C. In Italy, 2023 ranked as the second warmest year in the entire annual time series starting from 1961. Since 2000, temperature anomalies relative to the 1991–2020 baseline have consistently been positive, except for four years (2004, 2005, 2010, and 2013).

OVEREXPLOITED FISH STOCKS

Data aggiornamento scheda:

During the 2007-2022 period, the majority of the assessed fish stocks are in a state of overexploitation: the fishing-induced mortality is higher than that necessary for a sustainable exploitation of the resources in the long term under average environmental conditions.

In the 2020-2022 triennium, the lowest values in the historical series were recorded, with approximately 60% of stocks classified as overexploited, indicating a relative improvement.

This indicator, based on internationally validated analytical stock assessments, reflects the overall trend in the exploitation status of commercially fished stocks, highlighting the condition of harvested resources. The indicator is also associated with the percentage coverage of landed fish stocks for which stock assessments are available. The analysis is conducted at both the national and subregional levels, following the geographic division defined by the Marine Strategy Framework Directive.

PASSENGER TRANSPORT DEMAND AND INTENSITY

Data aggiornamento scheda:

The indicator measures passenger transport demand (according to different modes) and compares its trend with that of economic growth and population. Transport demand is increasingly met by individual road transport (passenger cars and motorcycles), which, due to its growth and modal share (approximately 81% in 2023), remains dominant compared to other transport modes.

QUANTITY OF RECOVERED SPECIAL WASTE

Data aggiornamento scheda:

The indicator measures the total quantity of special waste sent for recovery operations (R1-R12) as defined in Annex C of Legislative Decree 152/2006. In 2022, the amount of recovered special waste was significant, accounting for 73.3% of the total managed waste (176.6 million tons), with a continuously increasing trend (+13% in the last three years). The total quantity of recovered special waste amounts to 129.4 million tons, of which 4.2 million tons are hazardous. The region with the highest quantity of recovered special waste is Lombardy (28% of the total recovered), followed by Veneto (10.9%) and Emilia-Romagna (9.2%). 

RECYCLING/RECOVERY OF CONSTRUCTION AND DEMOLITION WASTE

Data aggiornamento scheda:

Construction and demolition waste represents, in absolute terms, the most significant flow of special waste produced both at the European and national levels. The construction sector, through its intensive use of natural resources, has a strong impact on the environment, leading to the depletion of raw materials due to the extraction of natural aggregates.

For this reason, the European Commission has prioritized the monitoring of construction and demolition waste flows, setting a specific target for reuse preparation, recycling, and other material recovery operations, including backfilling, under Article 11 of Directive 2008/98/EC on waste.

In 2022, the recovery and recycling rate for construction and demolition waste stood at 79.8%, exceeding the 70% target set for 2020 by Directive 2008/98/EC. 

SPECIAL WASTE PRODUCTION

Data aggiornamento scheda:

In 2022, a year marked by a delicate international geopolitical context, the production of special waste generated by the national production system (industrial, commercial, artisanal, and service activities, as well as waste treatment and environmental remediation) recorded a decline compared to 2021. This trend was similar to that observed for urban waste, with total production amounting to 161.4 million tons (-2.1%, equivalent to 3.4 million tons). Non-hazardous waste, which accounts for 93.8% of total waste produced, decreased by 2.7 million tons (-1.8%), while hazardous waste dropped by almost 680,000 tons (-6.4%). 

The construction sector continued to show an increase, although more contained than in the previous year, due to government incentives for building renovation aimed at improving energy efficiency, along with construction activities related to infrastructure, public works, residential, and commercial buildings. 

SPECIFIC CO₂ EMISSIONS

Data aggiornamento scheda:

The indicator allows the evaluation of the trend of specific carbon dioxide emissions of the circulating car fleet through the comparison between the values resulting from type-approval procedures and the values deriving from the actual use of vehicles on the road. It is also useful for the monitoring of carbon dioxide emissions of the circulating car fleet in relation to compliance with the voluntary agreements between the European Commission and the automotive industry. Since 2001, the year in which the Civil Motorization began to monitor the specific emissions of the newly registered fleet, these emissions have been decreasing and are in any case significantly lower than the estimates of real on-road emissions, showing a gap between type-approval data and real-world data.

SPREAD OF ALIEN SPECIES

Data aggiornamento scheda:
Immagine

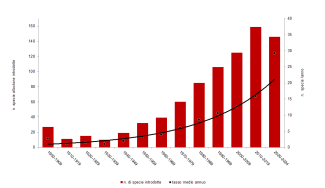
The indicator provides an overview of the current presence of alien animal and plant species in Italy through quantitative data, showing the temporal trends of introduction in Italy over the last century, the average annual introduction rate (average number of new alien species introduced each year), the  pathways (according to CBD categories), and the distribution of invasive alien species of Union concern. The number of alien species in Italy is progressively and constantly increasing. Based on currently available data, nearly 3,800 exotic species have been introduced into our country, of which 3,659 are currently present in the territory. The average number of species introduced per year has increased exponentially over time, increasing from 6 species/year in the 1970s to 16 species/year in the last decade,reaching nearly 30 species/year in the current decade. The cumulative number of species introduced in Italy since 1900 also confirms this exponential trend, with an increase of over 500% in 120 years.

SUMMER DAYS

Data aggiornamento scheda:

The indicator describes the trend in extreme heat events in Italy, specifically representing the number of days with a maximum daily air temperature exceeding 25 °C. In 2023, an increase of approximately 19 summer days was observed compared to the climatological average for the 1991–2020 reference period.

SUSTAINABLE FOREST MANAGEMENT CERTIFICATION

Data aggiornamento scheda:

In recent decades, increasing anthropogenic pressure on forest ecosystems—driven in part by the rising use of biomass for bioenergy, technical applications, and construction—has often led to the degradation of natural and semi-natural systems, especially in tropical regions. These trends are frequently associated with unsustainable and/or illegal exploitation of forest resources. The harvesting, processing, and transportation of wood and wood-based products have significant environmental, economic, and social impacts.

Over the last twenty years, political decision-makers, private companies, civil society organizations, and individual citizens have increasingly focused on the sustainable use of forest biomass. This has led to concrete actions and the implementation of effective tools aimed at preventing and mitigating such impacts. Forest certification has emerged as a key instrument to counteract the negative effects and threats to national and global forest resources by promoting practices based on careful planning and monitoring of wood biomass harvesting and management activities.

As of 31 December 2023, the forest area certified in Italy under the Programme for the Endorsement of Forest Certification (PEFC™) scheme amounted to 984,107 hectares (a 6% increase compared to 2022), while the area certified under the Forest Stewardship Council® (FSC®) scheme totalled 85,214 hectares (an increase of 4% over the previous year).

TOTAL WASTE PRODUCTION EXCLUDING MAJOR MINERAL WASTES

Data aggiornamento scheda:

The indicator evaluates the pressures on the environment and the efficiency of resources used by the economy to generate wealth, as well as its progress toward achieving a circular economy. In 2022, the ratio of national waste production to gross domestic product (GDP) was slightly above the European average (66 kg/1,000€ vs. 60 kg/1,000€). Overall, the economic system still appears unable to limit waste production in relation to the wealth produced. 

WASTE RECYCLING RATE EXCLUDING MAJOR MINERAL WASTES

Data aggiornamento scheda:

The indicator is useful for monitoring progress toward a circular economy, allowing for the identification of the quantities of materials reintroduced into the economy following waste treatment. Compared to the total amount of waste sent for recovery and disposal operations, more than three-quarters of the treated waste is recycled, placing Italy among the countries with the highest recycling rates.

BEE MORTALITY CAUSED BY THE USE OF PLANT PROTECTION PRODUCTS

Data aggiornamento scheda:

Bees, pollen, and other beekeeping matrices provide important information about the state of the environment, particularly in relation to chemical contamination from plant protection products (pesticides). Laboratory analyses can detect active substances from these products on the bees' bodies and in the pollen they collect during their flights in treated areas.

ISPRA has long been involved in research and monitoring activities aimed at identifying the possible factors and causes of honey bee colony mortality, including those related to agricultural practices involving the use of pesticides, especially in natural and agriculturally intensive areas.

The data collected suggest a fluctuating trend around an annual average of several dozen bee mortality cases, often with the detection of active pesticide ingredients on the bees or in other beekeeping matrices.

CONTRIBUTION OF NATIONAL FORESTS TO THE GLOBAL CARBON CYCLE

Data aggiornamento scheda:

The indicator refers to carbon stock, i.e., the amount of carbon stored in Italy across the different forest carbon pools, and to the variation in carbon stock (carbon sink), which accounts for both the carbon sequestered and the emissions released due to wildfires, harvesting, and natural mortality within national forest ecosystems.

Carbon stock and carbon sink are effective indicators for assessing the condition of a country’s forest resources, as they are influenced by forest productivity and, negatively, by both natural and anthropogenic disturbances (such as fires, logging, pests and pathogens, natural mortality, etc.).

Carbon stocks in Italian forests are increasing, indicating a net positive balance between greenhouse gas (GHG) emissions and removals (carbon sink). This trend is partially driven by conservation and forest protection policies and, on the other hand, by a decrease in harvested timber volumes due to complex economic and social factors.

Emissions from forest fires remain a significant concern. The trend of the national carbon sink over the period 1990–2022 has been heavily affected by a reduction in GHG removals associated with areas burned annually. The impact of biomass loss from large-scale wildfires in 1990, 1993, 2007, and 2017 is particularly evident in the carbon sink trend.

This highlights the critical role of wildfires in shaping the contribution of national forests to the global carbon cycle.

EMISSIONS OF ACIDIFYING SUBSTANCES (SOx, NOx, NH3): TRENDS AND SECTORAL DISAGGREGATION

Data aggiornamento scheda:

The indicator describes the trend of national emissions of acidifying substances SOx, NOx, and NH3, both at the total and sectoral levels, highlighting the decreasing trend from 1990 to 2022 (-72.3%). With reference to Directive 2016/2284 of the European Parliament and of the Council, concerning the reduction of national emissions of certain atmospheric pollutants, which defines the national emission reduction commitments relative to 2005, applicable from 2020 to 2029 and from 2030 onwards, sulfur oxides and ammonia have already reached the reduction target for 2020 by 2009; whereas nitrogen oxides reached it in 2014.

EMISSIONS OF AIR POLLUTANTS FROM TRANSPORT

Data aggiornamento scheda:

The indicator allows for the assessment of emissions of major air pollutants produced by the transport sector. In Italy, harmful emissions from road transport have significantly decreased in recent years thanks to the introduction of catalytic converters, particulate filters, and other vehicle-installed technologies. From 1990 to 2022, road emissions of non-methane volatile organic compounds (NMVOCs) decreased by 88.2%, nitrogen oxides (NOx) emissions by 74.8%, and fine particulate matter (PM) emissions by 75.0%. Sulfur oxides (SOx) emissions, now nearly absent from road transport, remain significant in maritime transport. The 2020 estimates reflect the effects of the pandemic, while 2021 and 2022 show a gradual recovery. Pollutant emissions into the atmosphere are monitored at the national level to verify compliance with reduction commitments imposed by European legislation, aiming to achieve air quality levels that do not cause significant negative impacts or risks to human health and the environment.

EMISSIONS OF PARTICULATE MATTER (PM10): TREND AND SECTORAL DISAGGREGATION

Data aggiornamento scheda:

The indicator represents the trend of national particulate matter (PM10) emissions by source sector from 1990 to 2022, showing a significant overall reduction over the years (-40.5%). The road transport sector, which contributes 10% to total emissions in 2022, shows a reduction of 65.6% over the entire period. Emissions from non-industrial combustion, on the other hand, have increased by approximately 37.6% during the same period, becoming the most significant sector in 2022, accounting for 45.3% of total emissions.

EMISSIONS OF TROPOSPHERIC OZONE PRECURSORS (NOX AND NMVOCs): TREND AND SECTORAL BREAKDOWN

Data aggiornamento scheda:

The indicator illustrates the national emission trends of tropospheric ozone precursors—namely nitrogen oxides (NOx) and non-methane volatile organic compounds (NMVOCs)—disaggregated by emission source sector. A significant overall decline is observed between 1990 and 2022, amounting to -71% for NOx and -58% for NMVOCs, primarily driven by substantial reductions in emissions from the transport sector.

ENERGY CONSUMPTION IN TRANSPORT

Data aggiornamento scheda:

The indicator quantifies fuel consumption in the transport sector to monitor and/or reduce and diversify it. Energy consumption in transport has shown an upward trend since the 1990s, followed by a decline starting in 2007. In 2018 and 2019, consumption rebounded, while 2020 saw a sharp reduction due to the pandemic crisis, followed by a recovery in 2021 and a further increase in 2022. Road transport and fossil fuels account for the predominant share. Several critical issues characterize the national transport system, which remains far from the ambitious 2030 and 2050 European targets for fuel consumption in the transport sector.