Simona Benedetti
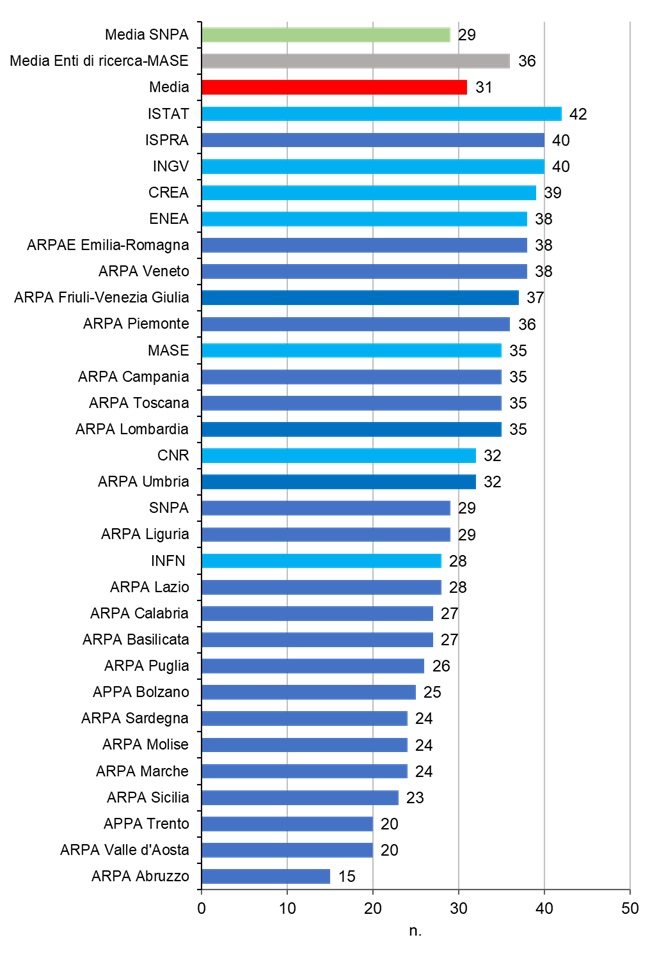
In July 2025 it is highlighted that the offer of environmental information and communication tools on the web by the monitored institutions is stable compared to 2024 both with regard to the overall average of the monitored websites (31 points compared to a maximum value of 46 points), and if we refer to the average of the SNPA websites (29 points), while the average of the sites of the research bodies and MASE goes from 37 points to 36. There are 15 sites that obtained a score higher than the overall average. The institutional site richest in web tools and content is that of Istat (42 points).
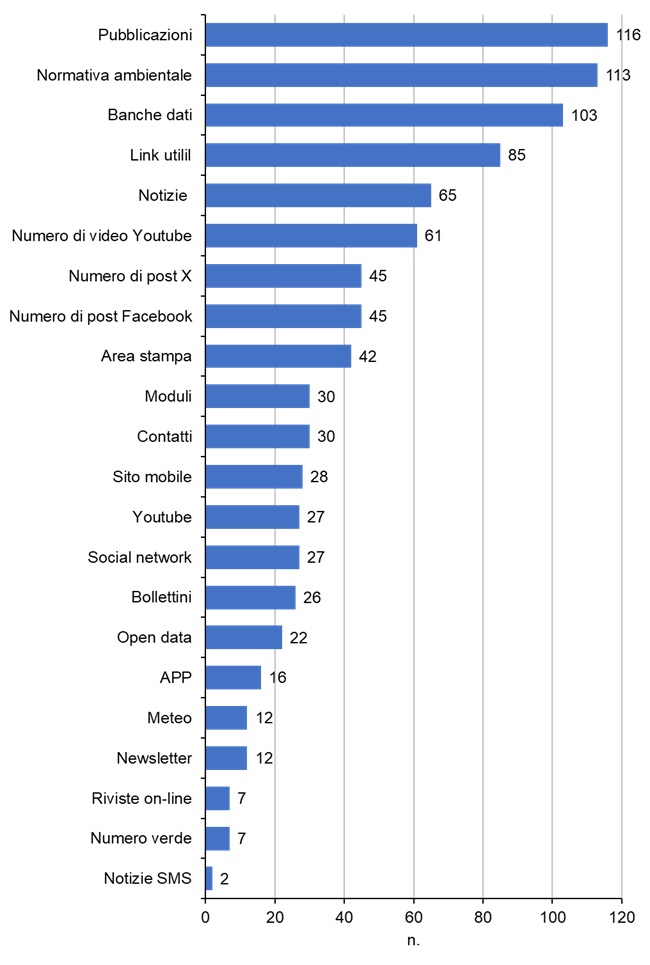
The indicator describes the response of the main institutions operating in the environmental sector to the demand for environmental information and communication. It detects the presence on the analysed websites of the following services and sections: News, Publications, Databases, Online Forms, Environmental Legislation, Useful Links, Bulletins, Social Networks, Number of X posts, Number of Facebook posts, Number of YouTube videos, Press Area, Open Data, Apps, Mobile Site, SMS News, Newsletter, Weather, Helpline, Contacts, Online Journals, Social Media (X, Facebook, Instagram, YouTube, LinkedIn).
Evaluate the offer of environmental information and communication on the web of the network of the National System for the Protection of the Environment (SNPA), of some of the main research bodies and of the MASE to increase knowledge and dissemination of information on environmental matters.
The current legislation on the subject has the objective of making environmental information accessible to the public and of committing the Public Administration (PA) to disseminate the data it has at its disposal, encouraging the involvement and active participation of citizens.
- Circular 61/2013, Provisions of the legislative decree of 18 October 2012, n. 179, converted with amendments by Law 17 December 2012, n. 221 regarding the accessibility of websites and IT services. Obligations of public administrations
- Regulation (EC) no. 1367/2006 of the European Parliament and of the Council of 6 September 2006 on the application to community institutions and bodies of the provisions of the Århus Convention on access to information, public participation in decision-making processes and access to justice in environmental matters (OJ 25.9.2006, n. L 264)
- Council Decision 2005/370/EC of 17 February 2005 on the conclusion, on behalf of the European Community, of the Convention on access to information, public participation in decision-making processes and access to justice in environmental matters (OJ 17.5.2005, n. L 124)
- Directive 2003/35/EC of the European Parliament and of the Council of 26 May 2003, which provides for public participation in the preparation of certain plans and programs relating to the environment and amends Council Directives 85/337/EEC and 96/61/EC relating to public participation and access to justice (OJ 25 June 2003, no. L 156)
- Directive 2003/4/EC of the European Parliament and of the Council of 28 January 2003 concerning public access to environmental information and repealing Council Directive 90/313/EEC (OJ 14.2.2003, n. L 41/26)
- Directive 2002/58/EC, 12 July 2002, of the European Parliament and of the Council on the processing of personal data and the protection of privacy in the electronic communications sector (Directive on privacy and electronic communications) (OJ 31 July 2002, n. L 201)
- Regulation (EC) 30 May 2001 n. 1049/2001 "Regulation of the European Parliament and of the Council relating to public access to documents of the European Parliament, of the Council and of the Commission" (OJ 31 May 2001, n. L. 145. Entered into force on 3 June 2001)
- Regulation (EC) no. 45/2001 of the European Parliament and of the Council, of 18 December 2000, concerning the protection of natural persons in relation to the processing of personal data by community institutions and bodies, as well as the free circulation of such data (OJ 12.1.2001, n. L 008)
- Aarhus Convention of 25 June 1998 on access to information, public participation in decision-making and access to justice in environmental matters
- Directive 95/46/EC of the European Parliament and of the Council of 24 October 1995 on the protection of natural persons with regard to the processing of personal data and on the free movement of such data
- Legislative decree of 14 March 2013, n. 33 "Reorganization of the regulations concerning the obligations of publicity, transparency and dissemination of information by Public Administrations"
- Legislative Decree 235/2010. New CAD, Digital Administration Code - 30 December 2010 Amendments and additions to the Digital Administration Code (Legislative Decree 82/2005)
- Resolution of 26 July 2010, Guidelines for Public Administration websites. Minister for Public Administration and Innovation
- Directive 8/09 of the Minister for Public Administration and Innovation. Reduction of public administration websites and for improving the quality of online services and information for citizens
- Legislative decree 19 August 2005, n. 195 "Implementation of Directive 2003/4/EC on public access to environmental information" (Official Journal 23 September 2005, no. 222 - Republication of the text in the Official Journal 13 October 2005, no. 239)
- Legislative decree 7 March 2005, n. 82 “Digital Administration Code” (Official Journal 16.5.2005, n. 112 – S. O. N. 93)
- Decree of the President of the Republic 1 March 2005, n. 75 "Regulation for the implementation of law 9 January 2004, n. 4, to facilitate the access of disabled people to IT tools" (Official Gazette 3 May 2005, n. 101)
- Legislative decree 28 February 2005, n. 42 "Establishment of the public connectivity system and the international network of the Public Administration, pursuant to article 10 of law 29 July 2003, n. 229" (Official Gazette 30 March 2005, n. 73)
- Law 9 January 2004, n. 4 “Provisions to promote access of disabled people to IT tools” (Official Journal 17 January 2004, n. 13)
- Law 16 March 2001, n. 108 "Ratification and execution of the Convention on access to information, public participation in decision-making processes and access to justice in environmental matters, with two annexes, made in Aarhus on 25 June 1998" (Official Journal 11 April 2001, n. 85 – S. O. N. 80)
- Law 7 June 2000, n.150 "Discipline of information and communication activities of the Public Administrations" (Official Gazette 13 June 2000, n. 136)
- Censis, U. C. S. I, 2020. 16th Censis U. C. S. I Report on communication “The media and the construction of identity”. Franco Angeli, Milan
- SNPA, Environment Report, 2018 edition
- Censis, U. C. S. I, 2013. 12th Censis U. C. S. I Report on communication "The economy of digital disintermediation". Franco Angeli, Milan
- Censis, 2013. 49th Report on the social situation of the country/2013 (Chapter Communication and media pages 407-464). Franco Angeli, Milan
- Digital Administration Code, Legislative Decree 7 March 2005, n. 82 and subsequent amendments and additions introduced by the legislative decree of 30 December 2010, n. 235
- COM(2006) 194 of 3 May 2006 “Commission Green Paper on the European Transparency Initiative” (Not published in the Official Journal)
- COM(2006) 35 of 1.2.2006 - Commission of the European Communities “White paper on a European communication policy”
- COM(2005) 229 of 1.6.2005 - Communication from the Commission to the Council, the European Parliament, the European Economic and Social Committee and the Committee of the Regions "A European information society for growth and jobs"
- COM/2002/0263 - Communication from the Commission to the Council, the European Parliament, the Economic and Social Committee and the Committee of the Regions - eEurope 2005: an information society for all - Action plan to be presented to the Seville European Council 21 and 22 June 2002
- COM (2001) 529(01) - Communication from the Commission to the Council, the European Parliament, the Economic and Social Committee and the Committee of the Regions - eEurope 2002: accessibility and content of public administration websites
- COM(2001) 428/2 of 5.8.2001 - Commission of the European Communities “White Paper on European Governance”
- COM(1999) 687 of 8 December 1999 - Communication relating to a Commission initiative at the extraordinary European Council in Lisbon on 23 and 24 March 2000: eEurope - An information society for all
- DigitPA, Formez, 2010, Guidelines for PA websites. Ernst & Young, 2016, Italia Smart – Smart City Index Report
- ISPRA, various years, Environmental data yearbook
- ISPRA, various years, Quality of the urban environment, (XI, XII, XIII Report)
- ISPRA, 2015, Environmental communication on the websites of Italian municipalities
- ISPRA, 2018, Environmental data
- ISPRA, 2018, In summary... The environment
- ISPRA, 2020, 2021, Yearbook in figures
- ISPRA, 2023, Environment in Italy: an overview
- ISPRA, 2024, Environment in Italy: an overview
- Minister for Public Administration and Innovation, 2011 Guidelines for PA websites
- SNPA, Communication and information activities of environmental agencies, September 2015
- Vademecum Open data, How to make public administration data open. Beta version
- Vademecum Public Administration and Social Media 2011
Low level of detail of the information provided.
Extension of the survey to the sites of other local/national institutions with environmental/territorial expertise.
ISPRA
Analysis of the websites of the SNPA (ISPRA-ARPA/APPA), MASE and some research bodies (CNR, CREA, ENEA, INGV, INFN, Istat).
National, regional
2020-2025 (July 31)
The main types of services and sections (22 types) relating to environmental information and communication offered by the websites of the SNPA, MASE and some of the main research bodies have been identified. The types of services and sections considered now "outdated" or present on the sites subject to the investigation due to legal obligation, such as the certified e-mail, were discarded. For some typologies the presence/absence within the site was verified, in case of presence a score of 1 was assigned, for other typologies of tools or services in addition to the presence the quantity was evaluated (e. g.: no. Of news; no. Of posts X).
- Environmental publications and documentation: a) 0 documents: 0; b) From 1 to 10 documents: 1; c) From 10 to 20 documents: 2; d) Over 20 documents: 3. In the presence of a sufficiently explanatory label, such as Documentation, Report, Publications or Attachments, 1 point is assigned on the homepage or in a thematic section of the site; therefore, the maximum score that can be attributed is 4.
- Environmental legislation: a) 0 measures: 0; b) From 1 to 10 measures: 1; d) From 10 to 20 measures: 2; f) Over 20 provisions: 3. In the presence of a sufficiently explanatory label referring to the legislation on the homepage or in a thematic section of the site, 1 point is assigned; therefore, the maximum score that can be attributed is 4.
- Environmental news (those published in the last week are considered): a) 0 news: 0; b) From 1 to 5 news: 1; c) From 5 to 10 news items: 2; d) Over 10 news items: 3. In the presence of a sufficiently explanatory label on the homepage or in a thematic section of the site, 1 point is assigned; therefore, the maximum score that can be attributed is 4.
- Useful links: a) 0 links: 0; b) from 1 to 5 links: 1; c) From 5 to 10 links: 2; d) over 10 links: 3. In the presence of a sufficiently explanatory label on the homepage or in a thematic section of the site, 1 point is assigned; therefore, the maximum score that can be attributed is 4.
- Contacts: 1.
- Databases: a) 0 databases: 0; b) From 1 to 5 databases: 1; c) From 5 to 10 databases: 2; d) More than 10 databases: 3. In the presence of a sufficiently explanatory label, such as Databases, Environmental Data or Database, 1 point is assigned on the homepage or in a thematic section of the site; therefore, the maximum score that can be attributed is 4.
- Newsletter (the last issue no earlier than 3 months from the monitoring date is considered): 1.
- Online forms (forms in various formats - pdf, word, etc. - editable on-line or off-line, referring to environmental procedures): 1.
- Weather: 1.
- Toll-free number: 1.
- Press area: a) Press review: 1; b) Press releases: 1. In the presence of a label that directs you to a section of the site dedicated to journalists, 1 point is assigned; therefore, the maximum score that can be attributed is 3.
- Youtube or other video platform: 1.
- Number of videos published on the Youtube channel in the last 6 months of monitoring: a) 0 videos: 0; b) from 1 to 5 videos:1; c) from 5 to 10 videos: 2; d) from 10 to 20 videos: 3; e) over 20 videos: 4.
- Mobile version: 1.
- Bulletins (periodic environmental data bulletins): 1.
- Social networks (Facebook, X, Instagram, LinkedIn): 1.
- Number of Facebook posts in the week preceding the monitoring date: a) 0 posts: 0; b) from 1 to 3 posts: 1; c) from 3 to 5 posts: 2; d) over 5 posts: 3.
- Number of posts X in the week preceding the monitoring date: a) 0 posts: 0; b) from 1 to 5 posts: 1; c) from 5 to 10 posts: 2; d) over 10 posts: 3.
- SMS news (service for sending news via text message or a Telegram channel): 1.
- Applications (APP): 1. Monitoring takes place on the institutional website and on Play Store 21.
- Open data: 1.
- Online magazines (the latest issue no earlier than 6 months from the monitoring date is considered): 1.
Therefore, the maximum achievable score is 46.
There are 15 websites that obtain a score equal to or higher than the overall average of 31. The institutional site richest in tools and web content is that of Istat (42 points), second place for the INGV and ISPRA websites (40 points) and third place for the CREA website (39 points). ARPA Abruzzo confirms itself at the bottom of the ranking with 15 points (Figure 1).
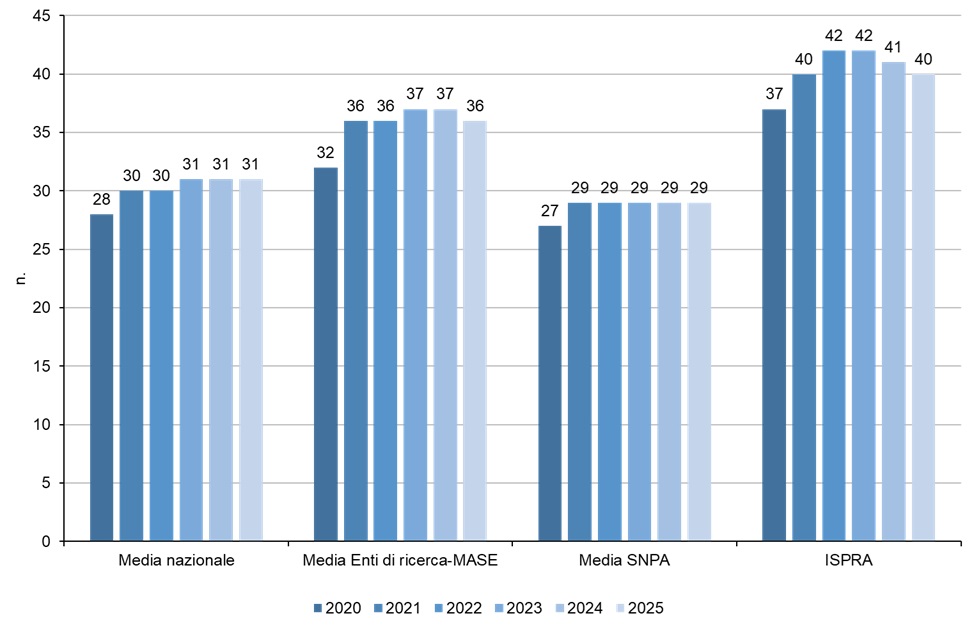
In the period 2020-2025, after an initial growth phase, the overall average of the scores obtained by the websites analyzed remained constant. The SNPA websites showed the same trend, while the MASE research institutes' websites showed a slight decline (-1 point) in the last year. From 2023 to 2025, the ISPRA website recorded a negative trend with the loss of two points (Figure 2).
| Data |
|---|
Headline
Table 1: Scores obtained by the websites analysed Data source
ISPRA |
Headline
Table 2: Provision of informational content Data source
ISPRA |
Headline
Table 3: Use of communication and information tools Data source
ISPRA |
Headline
Table 4: Social media presence on the monitored websites (comparison between Research Bodies and MASE/SNPA) Data source
ISPRA |
Headline
Table 5: Number of YouTube subscribers Data source
ISPRA |
Headline
Table 6: Number of Facebook likes Data source
ISPRA |
Headline
Table 7: Number of X followers Data source
ISPRA |
Headline
Table 8: Types of apps present on the monitored websites Data source
ISPRA |
Headline
Table 9: Number of Instagram followers Data source
ISPRA |
Thumbnail
Titolo
Figure 1: Scores obtained by the analysed websites (2025) Fonte
ISPRA |
Thumbnail
Titolo
Figure 2: Comparison of the scores obtained by the analysed websites Fonte
ISPRA |
Thumbnail
Titolo
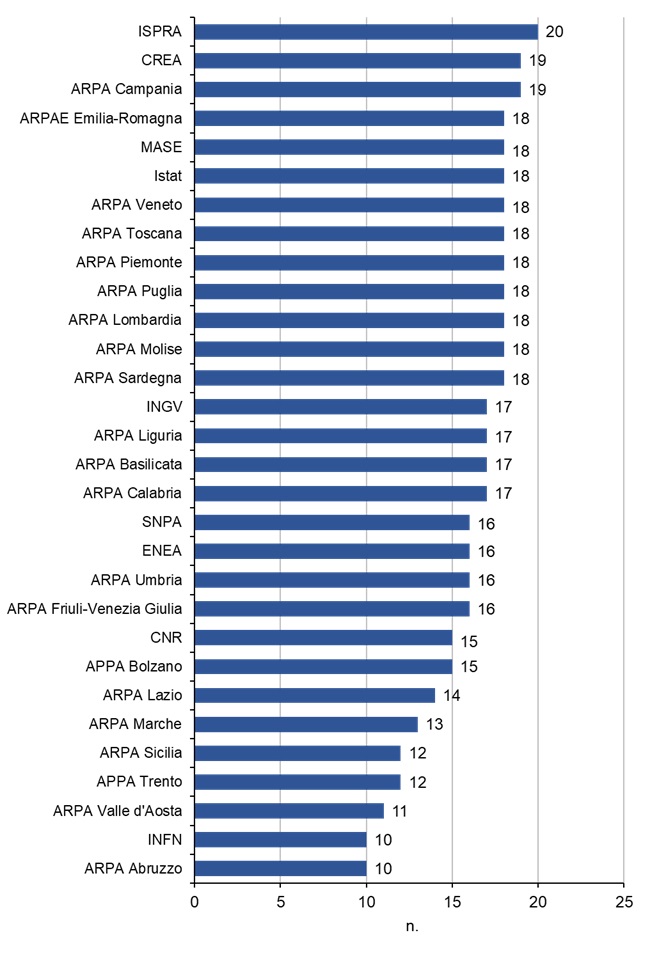
Figure 3: Informational content offering 2025.jpg Fonte
ISPRA |
Thumbnail
Titolo
Figure 4: Degree of use of communication and information tools (2025) Fonte
ISPRA |
Thumbnail
Titolo
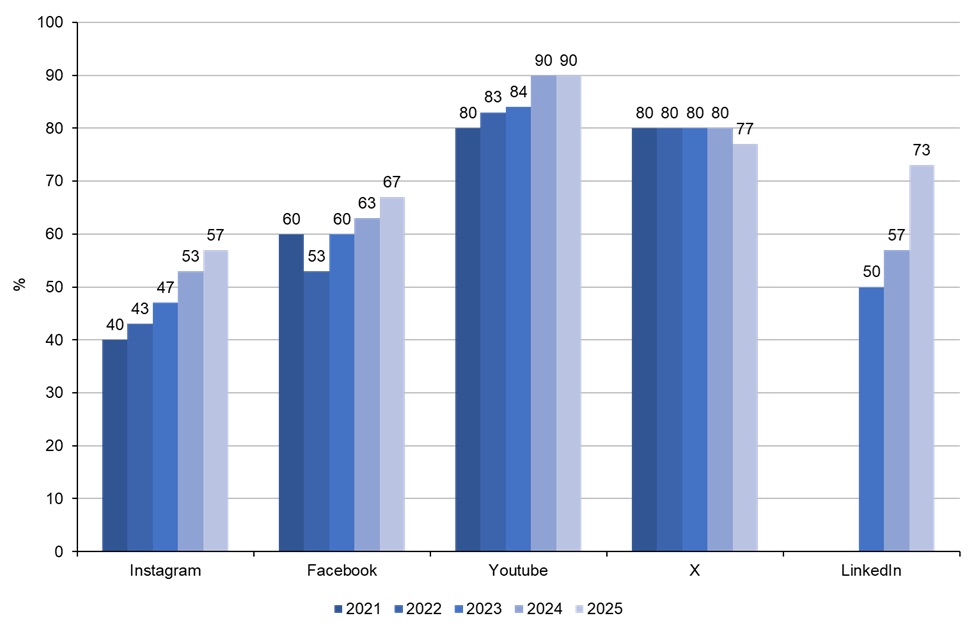
Figure 5: Percentage of social media use Fonte
ISPRA |
Thumbnail
Titolo
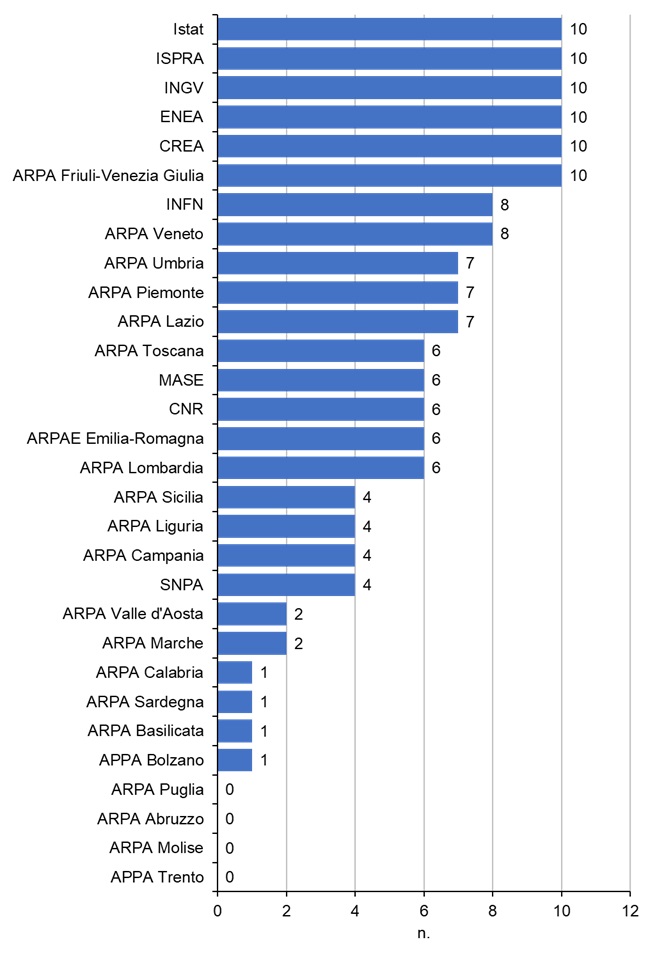
Figure 6: Degree of social media use (2025) Fonte
ISPRA |
The monitoring carried out in July 2025 highlighted a non-homogeneous situation compared to the two subgroups of institutions in the sample (Figure 1). The average score obtained from the websites of the research bodies (CNR, CREA, ENEA, INGV, INFN, Istat) and MASE (36 points) is higher than the overall average (31 points) and the average score obtained from the SNPA websites (29 points). In the calculation of the latter value, the one relating to the ISPRA website was also included which, although it is a research body, is an integral part of the SNPA. The ARPA Molise and Lombardy sites, with 4 points more than in 2024, present the best performance. We note the negative scores of the INFN sites (-6 points) and ARPA Valle d'Aosta (-5 points) (Table 1). As regards the richness of the information offer of the websites (Figure 3), expressed by the number of news, publications, useful links, standards and databases, the site with the richest content is confirmed as those of ISPRA (20 points), followed by the sites of CREA and ARPA Campania (19 points). All sites contain publications, online forms for requesting environmental services, news and at least one e-mail address to contact the organization (Figure 4). Regarding news, the data also takes into account the update, as only those published within seven days of the monitoring date are counted. Social networks are used by 27 institutions, one more than the monitoring carried out in 2024. The detail on the use of the main social media (Instagram, Facebook, Youtube and X) shows that Youtube and LinkedIn, the social network dedicated to professional relationships that allows you to create specific profiles indicating work experience, studies, awards received and publications, this year recorded a notable increase in its use by the institutions monitored with an increase of 16 percentage points. Instagram and Facebook, with +4 percentage points compared to 2024, also show a growing trend. All research institutions and MASE use Facebook, X, Instagram, Linkedin and Youtube while. As regards the SNPA, 87% of the bodies that constitute it have a YouTube channel, 70% have an X profile (-4 percentage points), 57% a Facebook profile (+5 percentage points) and 43% an Instagram profile (+4 percentage points). As regards the SNPA institutions, an increase of 17 percentage points in the presence of a Linkedin profile of the institution was monitored (Table 4). In relation to the degree of use of social media, the number of videos published on the Youtube channel in the last six months and the number of Facebook and X posts published in the week preceding the monitoring date were taken into consideration. There are six sites that obtain the maximum score (10 points), four are research bodies: Istat, INGV, ENEA and CREA; two belong to the SNPA: ISPRA and ARPA Friuli-Venezia Giulia (Figure 6). The most followed YouTube channels (Table 5) are those of INGV, ISPRA and INFN. In first place for popularity is INGV which with the main YouTube channel together with the thematic channels (environment, earthquakes and volcanoes) totals the highest number of subscribers (29,460). Among environmental agencies, ARPA Umbria remains the most followed (4,100 members). The Facebook profile with the highest number of likes is confirmed as that of INGV with almost 374,617 likes (Table 6). In addition to the main Facebook profile, the organization has active thematic profiles (earthquakes, volcanoes and environment). In second place was the MASE Facebook profile (137,295 likes) followed by the INFN (66,202 likes). Also belonging to INGV are the Facebook pages that saw the greatest increase in the number of likes in a year (+22,624), followed by INFN (over 11,400) and ARPA Sardinia with almost 5,700 more likes in 2025. Among the environmental agencies, ARPA Liguria confirms itself with the most followed Facebook profile. As regards the number of followers of This decline is attributable to several concomitant factors. On the one hand, the acquisition of the platform by Elon Musk has generated in some users the perception of a greater political orientation of the social network, contributing to the reduction of active profiles. On the other hand, X carried out an extensive operation to remove fake profiles, often generated by third-party companies for the sale of followers or by the platform itself to improve the user experience of users who purchase services to increase the visibility of their content. INGV profile X is still in first place with 342,525 followers; the data was obtained by adding the followers of the institution's four X channels, dedicated respectively to earthquakes, volcanoes, the environment and communication. MASE channel X remained stable in second place (118,986). Among the regional agencies, ARPA Piedmont's X profile is first in the followers ranking (16,369). Although it is not among the variables observed, it is noted that the use of Telegram, a free instant messaging application, which allows you to chat with your contacts also through the use of a nickname, is starting to spread among social channels; therefore, without necessarily there being exchanges of telephone numbers. There are 9 organizations that have their own Telegram channel: ARPA Campania, Friuli-Venezia Giulia, Liguria, Molise, Piedmont, Tuscany, Veneto, MASE, INGV and Istat. The APP also allows you to organize public and private groups and take advantage of various features, including channels and bots. Bots are instant and automatic chats that interact with requests entered by the user following specific and predetermined commands. Instagram, unlike X, records an increase in the number of new active profiles. The Istat Instagram profile is the most followed among those monitored and is also the one that, in 2025, presents the most significant increase in followers (Table 9). A final analysis concerns the most innovative tool: smartphone applications (Table 8). Compared to 2024, the number of APPs made available increases from 50 to 49. The most widespread types are those for controlling air quality, weather conditions, bathing and pollen.