Panel 1
Daniela Romano
The indicator describes the trend of national emissions of acidifying substances SOx, NOx, and NH3, both at the total and sectoral levels, highlighting the decreasing trend from 1990 to 2022 (-72.3%). With reference to Directive 2016/2284 of the European Parliament and of the Council, concerning the reduction of national emissions of certain atmospheric pollutants, which defines the national emission reduction commitments relative to 2005, applicable from 2020 to 2029 and from 2030 onwards, sulfur oxides and ammonia have already reached the reduction target for 2020 by 2009; whereas nitrogen oxides reached it in 2014.
The quantification of emissions is carried out through appropriate estimation processes, following the methodology outlined by the European Environment Agency (EMEP/EEA air pollutant emission inventory guidebook, 2019). Anthropogenic emissions of sulfur oxides (SOx) primarily result from the use of sulfur-containing fuels, while natural sources are mainly volcanoes. SOx are among the main agents of the atmospheric acidification process, with negative effects on ecosystems and materials. Nitrogen oxides (NOx) are linked to high-temperature combustion processes, and the main sources are transportation, heating plants, industrial combustion, agriculture, and electricity and heat production. Regarding ammonia (NH3), emissions almost entirely originate from agricultural activities (including livestock farming).
Assessing the pressures of acidifying substances and their trend over the years in light of national and international reduction targets (Legislative Decree 171/04, Göteborg Protocol, and NEC Directive).
The 1999 Gothenburg Protocol of the 1979 Convention on Long-range Transboundary Air Pollution, amended in 2012, aims to reduce acidification, eutrophication, and tropospheric ozone (the European Community acceded to the protocol through Council Decision 2003/507/EC). Directive (EU) 2015/2193 (implemented through Legislative Decree 183/2017) applies to medium combustion plants and sets standards for controlling air emissions of sulfur dioxide (SO2), nitrogen oxides (NOx), and particulates, in order to reduce air emissions and the potential risks to human health and the environment arising from such emissions. The new NEC Directive 2016/2284 of the European Parliament and the Council (implemented through Legislative Decree 81/2018), concerning the reduction of national emissions of certain air pollutants, defines national emission reduction commitments relative to 2005, applicable from 2020 to 2029 and from 2030 onwards: for SOx, the reduction commitments are 35% and 71%, respectively; for NOx, the reduction commitments are 40% and 65%, respectively; for NH3, the reduction commitments are 5% and 16%, respectively.
Panel 2
De Lauretis R., 2000. Scenari di emissioni di ossidi di zolfo e di azoto, di componenti organici volatili e di ammoniaca, in “Il processo di attuazione del Protocollo di Kyoto in Italia. Metodi, scenari e valutazione di politiche e misure”, ENEA, 2000 EMEP/EEA air pollutant emission inventory guidebook – 2019 (https://www.eea.europa.eu/publications/emep-eea-guidebook-2019)
ISPRA, 2024. Italian Emission Inventory 1990-2022. Informative Inventory Report 2024
ISPRA, De Lauretis R. et al., 2010. Trasporto su strada - Inventario nazionale delle emissioni e disaggregazione provinciale, Rapporti - N. 124 /2010.
Ministero per l’ambiente e per la tutela del territorio, 2003. Programma Nazionale per la riduzione delle emissioni annue di biossido di zolfo, ossidi di azoto, composti organici volatili ed ammoniaca, MATT, comunicazione alla CE ai sensi della Direttiva 2001/81/CE.
nessuna
nessuna
Data quality assessment
Italian Institute for Environmental Protection and Research.
http://emissioni.sina.isprambiente.it/inventario-nazionale/
National
1990 - 2022
Indicator assessment
Estimates made in the preparation of the national atmospheric emissions inventory. To evaluate the overall trend, conversion factors into acid equivalents (H+) are used. These factors are those adopted by the European Environment Agency. For atmospheric pollutants, the methodology employed is the one outlined by the European Environment Agency (EMEP/EEA Guidebook 2019). For the description of the estimation methodology, reference is made to the Informative Inventory Report – IIR (https://www.isprambiente.gov.it/it/pubblicazioni/rapporti; https://www.ceip.at/status-of-reporting-and-review-results/2024-submission/).
The emissions of the three acidifying substances in 2022 total 36.9 ktH+/a. In terms of tons, this includes 88,146 tons of sulfur oxides, 620,052 tons of nitrogen oxides, and 350,817 tons of ammonia (Tables 1 and 2, Figure 4). All three substances have met the reduction targets set for 2020.
Emissions of the three acidifying substances, expressed in acid equivalents, have decreased by a total of 72.3% from 1990 to 2022. In 2022, the distribution is as follows: sulfur oxides account for 7%, a significant reduction compared to 1990 (-95.1%); nitrogen oxides and ammonia emissions account for 37% and 56%, respectively, both decreasing (-70.8%, -33.7%) but with an increasing relative weight compared to 1990 (Table 2). With reference to the reduction commitments set by the regulations, sulfur oxides, having already decreased by 41% compared to 2005 since 2009 (Figure 1), and ammonia, with a 7% decrease compared to 2005 (Figure 3), have reached the reduction target set for 2020; while nitrogen oxides reached the 2020 reduction target in 2014, with a 41% reduction (Table 1, Figure 2).
Data
Table 1: Emissions of Acidifying Substances by Sector
ISPRA
A: Energy combustion and transformation industry
B: Non-industrial combustion
C: Industrial combustion
D: Production processes
E: Extraction, distribution of fossil fuels/geothermal
F: Use of solvents
G: Road transport
H: Other mobile sources
I: Waste treatment and disposal
L: Agriculture
M: Other (pets)
ChatGPT ha detto:
The emission values have been updated in line with the annual update of the national emissions inventory.
Table 2: Total National Emissions of Acidifying Substances in Acid Equivalent
ISPRA
The emission values have been updated in line with the annual update of the national emissions inventory. The conversion factor to acid equivalents (H+/kg) is as follows: SOx = 31.25; NOx = 21.74; NH3 = 58.82.
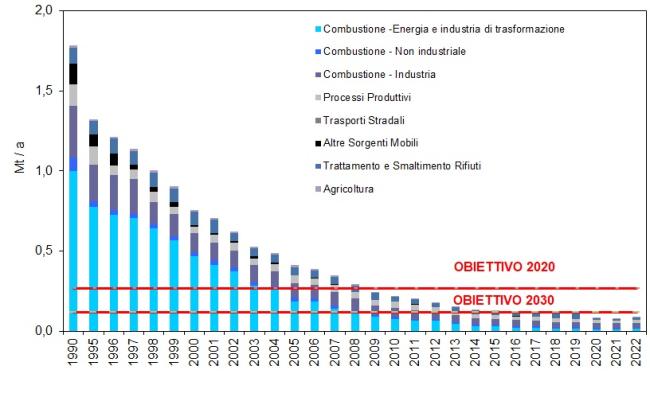
Figure 2: National Emissions of Nitrogen Oxides by Sector
ISPRA
The emission values have been updated in line with the annual update of the national emissions inventory
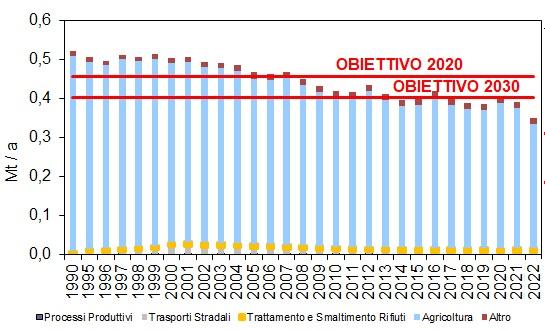
Figure 3: National Emissions of Ammonia by Sector
ISPRA
The emission values have been updated in line with the annual update of the national emissions inventory
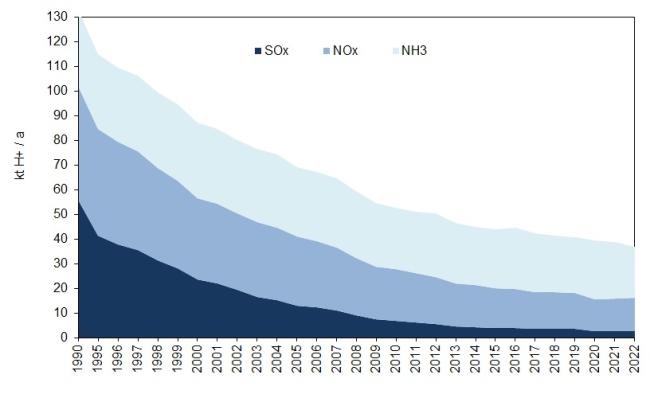
Figure 4: Total National Emissions of Acidifying Substances in Acid Equivalent
ISPRA
The emission values have been updated in line with the annual update of the national emissions inventory
National emissions are calculated in accordance with the estimation methodology adopted at the European level, as outlined in the EMEP/EEA air pollutant emission inventory guidebook 2019. To ensure consistency and comparability of the inventory, the annual update of emissions involves continuous revision of the entire historical series based on new information and the latest methodological developments. Natural source emissions (other emission sources and absorptions) are not included in the totals, in accordance with the classification adopted in the emission inventory estimation.
From the data analysis, it is observed that sulfur oxide emissions have decreased by approximately 95.1% between 1990 and 2022. This reduction is primarily due to the restrictions introduced on sulfur content in fuels, which caused a sharp decrease in emissions overall, particularly in the road transport sector, which saw a 148% drop, accounting for about 0.03% of the total emissions in 2022 (Table 1, Figure 1). From 1990 to 2022, nitrogen oxide emissions have decreased by 70.8%. The contribution of road transport emissions has remained relatively stable over the years, accounting for 40.6% in 2022, with an overall reduction of 74.8%. Emissions of NOx from modes of transport other than road transport, while decreasing by 45.2% since 1990, represent the second-largest source of emissions at the national level, contributing 23.1% of the total emissions in 2022. Non-industrial combustion, the only sector showing an increase (+21% since 1990), accounts for 12.5% of emissions, while industrial combustion and combustion in the energy production and manufacturing sectors contribute 8.4% and 6.3%, respectively, of the total emissions at the national level in 2022. The agricultural sector accounts for 7.1% of emissions and has seen a 28.6% reduction since 1990 (Table 1, Figure 2).
Ammonia emissions decreased by 33.7% from 1990 to 2022. Throughout this period, the agricultural sector has been the primary contributor to NH3 emissions, accounting for 90.4% of total emissions, thus driving the overall trend over the years (with a reduction of -36.5%). Emissions from road transport, despite showing significant growth initially, were subsequently mitigated by a decrease starting in 2001, and in 2022, they represent only 1.6% of the total emissions at the national level. Emissions from waste treatment and disposal increased by 52.7% from 1990 to 2022, but in 2022, they accounted for 3.5% of the total emissions at the national level (Table 1, Figure 3).