Antonella Bernetti, Antonio Caputo
The indicator allows the emissions of the main air pollutants produced by the transport sector to be assessed. In Italy, harmful emissions produced by road transport have decreased significantly in recent years, thanks to the introduction of catalytic converters, fine particulate filters and other technologies installed in vehicles. From 1990 to 2024, emissions from total transport of non-methane volatile organic compounds will be reduced by 87.4%, nitrogen oxide emissions by 71.6% and fine particulate matter emissions by 69.6%. Sulfur oxide emissions, now almost absent in road transport, are still significant in sea transport. Polluting emissions into the atmosphere are monitored at a national level for the purpose of verifying compliance with the reduction commitments imposed at European level, with the aim of achieving air quality levels that do not entail significant negative impacts and significant risks for human health and the environment.
The indicator considers the emissions of the main air pollutants, which are nitrogen oxides (NO x ), non-methane volatile organic compounds (NMVOC), particulate matter (PM), lead (Pb), benzene (C 6 H 6) and sulfur oxides (SO x ). Nitrogen oxides contribute to acid rain, eutrophication and the formation of tropospheric ozone, and, indirectly, to global warming and changes in the ozone layer. Particulate matter currently represents the pollutant with the greatest impact on human health, especially as regards the fine fraction (PM 2.5), which can penetrate deep into the lungs. Particulate matter is both harmful in itself as an irritant of the mucous membranes and as a "vehicle" that transports trace pollutants into the lungs and blood, which are potentially mutagenic or harmful. Secondary particulate matter is also formed in the atmosphere, to which emissions of nitrogen oxides, sulfur oxides, ammonia and volatile organic compounds contribute, and ozone, which derives from the reaction between nitrogen oxides and non-methane volatile organic compounds in the presence of heat and sunlight, therefore especially in the summer months. Benzene is a carcinogenic substance present in traces in petrol and motor vehicle exhaust fumes.
Evaluate the emissions of the main air pollutants produced by the transport sector, in order to verify the achievement of the European objectives for reducing total national emissions and the contribution of the sector to the pressure on the environment in critical areas for air quality.
On the basis of the UNECE Convention on long-range transboundary air pollution (CLRTAP), Italy is required to update and annually communicate the national inventory of polluting emissions into the atmosphere. EU Directive 2016/2284 on national emission limits defines the commitments to reduce emissions of the air pollutants SO2, NOx, NMVOC, NH3 and PM2.5 at a total level, providing that emissions relating to road transport are calculated and reported on the basis of the quantities of fuel sold in the Member States, which can also take as a reference the fuel used or the kilometers traveled in the Member State. At community level, polluting emissions from road vehicles are regulated separately according to the distinction between light vehicles (cars and light commercial vehicles) and heavy vehicles (trucks and buses). EC Regulation 715/2007 relates to the approval of motor vehicles with regard to emissions from passenger and light commercial vehicles (Euro 5 and Euro 6) and EC Regulation 595/2009 relates to the approval of motor vehicles and engines with regard to emissions from heavy-duty vehicles (Euro VI). For light vehicles, Euro 5 and 6 standards were adopted in 2007, mandatory from January 2011 and September 2015 respectively with regard to the homologation and registration of new types of vehicles; in particular, the Euro 6 standard reduces nitrogen oxide emissions per km from diesel cars. Since September 2017, the standardized driving cycle used in vehicle homologation tests is the WLTP (Worldwide Harmonized Light vehicles Test Procedure), supported by the RDE (Real Driving Emissions) test. From 2018 to 2021, the versions of the Euro 6 anti-pollution legislation have been modified several times; these are different and increasingly severe approval procedures with the introduction of more stringent tests foreseen with the WLTP and RDE cycles. These regulations constitute an evolution regarding the more stringent limits imposed on the values of polluting emissions produced by vehicles and are divided into different phases: Euro 6A mandatory for vehicles registered from January 2016, Euro 6B which differs from 6A for particulate emissions, which are even lower, Euro 6C mandatory for all new cars sold from September 2018 and for those approved from September 2017, Euro 6 Temp mandatory for all new cars sold from September 2019 and those approved from September 2018 and Euro 6D mandatory for all registrations from January 2021 and approvals from January 2020. The most recent measures regarding polluting emissions derive from Regulation (EU) 2017/1151 which integrates Regulation (EC) no. 715/2007 of the European Parliament and of the Council relating to the type-approval of motor vehicles with regard to emissions from passenger and light commercial vehicles (Euro 5 and Euro 6) and Regulation (EU) 2018/858 which establishes a new framework regulation on type-approval by amending Regulations (EC) no. 715/2007 and (EC) n. 595/2009 on heavy vehicle emissions (Euro VI). Further directives regulate emissions from "off-road" vehicles (railways and inland waterways). Emissions from ships and airplanes are regulated internationally (IMO and ICAO) and more restrictive regulations are possible in certain areas. From 1 January 2020, the new IMO (International Maritime Organization) regulation came into force regarding ship fuel, which imposes a maximum sulfur content of 0.5%, compared to the previous limit of 3.5%. The limit is less rigorous than that imposed in SECA areas (Sulfur Emission Control Areas), equal to 0.1% since 2015. The community regulatory framework has undergone a profound evolution with the adoption of Regulation (EU) 2024/1257, known as Euro 7, which unifies the regulations for light and heavy vehicles in a single text, overcoming the historical distinction between Euro 6 and Euro VI. The new standard introduces stringent constraints on tests in real driving conditions (RDE) and, for the first time, imposes limits on non-exhaust emissions, such as particulate matter resulting from brake and tire wear. With a view to industrial flexibility, the European Union has also reshaped the long-term decarbonisation targets, converting the previous total stop of internal combustion engines by 2035 into a 90% reduction in emissions target for car manufacturers, thus paving the way for the use of e-fuels and biofuels. Finally, in the maritime sector, from 1 May 2025 the Mediterranean Sea officially became a SECA area (Med-SECA), extending the obligation of the maximum sulfur limit of 0.10% in naval fuels to Italian waters as well.
EMEP/EEA air pollutant emission inventory guidebook 2019, EEA Report No 13/2019 (https://www. eea. europa. eu/publications/emep-eea-guidebook-2019)
ISPRA, Italian Emission Inventory 1990 – 2024, Informative Inventory Report 2026, Higher Institute for Environmental Protection and Research, ISPRA, Reports 426/26, https://www. isprambiente. gov. it/it/pubblicazioni/rapporti/italian-emission-inventory-1990-2024-informative-inventory-report-2026
Estimates of emissions calculated with reference to an average national level, when reported on a local scale, may not exactly reproduce the situation found in the area; in particular, with reference to the spatialization methodology adopted for road transport, the effects of the greater diffusion, in northern Italy, of new vehicles compliant with the most up-to-date anti-pollution regulations are neglected.
-
ISPRA (Higher Institute for Environmental Protection and Research)
ISPRA: https://emissioni. sina. isprambiente. it/inventory-national/
National
1990 - 2024
The estimate of emissions of pollutants deriving from transport is developed on the basis of the methodology reported in the EMEP/EEA air pollutant emission inventory guidebook, a technical guide adopted at European level for the purposes of drawing up national emission inventories communicated within the framework of the UNECE Convention on long-range transboundary air pollution (CLRTAP) and within the scope of the EU NEC Directive. The estimates are processed using appropriate emission factors and applying sophisticated algorithms which in turn require the availability of numerous information, such as for example in road transport: the number of vehicles, the estimate of the average annual distances and speeds, the specifications relating to the technology, the fuels used and the driving methods in detail of the type of vehicle, engine capacity or weight class, Euro standard and type of fuel used (for the estimate of emissions from road transport the estimation model promoted at European level COPERT is applied).
In 2024, the state of the indicator highlights a total volume of benzene emissions equal to 1123.28 tonnes, a residual level compared to the past but not zero. Within this scenario, the main share is still represented by cars, which contribute with 452.04 tonnes, equivalent to 40.3% of the sectoral total. The second emission source is made up of mopeds and motorcycles with 254.65 tons, equal to 22.7%. Maritime activities and evaporative emissions from petrol engines show almost identical values, standing at 183.26 tonnes (16.3%) and 183.04 tonnes (16.3%) respectively. The other sectors weigh marginally, such as light vehicles under three and a half tons with 16.19 tons (1.4%) and airports in the take-off and landing phases with 15.06 tons (1.3%).
The state is given a poor rating, given the recovery in emissions seen, following the pandemic crisis, in most cases since 2021 and fundamentally due to the critical issues that still characterize the transport sector from an emission point of view, due to the still considerable weight that transport has compared to the total emitted at national level for many pollutants, due to the preponderance of the road mode, due to the discrepancies that still exist between the emission values resulting from the approval and the values actually emitted on the road, due to the uncertainty associated with the estimates.
The emissions estimation methodology has been updated over the years; in particular, the emission contribution of road traffic has been updated several times on the basis of the results obtained from road tests of the vehicles. In most cases, from 2021 there will be a recovery in emissions, compared to 2020 in which the contraction found, more marked for passenger transport than goods, is fundamentally attributable to the pandemic crisis.
Observing the data reported in Tables 1 to 6 for each of the main pollutants, we note that:
• the most significant decrease in emissions of a pollutant was recorded for lead emissions which went from 3,877t in 1990 to 39.8t in 2024, obtaining a 99% reduction thanks to the exclusion from the market, since 2002, of petrol with tetraethyl lead in road transport (Table 6). In 2024, lead emissions increased by 3% compared to the previous year. The analysis of lead emissions by vehicle type highlights how the main source is currently tire and brake wear (97.1%);
• benzene emissions decreased by 96.6%, going from 32,843t in 1990 to 1,123t in 2024, thanks to the reduction in the percentage contained in petrol and catalytic converters (Table 1); the current overall emissions of this substance with recognized carcinogenic properties are however still significant and are mainly due to the circulation of motor vehicles without catalytic converters or with very old ones, two-wheeled vehicles and maritime activities. In 2024, benzene emissions increased by 3.4% compared to 2024. The analysis of benzene emissions by source highlights how the largest share comes from cars (40.2%); mopeds and motorcycles contribute 22.7% to the total issued and maritime activities 16.3%;
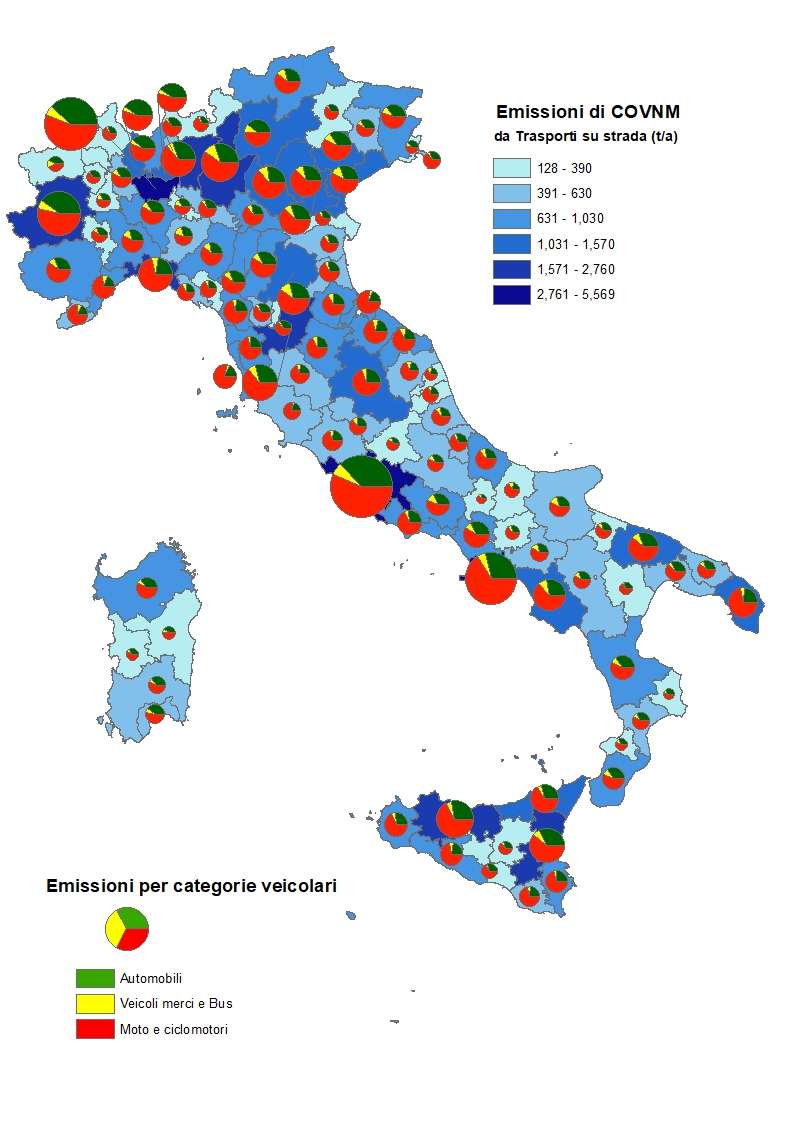
• emissions of non-methane volatile organic compounds (Table 5 and Figure 1) decreased by 87.4% from 1990 to 2024 (from 818kt to 103kt); in 2024 a decrease of 2.1% is estimated compared to the previous year (Table 5). The analysis of emissions of volatile organic compounds by vehicle type highlights how the main contributions derive from evaporative emissions from petrol engines for 49.1%, from mopeds and motorcycles for 23.8%, from cars for 11.7%, and from maritime activities for 11.2% (Table 5);
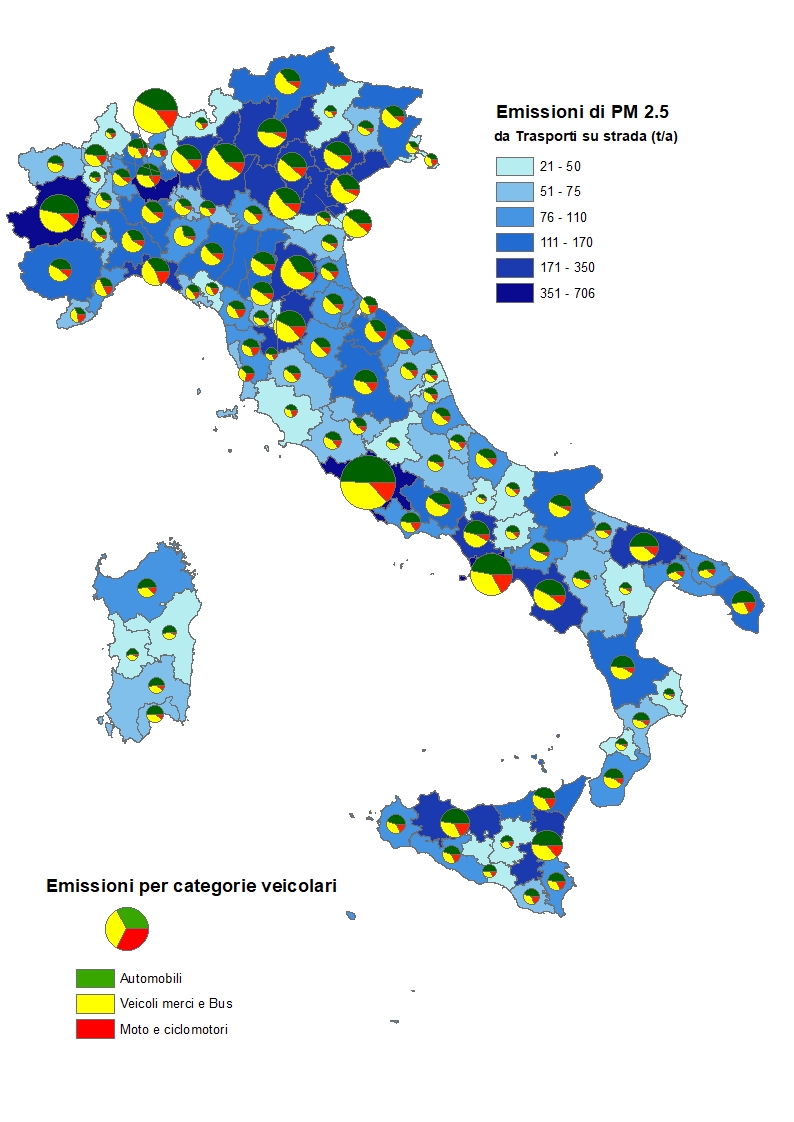
• PM2.5 fine particulate emissions (Table 2 and Figure 3) decreased by 69.6% from 65,477t in 1990 to 19,926t in 2024 (in the last year the increase was 3.5%). In 2024, the largest contributions of PM2.5 come from tyres, brakes and road surfaces (41.1%), maritime activities (35.9%) and cars (8.3%) (Table 2); overall, transport contributes 16.2% (19.9 kt) to the national total of primary PM2.5 in 2024 which is equal to 122.7 kt.
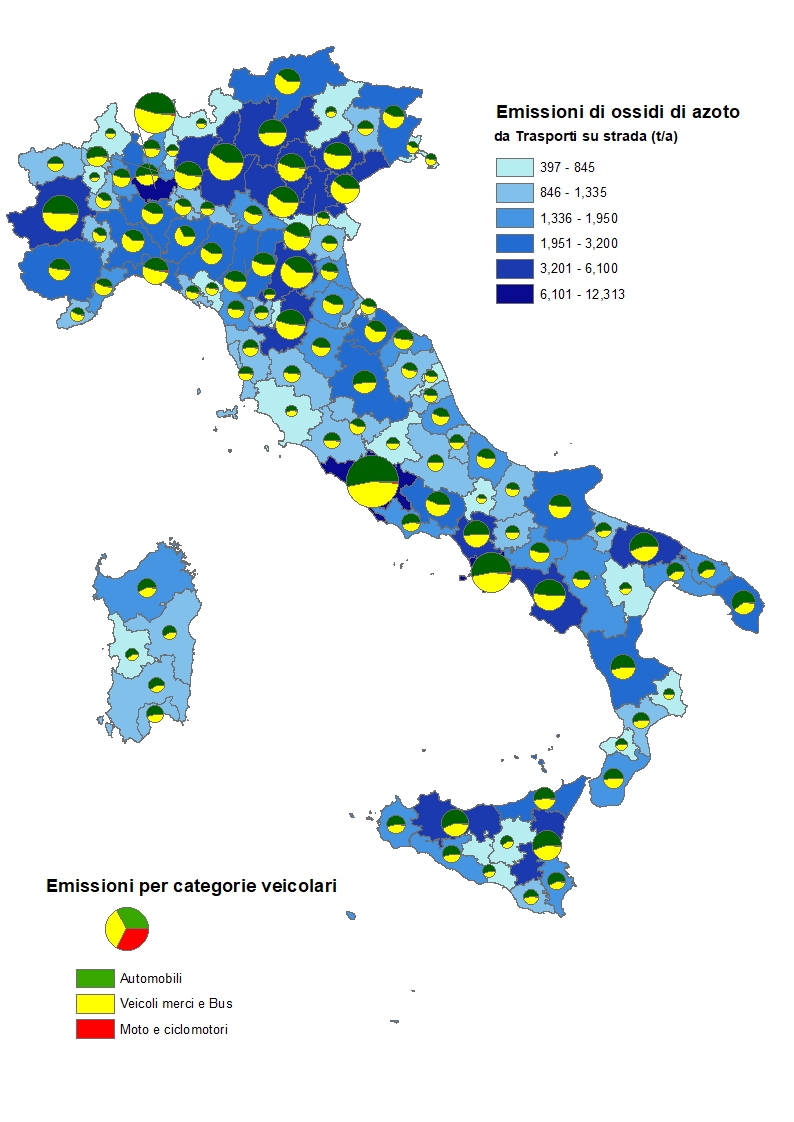
• in 2024 nitrogen oxide emissions from the transport sector (Table 4 and Figure 2) have decreased by 71.6% since 1990 (from 1,124kt to 319kt). From 2023 to 2024 emissions will decrease by 0.2%. In 2024 emissions mainly derive from cars (32.1%), maritime activities (29.1%) and heavy vehicles P > 3.5 t and buses (22%). Transport provides the largest contribution (equal to 319kt) to total national emissions of nitrogen oxides equal to 536.8kt (59.4% in 2024);
• emissions of sulfur oxides have decreased over the years thanks to the reduction in the sulfur content of fuels. In the period considered, emissions from transport (Table 3) decreased by 95.3% (going from 211kt to 9.9kt), but grew by 9.0% in the last year. The main source is maritime activities which contribute 88.8% to the total emissions from transport in 2024. The transport sector provides a contribution equal to 14.1% (9.9kt) to the total emission of sulfur oxides at a national level (equal to 70.1kt).
As regards the division of emissions between freight and passenger transport (Table 7), the data is not unique and must be examined for each of the main pollutants. In 2024 it is observed that for nitrogen oxides the contribution of passenger traffic is approximately 38.4%, goods traffic with 60.4% is the main emission source. Passenger traffic was the main source until 1999, but since 2000 freight traffic has taken over due to the slower renewal of the fleet and the less incisiveness of the specific emissions reductions prescribed by the regulations. For NMVOCs, passenger traffic remains the main source (85.2% in 2024) due, above all, to cars and motorcycles and mopeds (Table 5); freight transport contributes in 2024 with a share equal to 14% of the total emitted by transport. Finally, for PM2.5, freight traffic contributes 57.6% to total emissions in 2024. From 2013 to 2017 there was a slight reduction in the contribution of freight traffic, attributable both to the spread of diesel cars which increased the contribution of passenger transport, and to the significant reduction in emissions of this pollutant by Euro IV and subsequent freight vehicles. From 2018 to 2020 the percentage contribution of freight transport increases, while in the last two years lower percentage contributions are estimated. The new Euro 6 (passenger) and VI (freight) regulations further reduce overall emissions from diesel vehicles, for both freight and passenger transport.
| Allegati |
|---|
Headline
Tabella 2: Emissioni di PM2,5 dal settore dei trasporti, per modalità di trasporto Data source
ISPRA |
Headline
Tabella 3: Emissioni di ossidi di zolfo dal settore dei trasporti, per modalità di trasporto Data source
ISPRA |
Headline
Tabella 4: Emissioni di ossidi di azoto dal settore dei trasporti, per modalità di trasporto Data source
ISPRA |
Headline
Tabella 5: Emissioni di composti organici volatili non metanici (COVNM) dal settore dei trasporti, per modalità di trasporto Data source
ISPRA |
Headline
Tabella 6: Emissioni di piombo dal settore dei trasporti, per modalità di trasporto Data source
ISPRA |
Headline
Tabella 7: Ripartizione percentuale delle emissioni di alcuni inquinanti per tipo di traffico Data source
ISPRA |
Thumbnail
Headline
Figura 1: Emissioni COVNM da trasporti in Italia Data source
ISPRA |
Thumbnail
Headline
Figura 2: Emissioni di ossidi di azoto da trasporto su strada in Italia Data source
ISPRA |
Thumbnail
Headline
Figura 3: Emissioni da PM2,5 da trasporti su strada in Italia Data source
ISPRA |
The reasons for this impressive generalized reduction lie in the introduction of increasingly restrictive European standards on vehicle emissions (the stages of the Euro regulations) and in the obligation to install exhaust gas after-treatment devices such as catalytic converters. At the same time, a crucial role was played by reforms on the quality of fuels which imposed the progressive elimination of lead and the simultaneous drastic reduction of the percentage of benzene and aromatic hydrocarbons allowed in the formulation of commercial petrol. The decrease in evaporative emissions is instead associated with the improvement of tank insulation systems and petrol vapor recovery systems both on board vehicles and at refueling stations. On the contrary, the increase observed in airport activities is explained by the massive and constant expansion of commercial air traffic and passenger flights over the last thirty years, whose growing volumes of activity have exceeded the benefits deriving from the progressive technological efficiency of aeronautical turbines.