Antonella Bernetti, Francesca Palomba
The indicator quantifies fuel consumption in the transport sector, with the aim of reducing and/or diversifying it. Energy consumption in the transport sector has shown a rising trend since the 1990s, followed by a decline starting in 2007. A recovery in consumption was observed in 2018 and 2019, while the sharp reduction in 2020 is attributable to the COVID-19 pandemic. This was followed by a rebound in 2021 and a further increase in 2022 and 2023.
Energy consumption—particularly of fossil fuels—is closely linked to greenhouse gas emissions and the security of energy supply. The indicator considers national-level energy consumption in the transport sector, including its relationship to GDP. Consumption data are broken down by transport mode, fuel type, and traffic type (passenger/freight).
To quantify fuel consumption in the transport sector, with the aim of containing and/or diversifying it.
The objectives established at the EU level aim to achieve sustainable energy use in the transport sector, reduce greenhouse gas emissions, and decouple economic growth from transport demand in order to mitigate environmental impacts (EU Council, 2006). Given the high cost of fuels and the need to reduce strategic dependency on these resources, it is essential to optimize the potential of each mode of transport.
Fuels used for road transport in the EU must meet stringent quality standards to protect human health and the environment and to ensure that vehicles can travel safely across member states. Common EU-wide fuel quality standards contribute to reducing greenhouse gas and air pollutant emissions and support the establishment of a single fuel market, ensuring vehicle operability throughout the EU based on fuel compatibility.
Directive 2009/30/EC on fuel quality requires a minimum 6% reduction by 2020 in greenhouse gas emissions per unit of energy from transport fuels. Along with Directive 2009/28/EC on renewable energy, it also governs the sustainability of biofuels. Directive 2009/28/EC requires each Member State to ensure that the share of energy from renewable sources in all forms of transport reaches at least 10% of final energy consumption in the transport sector by 2020.
Directive 2009/28/EC was later replaced by Directive (EU) 2018/2001 (RED II), which establishes that each Member State must set an obligation for fuel suppliers to ensure that, by 2030, the share of energy from renewable sources accounts for at least 14% of final energy consumption in the road and rail transport sectors.
CO₂ emissions targets—relevant as CO₂ emissions are directly linked to fuel consumption—must also be considered. The White Paper on Transport sets the objective of halving the use of conventionally-fueled cars in urban transport by 2030 and phasing them out by 2050, along with achieving CO₂-free urban logistics in major cities by 2030. Regarding aviation, it aims for a 40% share of low-carbon sustainable fuels by 2050. For maritime transport, it sets a target to reduce CO₂ emissions from bunker fuels by 40% (and, where feasible, by 50%) by 2050 across the EU.
Regarding CO₂ emissions reductions from vehicles, the targets for cars (Regulation EC 443/2009, target year 2015) and for vans (Regulation EU 510/2011, target year 2017) were already achieved in 2013. On 17 April 2019, the European Parliament and Council adopted Regulation (EU) 2019/631, setting new CO₂ emission standards for cars and vans, applicable from 1 January 2020. Regulation (EU) 2019/1242, establishing CO₂ emission standards for heavy-duty vehicles, entered into force on 14 August 2019.
The 2030 Climate and Energy Framework includes EU-wide policy targets for the period 2021–2030. Its key 2030 targets are:
-
At least a 40% reduction in greenhouse gas emissions compared to 1990 levels;
-
A minimum 32% share for renewable energy;
-
At least a 32.5% improvement in energy efficiency.
The framework was adopted by the European Council in October 2014. The targets for renewable energy and energy efficiency were later increased by Directive (EU) 2018/2001, which sets a binding overall framework for the promotion of energy from renewable sources. Member States are required to collectively ensure that the share of renewable energy in the EU’s gross final energy consumption reaches at least 32% by 2030, by setting national contributions as part of their Integrated National Energy and Climate Plans, in accordance with Regulation (EU) 2018/1999.
The European Green Deal sets, among other 2050 targets to achieve climate neutrality, a 90% reduction in greenhouse gas emissions from transport compared to 1990, increased production and uptake of sustainable alternative fuels in the transport sector, and enhancement of multimodality—particularly by shifting more freight transport to rail and inland waterways.
The European Climate Law (Regulation (EU) 2021/1119 of 30 June 2021) transforms the political commitment of the European Green Deal for EU climate neutrality by 2050 into a legally binding obligation and sets the 2030 emissions reduction target at 55%. The so-called Fit for 55 package is the legislative proposal set designed to achieve this –55% net GHG emissions reduction by 2030, supporting the ecological transition outlined in the Green Deal and defining the necessary trajectory to climate neutrality by 2050.
For the transport sector, the 2030 target assigned to Italy under the 2023 Integrated National Energy and Climate Plan (NECP), regarding the share of final energy consumption covered by renewable energy sources (RES), is set at 30.7%. The updated target submitted to the European Commission in July 2024, calculated according to the methodology laid out in Directive (EU) 2023/2413 (RED III), is 34.2%.
European Commission
(a) Communication from the Commission to the European Parliament, the Council, the European Economic and Social Committee and the Committee of the Regions — A Roadmap for moving to a competitive low carbon economy in 2050, COM(2011) 112 final, 8 March 2011.
(b) White Paper — Roadmap to a Single European Transport Area: Towards a competitive and resource efficient transport system, COM(2011) 144 final, 28 March 2011.
(c) Energy Roadmap 2050, COM(2011) 885/2.
(d) White Paper on the Future of Europe — Reflections and scenarios for the EU27 by 2025, COM(2017) 2025, 1 March 2017.
(e) The European Green Deal, COM(2019) 640 final.
(f) REPowerEU, Communication adopted on 18 May 2022, aimed at ending dependence on Russian fossil fuels by enhancing energy savings, renewable sources, and diversification of supply.
(g) Fit for 55 Package, 2022–2023 legislative proposals including AFIR infrastructure and targets of 40–42.5% renewable energy by 2030.
Agencies and Other Institutions
-
EEA – European Environment Agency: Monitoring CO₂ emissions from passenger cars, various years.
https://www.eea.europa.eu/data-and-maps/data/co2-cars-emission-20 -
EUROSTAT Database, European Commission, various years.
https://ec.europa.eu/eurostat/data/database -
GSE – Gestore dei Servizi Energetici: Monitoring of renewable energy sources in the transport sector, updated report 2023–2024.
https://www.gse.it/dati-e-scenari/monitoraggio-fer/monitoraggio-nazionale/settore-trasporti -
Innovhub – Stazione Sperimentale Combustibili: Reports on the physicochemical characterization of fossil fuels used in Italy, various years.
-
IPCC – Intergovernmental Panel on Climate Change: 2006 IPCC Guidelines for National Greenhouse Gas Inventories, 2006.
ISPRA – Italian Institute for Environmental Protection and Research
-
National Emissions Inventory, 2025.
https://emissioni.sina.isprambiente.it/inventario-nazionale/ -
Italian Greenhouse Gas Inventory 1990–2023 — National Inventory Report 2025, Report 411/2025.
-
Annual report on the quality of automotive fuels produced, imported and marketed, various years.
https://www.isprambiente.gov.it/it/pubblicazioni/documenti-tecnici/relazione-annuale-sulla-qualita-dei-combustibili-per-autotrazione-prodotti-importati-e-commercializzati-nell-anno-2023
ISTAT – Italian National Institute of Statistics
-
Gross Domestic Product at market prices, various years.
http://dati.istat.it/
MASE – Ministry of the Environment and Energy Security
MIMIT – Ministry of Enterprises and Made in Italy
-
Integrated National Energy and Climate Plan (NECP) – Revised version of 1 July 2024.
https://www.mase.gov.it/portale/documents/d/guest/pniec_2024_revfin_01072024-errata-corrige-pulito-pdf -
National Energy Balance, various years.
https://dgsaie.mise.gov.it/ben.php -
Fuel Saving and CO₂ Emissions Guide, various years.
https://www.mise.gov.it/index.php/it/mercato-e-consumatori/qualita-di-prodotti-e-servizi/auto-ed-emissioni-co2 -
Italy’s National Renewable Energy Action Plan, 2010.
-
-
EUROSTAT (Ufficio Statistico delle Comunità Europee) GSE Spa (Gestore dei Servizi Energetici ) ISPRA ISTAT MSE (Ministero dello sviluppo economico)
The data are derived from official statistics and administrative records, including sources such as Eurostat, GSE, ISPRA, and ISTAT, as well as fiscal documentation such as the National Energy Balance (MASE, MIMIT).
Data sources and references:
-
Eurostat Database:
https://ec.europa.eu/eurostat/data/database -
GSE – Monitoring of renewable energy sources in the transport sector:
https://www.gse.it/dati-e-scenari/monitoraggio-fer/monitoraggio-nazionale/settore-trasporti -
ISPRA – National Emissions Inventory:
https://emissioni.sina.isprambiente.it/inventario-nazionale/ -
ISTAT – National Statistical Database:
http://dati.istat.it/ -
MASE – National Energy Balance portal (DGSAIE):
https://sisen.mase.gov.it/dgsaie/
National
1990 - 2023
National energy consumption data presented here are primarily derived from the National Energy Balance (MASE, MIMIT, various years). Electricity consumption data have been updated based on the Eurostat historical series. The consumption data have been processed and updated in accordance with the reference classification of the IPCC methodology, as adopted for the compilation of the National Greenhouse Gas Emissions Inventory submitted under the UNFCCC (United Nations Framework Convention on Climate Change).
The reported data cover road transport, aviation and maritime transport, and rail transport. The category "other liquid fuels" refers to estimates of lubricating oil combusted on-road in two-stroke engines. For natural gas, data are disaggregated to distinguish between on-road consumption and pipeline transport, the latter estimated according to the methodology set out in the IPCC Guidelines.
Off-road vehicles and machinery used in the residential, agricultural, industrial, and public administration sectors are not included.
With regard to aviation and maritime fuels, a distinction is made between domestic and international uses using a methodology that estimates the consumption of national air and maritime carriers. International consumption is derived by subtracting estimated domestic consumption from the total figures reported in the National Energy Balance.
At present, the performance is assessed as poor, due to several critical issues, including the predominance of fossil fuel use in total energy consumption and the overwhelming reliance on road transport.
In 2023, in Italy, the share of total energy consumption in the transport sector covered by renewable energy sources—calculated according to the methodology set out in Directive (EU) 2018/2001 (RED II)—stood at 10.3%, showing a slight increase compared to 2022 (10.0%). The target for 2030 assigned to Italy in the Integrated National Energy and Climate Plan (NECP), submitted to the European Commission in July 2024 and calculated using the methodology established by Directive (EU) 2023/2413 (RED III), is set at 34.2%.
According to national transport sector energy consumption data (Table 1), in 2023:
-
Petrol accounted for 22.2% of total consumption,
-
Diesel for 58.8%,
-
LPG and road natural gas for 4.5% and 1.2% respectively,
-
Biofuels for 4.2%,
-
Electricity for 2.0%,
-
Fuels used in domestic aviation and navigation represented 2.1% and 3.9%, respectively.
Road transport remains the dominant mode over time (Table 2), consistently accounting for more than 90% of total energy consumption in the sector.
From 1990 to 2023, the trend in energy consumption in the transport sector has been influenced by multiple factors. Overall, the assessment is negative, particularly in light of the ambitious 2030 and 2050 targets for transport fuel consumption at the European level. Consumption increased until 2006, followed by a decline starting in 2007. A recovery was observed in 2018 and 2019, while the sharp drop in 2020 is attributable to the COVID-19 crisis. This was followed by a rebound in 2021 and further increases in the subsequent years.
Over time, petrol consumption has declined, while diesel consumption has increased and now represents the largest share of total fuel use. The consumption of lower environmental impact fuels has grown, but their contribution remains marginal. Electricity use in transport has shown significant growth compared to 1990, although its share of total consumption is still limited (Table 1).
The overall consumption trend in transport is strongly driven by road transport, which constitutes the dominant mode. Despite the gradual reduction in unit consumption per vehicle model, total energy consumption in road transport increased from 1990 to 2023. Gains in vehicle energy efficiency (see also the indicator Specific CO₂ Emissions) have not offset the effects of rising transport demand, modal shifts toward road and air transport, and increases in average vehicle engine power and displacement.
From 2007 onward, technological improvements in vehicles were accompanied by a reduction in passenger and freight movements, primarily due to the economic crisis. This decline continued in 2009 and 2010 and was particularly significant between 2011 and 2013, especially due to a sharp drop in freight traffic.
Increases in energy consumption were recorded in:
-
2014, due to a rise in passenger movements;
-
2018, driven by freight transport growth (see also the Passenger and Freight Traffic indicator);
-
2019, with a modest further increase;
-
2021, following a post-pandemic recovery;
-
2022, marking a continued upward trend in overall transport sector energy consumption over the last decade (Figure 1).
In 2020, compared to 2019, a sharp contraction of approximately −18% occurred, as a result of mobility restriction measures related to the pandemic. In 2021, the rebound was roughly of the same magnitude, followed by further increases in the following years.
In particular, national aviation fuels experienced the steepest decline between 2019 and 2020 (around −50%) and the strongest growth from 2021 to 2022 (approximately +72.4%).
Total energy consumption in 2023 is estimated to have increased by 1.1% compared to the previous year, while over the full period from 1990 to 2023, total transport sector consumption increased by 13.4% (Table 1).
| Data |
|---|
Headline
Table 1: Total energy consumption in the transport sector (final uses) Data source
Processed by ISPRA based on data from MASE, MIMIT, and Eurostat. Note
The historical series of national consumption data has been estimated for the preparation of the national emissions inventory reported under the UNFCCC framework, based on data from the National Energy Balance (MASE, MIMIT, various years). Electricity consumption data have been updated based on the Eurostat historical series. Consumption data, mainly derived from the National Energy Balance, have been processed consistently with the classification framework of the IPCC methodology adopted for estimating greenhouse gas emissions. The historical series has been recalculated in line with the update of the national emissions inventory. The consumption of other liquid fuels refers to lubricating oil burned on-road in two-stroke engines. For natural gas, details are provided not only for on-road consumption but also for pipeline transport, estimated according to the methodology set out in the IPCC Guidelines. The table does not include consumption from off-road vehicles and other machinery used in residential, agricultural, industrial sectors, or public administration.
|
Headline
Table 2: Indicators of energy consumption in transport relative to GDP and broken down by different transport modes Data source
Processed by ISPRA based on data from ISTAT and Eurostat. Note
In this table, the indicators are compiled and updated based on Eurostat energy consumption data and, therefore, differ from those used for the other indicators in this chapter. ISTAT data on Gross Domestic Product are available starting from 1995; for the earlier years, 1990–1994, the source is ISPRA's own processing based on ISTAT data. |
Thumbnail
Headline
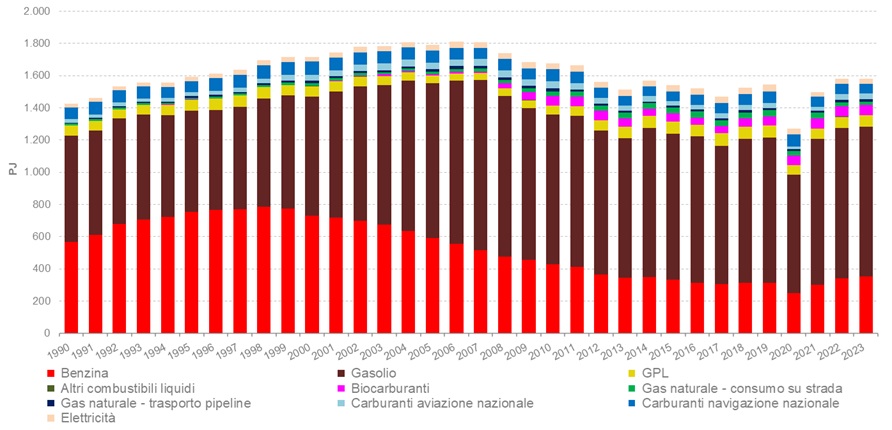
Figure 1: Energy Consumption in the Transport Sector – Final Uses (PJ) Data source
Processed by ISPRA based on data from MASE, MIMIT, and Eurostat. Note
The historical series of national energy consumption data has been estimated for the purpose of compiling the national greenhouse gas emissions inventory submitted under the UNFCCC framework, based on data from the National Energy Balance (MASE, MIMIT, various years). Electricity consumption data have been updated using the Eurostat historical series. The energy consumption data, primarily derived from the National Energy Balance, have been processed to ensure consistency with the reference classification adopted in the IPCC methodology for estimating greenhouse gas emissions. The historical series has been recalculated accordingly, in line with the update of the national emissions inventory. The consumption of other liquid fuels refers to lubricating oil combusted on-road in two-stroke engines. For natural gas, detailed data are provided for both on-road consumption and pipeline transport, the latter estimated according to the methodology outlined in the IPCC Guidelines. The table does not include consumption from off-road vehicles and other machinery used in the residential, agricultural, industrial sectors, or in public administration. |
Between 1990 and 2023, the trend in energy consumption in the transport sector largely reflects the pattern observed in road transport, which accounts for the largest share of energy consumption compared to other modes. The fuels used are predominantly of fossil origin. Aviation is the sector showing the most pronounced dynamics, both in terms of growth during the period 1990–2019, the contraction due to the pandemic, and the subsequent recovery (Table 1).
Regarding fossil fuels, diesel overtook petrol as the most used fuel for cars in 2007. Diesel is also the predominant fuel for commercial vehicles.
Referring to Figure 1, the transport sector shows an overall decrease in energy consumption starting from 2007, after a period of growth from 1990. This decline is mainly attributable to the economic crisis as well as technological improvements in vehicles. During the last decade, slight increases were observed in 2014, 2018, and 2019. The pandemic effect is clearly visible in 2020, followed by a recovery in 2021 and further increases in 2022 and 2023, returning consumption to pre-pandemic levels.
Table 2 highlights a marked decrease, especially after 2005, in energy consumption per unit of GDP for the transport sector. A detailed analysis of the two series shows that the trends in transport energy consumption and GDP can be divided into several phases. Specifically, energy consumption in transport exhibited more pronounced fluctuations than GDP, with growth until 2007, a decline during the periods 2007–2019 and 2019–2020, a subsequent recovery from 2020 to 2021, and further increases up to 2023.