Panel 1
Antonio Caputo, Giulia Iorio, Francesca Palomba
The analysis of the contribution of different primary energy sources to gross inland energy consumption shows that the dominant role of petroleum products is declining, while natural gas (37.9% of the total in 2022) and renewable sources (19.0% of the total in 2022) are increasing. Greater diversification and the growing role of renewables have a positive impact on Italy’s energy self-sufficiency level, which remains among the lowest in industrialized countries.
The indicator measures energy production from each of the primary energy sources.
To assess the contribution of different primary energy sources to energy production, with the aim of increasing the use of less polluting fuels.
With Decision No. 1386/2013/EU, the European Union established the 7th General Environment Action Programme (7th EAP), valid until 2020. On 14 October 2020, the European Commission proposed a decision to adopt the 8th Environment Action Programme (8th EAP), covering the period 2021–2030. Subsequently, on 29 March 2022, the Council of the EU formally adopted the 8th EAP (2021–2030).
Panel 2
MASE (Ministry of Environment and Energy Security), National Energy Balance (NEB), various years, https://sisen.mase.gov.it/dgsaie/
Data quality assessment
MASE (Ministry of Environment and Energy Security)
EUROSTAT
MASE (Ministry of Environment and Energy Security), National Energy Balance (NEB), various years, https://sisen.mase.gov.it/dgsaie/
National
1990-2022
Indicator assessment
The data are collected by the Ministry of Environment and Energy Security and processed according to the Eurostat methodology.
In 2022, total energy consumption amounted to 148.1 Mtoe, of which 56.1 Mtoe was natural gas, 51.5 Mtoe petroleum, and 28.2 Mtoe renewable energy.
Smaller contributions came from solid fuels (7.4 Mtoe), non-renewable waste (1.2 Mtoe), and imported electricity (3.7 Mtoe) (Table 1).
Energy consumption in 2022 showed a decrease compared to the previous year (–3.9%).
An analysis by energy source reveals the following year-on-year changes from 2021:
solid fuels: +33.8%, petroleum: +1.1%, natural gas: –10.1%, renewable sources: –7.0%, non-renewable waste: +0.3%, electricity: +0.5%.
The share of natural gas in total energy consumption increased from 26.3% in 1990 to 41.2% in 2020, then decreased slightly to 37.9% in 2022.
The share of petroleum products declined from 57.3% in 1990 to 31.7% in 2020, followed by a rebound in subsequent years (34.8% in 2022).
A similar trend is observed for solid fuels, whose share decreased steadily from 9.6% in 2012 to 3.6% in 2021, then rose to 5.0% in 2022.
The share of renewable energy sources grew rapidly from 4.4% in 1990 to 20.7% in 2020, followed by a slowdown in recent years (19.6% in 2021 and 19.0% in 2022).
Although non-renewable waste remains a minor component among the country’s primary energy sources, its share increased from 0.1% in 1990 to 0.8% in 2022.
The share of imported electricity has fluctuated around an average of 2.2% (Table 1).
Data
Table 1: Gross inland Energy Consumption by Primary Sources*
MASE/EUROSTAT
*Gross inland energy consumption is defined as primary production + recovered products + imports + stock changes – exports – international marine bunkers;
**Net imports of electricity.
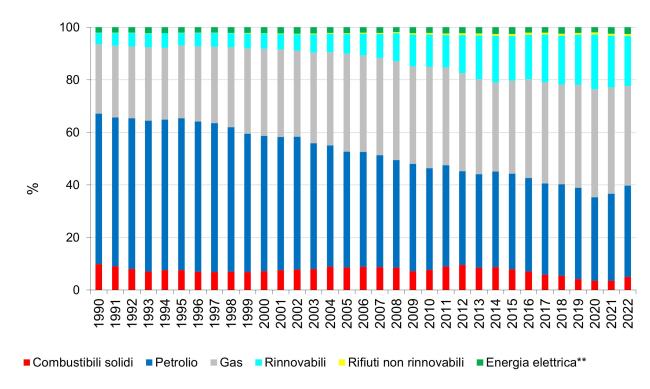
Figura1: Quota del consumo interno lordo di energia* per fonti primarie
Elaborazioni ISPRA su dati del MASE/EUROSTAT
*Consumo interno lordo di energia definito da produzione primaria + prodotti recuperati + importazioni + variazioni delle scorte - esportazioni - bunkeraggi internazionali marini; ** Import netto di energia elettrica
Italy's energy supply structure is evolving toward greater diversification of energy sources.
The predominant role of petroleum products is decreasing, in favor of an increasing share of natural gas and renewable energy sources (Figure 1).
This diversification and the growing contribution of renewables have a positive impact on Italy’s energy self-sufficiency, which remains among the lowest in industrialized countries.