Un’attenta valutazione dei progressi verso la lotta ai cambiamenti climatici è fondamentale per capire come le diverse componenti di questa politica si sviluppano nel tempo e se il cambiamento va nella direzione desiderata. L’analisi di indicatori riguardanti lo stato del clima e la sua evoluzione costituisce la base informativa indispensabile per la valutazione della vulnerabilità e degli impatti dei cambiamenti climatici.
Sono presenti gli indicatori ISPRA che maggiormente possono contribuire a descrivere o a monitorare, parzialmente o integralmente le varie componenti dei vari aspetti dei cambiamenti climatici.
AIR TEMPERATURE
Data aggiornamento scheda:
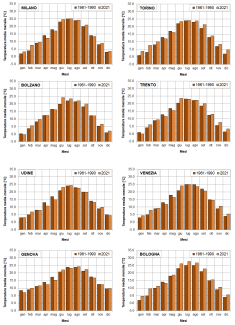
The indicator provides a representation of the trend of the average monthly temperatures recorded in the provincial capital city / region during 2021, compared with that of the average monthly temperatures calculated for the same locations over the thirty-year period 1961-1990. During 2021 there was a general increase in average monthly temperatures compared to the reference period, with exceedances of the reference values on average for 8 months and in particular in the summer and winter months. It is mainly the cities of the North where the temperature increases assume significant values in species in the months of February and December. It should be noted that in the months of April and October the temperature values, in most of the capitals, were on average lower than in the reference period.
AVERAGE SPECIFIC FUEL CONSUMPTION IN ELECTRICITY GENERATION FROM FOSSIL SOURCES
Data aggiornamento scheda:
The indicator measures the primary energy, expressed in MJ, required to produce one kWh of electricity, or more precisely, it reflects the efficiency of converting primary energy from fossil fuel sources into electricity for final consumption. Available data highlight a reduction in specific energy consumption related to electricity production of 18.4% for gross production and 20% for net production between 1996 and 2022. The long-term trend of the indicator therefore shows an improvement in the electricity generation efficiency of the thermoelectric power plants.
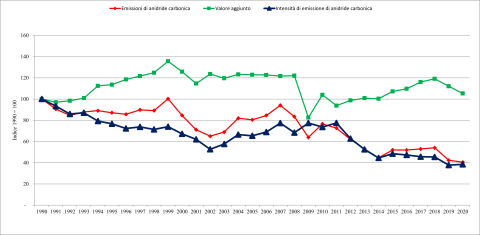
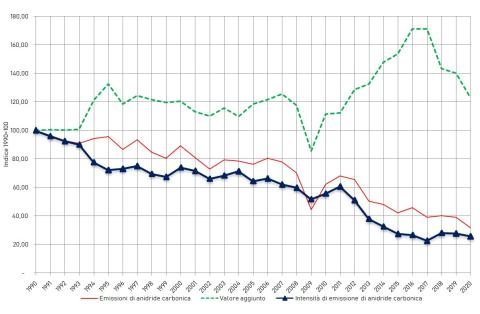
CARBON DIOXIDE EMISSION INTENSITY IN INDUSTRY RELATIVE TO VALUE ADDED
Data aggiornamento scheda:
The efficiency indicator, calculated for the years from 1990 to 2020, represents carbon dioxide emissions per unit of value added in the manufacturing and construction sectors in Italy. The substantial reduction in emission intensity over the years (-48% between 1990 and 2020) indicates an improvement in the level of efficiency achieved by the Italian manufacturing and construction industry.
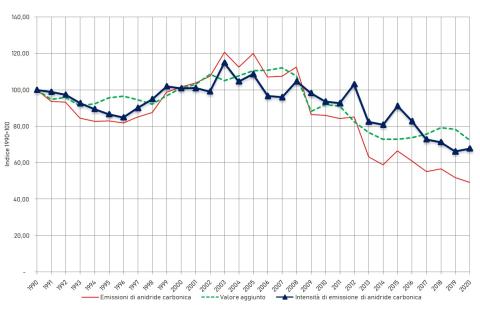
CARBON DIOXIDE EMISSION INTENSITY IN THE CHEMICAL INDUSTRY
Data aggiornamento scheda:
The carbon dioxide (CO₂) emission intensity related to energy use in the Italian chemical industry is analysed in relation to the sector's value added. In 2020, the indicator increased by 1.7% compared to 2019, although it decreased by 61.5% relative to 1990. The data, covering the period 1990–2020, are reported annually to the European Commission as part of the greenhouse gas emission monitoring mechanism and in implementation of the Kyoto Protocol.
CARBON DIOXIDE EMISSION INTENSITY IN THE NON-METALLIC MINERAL PROCESSING INDUSTRY
Data aggiornamento scheda:
The carbon dioxide (CO₂) emission intensity related to energy use in the non-metallic mineral processing industry in Italy is presented here, analyzed with reference both to the sector’s value added and to cement production. CO₂ emissions from energy processes in this industry decreased in absolute terms by 50.8% from 1990 to 2020. Over the same period, emission intensity per million euros of value added fell by 27.5%. These indicators, developed for the 1990–2020 period, are reported annually to the European Commission as part of the EU’s greenhouse gas emissions monitoring mechanism and for the implementation of the Kyoto Protocol during commitment periods.
CARBON DIOXIDE EMISSION INTENSITY IN THE PAPER INDUSTRY
Data aggiornamento scheda:
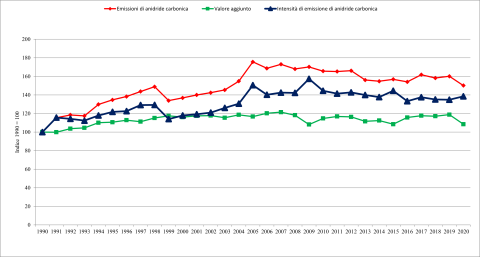
This section presents the carbon dioxide (CO₂) emission intensity related to energy use in the paper and printing industry in Italy, analyzed both in relation to value added and to production volume. In 2020, compared to the previous year, emission intensity per unit of production decreased by 2.2%, while intensity per unit of value added increased by 2.7%. In terms of long-term trends since 1990, the indicator—calculated both by value added and production—shows a general increase. This indicator, covering the period 1990–2020, is reported annually to the European Commission as part of the EU greenhouse gas emissions monitoring mechanism and the implementation of the Kyoto Protocol.
CARBON DIOXIDE EMISSION INTENSITY IN THE STEEL INDUSTRY
Data aggiornamento scheda:
This section presents the carbon dioxide emission intensity in the steel industry in Italy, analyzed with respect to both the sector's value added and steel production. Over the period from 1990 to 2020, a decrease of 74.3% in value added and 60.4% in steel production is recorded. These indicators, developed for the period 1990-2020, are communicated annually to the European Commission as part of the Community's greenhouse gas monitoring mechanism and for the implementation of the Kyoto Protocol during the commitment periods. CO2 emissions from the steel industry decreased by 68.3% from 1990 to 2020. In 2020, emissions decreased by 18.55% compared to the previous year.
CLIMATE CHANGE ADAPTATION STRATEGIES AND PLANS
Data aggiornamento scheda:
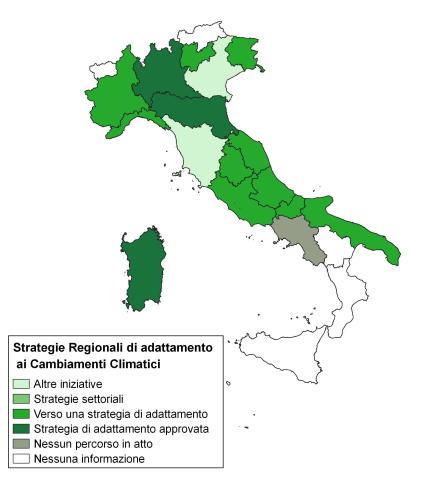
Regional Climate Change Adaptation Strategies and Plans are the primary tools available to regional authorities to address the impacts of climate change and implement actions aimed at reducing territorial vulnerabilities. In Italy, the number of adopted regional strategies and plans remains very limited. Despite the absence of a binding regulatory framework and a national programmatic reference context, there are ongoing initiatives, projects, and climate vulnerability studies that are expected to lead toward the formal adoption of first Adaptation Strategies and subsequently Climate Change Adaptation Plans. The challenge posed by climate change urgently requires the definition and implementation of concrete actions to enhance territorial resilience.
CUMULATIVE PRECIPITATION
Data aggiornamento scheda:
The indicator describes the amount and distribution of total precipitation in Italy. In 2023, the annual cumulative precipitation in Italy was approximately 4% lower than the average value calculated over the 1991–2020 reference period.
ELECTRICITY CONSUMPTION IN THE TOURISM SECTOR
Data aggiornamento scheda:
The indicator illustrates electricity consumption in the tourism sector, identified by the ATECO category "Accommodation and Food Service Activities". In 2023, this sector accounted for 4.2% of total electricity consumption in Italy. When considering only accommodation activities—such as hotels, campsites, and other short-term lodging facilities—this share drops to 1.5%. In 2023, within the "accommodation" subcategory, 83.8% of electricity consumption was attributable to "hotels and similar establishments".
ELECTRICITY PRODUCTION FROM COGENERATION PLANTS
Data aggiornamento scheda:
In 2022, the contribution of cogeneration plants to total electricity production amounted to 37.1%, while the share of cogeneration in gross thermoelectric generation reached 53.1%.
ENERGY DEPENDENCY
Data aggiornamento scheda:
The indicator illustrates the national economy’s dependence on imports of various energy sources to meet its energy requirements. A reduction in the share of oil and an increase in the share of renewable energy sources contribute to a decrease in national energy dependency. Since 2007, a downward trend has been observed, with energy dependency falling from a peak of 85.5% in 2006 to a low of 75.1% in 2020. In 2021, the dependency rate rose to 76.9%, and continued to increase in 2022, reaching 78.7%.
ENERGY FLOWS AND DOMESTIC ENERGY FOOTPRINT
Data aggiornamento scheda:
An economic system operates through energy inputs. The total energy consumption of resident units indicates the amount of energy used by economic activities and households for production and consumption activities, distinguishing energy uses from non-energy uses.
In 2021, the total energy consumption in Italy amounted to 7.05 exajoules, a 17.1% reduction compared to 2008. The total consumption is almost entirely for energy uses. In 2021, over two-thirds of the total energy use is attributable to productive activities. Among these, the top six activities for energy use (slightly more than half of total use) contribute to nearly 7% of Italy's Gross Domestic Product. 31% of the total energy use is due to household consumption (mainly heating/cooling and transport).
ISPRA also estimates the internal energy footprint, which allows the analysis of energy uses from the perspective of final domestic demand, highlighting the direct and indirect energy amounts embedded in the goods and services offered on the domestic market by Italian production chains.
EXTENT OF FOREST FIRES
Data aggiornamento scheda:
The phenomenon of forest fires analyzed based on data collected from 1970 to 2023 by the State Forestry Corps, now CUFA (Carabinieri Forestry, Environmental and Agri-food Unit Command), shows a fluctuating trend, with peak years (1993, 2007, 2017, 2021) alternating with years of decline (2013, 2014, 2018). The presence of fires within Protected Areas is high, with exceptionally large burned areas recorded in certain years, such as 2021 and 2022, when 26,507 hectares and 11,101 hectares were affected by fire, respectively.
The incidence of intentional fires is very high, accounting for approximately half of all recorded events and exceeding 60% in some years (2012, 2014, 2015, 2016, 2020).
FINAL AND TOTAL ENERGY CONSUMPTION BY SECTOR
Data aggiornamento scheda:
The indicator measures the energy consumed by end users and the total energy consumed by the country. Since 1990, there has been a general upward trend in the energy available for final consumption, reaching a peak in 2005. This was followed by a reversal, with consumption declining to a minimum in 2014. From then until 2018, a recovery in final consumption was observed, followed by a decrease in 2019 and a sharp drop in 2020 due to the lockdown of economic activities aimed at containing the spread of the SARS-CoV-2 pandemic. Consumption then rebounded in 2021, before declining again in 2022. In 2022, the energy available for final consumption—calculated according to the methodology adopted by Eurostat—amounted to 112.0 Mtoe, a 6.9% decrease compared to 2021.
FINAL ELECTRICITY CONSUMPTION BY SECTOR
Data aggiornamento scheda:
Final electricity consumption grew steadily from 1990 to 2008, then declined due to the economic crisis. From 2015, consumption resumed growth until stabilizing in 2017. Following the SARS-CoV-2 pandemic, 2020 consumption dropped by 5.7% compared to the previous year, with a rebound of 6.2% in 2021. In 2022, consumption decreased by 1.8% compared to 2021, settling at 24.7 Mtep (million tonnes of oil equivalent). The industrial sector's share of consumption fell from 51.7% in 1990 to 38.9% in 2022, while the civil sector (residential and tertiary) increased from 43.2% to 55.6%. The agriculture and fisheries sector remained nearly constant at around 2%, and the transport sector, despite fluctuations, stayed stable at 3.1%.
FLOOD EVENTS
Data aggiornamento scheda:
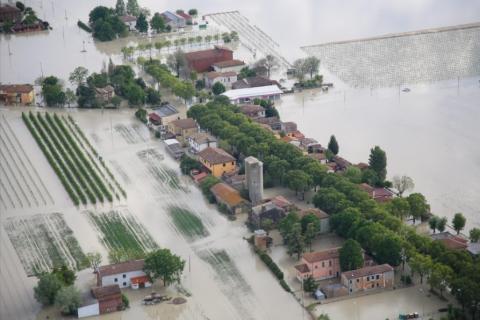
In 2023, Italy experienced one of the hottest years in the last 150 years, second only to 2022. The average and maximum temperatures reached new records with October recording temperatures more than 3°C higher than the 1991-2021 average, marking the highest value since 1961. During the summer, intense heatwaves affected the country, with record temperatures of 48.2°C recorded on July 24 in Jerzu and Lotzorai in Sardinia, and 41.2°C in Rome in early August. Drought continued to be a significant problem, with Northern and Central Italy experiencing severe drought conditions in the first four months of the year, which later eased. However, in the last three months of the year, Sicily and parts of Ionian Calabria suffered from extreme drought with a significant precipitation deficit.
Extreme weather events affected several regions, causing severe damage. In May, Emilia-Romagna was devastated by two exceptional rainfall events, leading to flooding, landslides, and 17 fatalities. On November 2, heavy thunderstorms in Tuscany caused flooding and 8 deaths, with exceptional rainfall recorded in the provinces of Pisa, Livorno, Pistoia, and Prato.
In summary, 2023 was characterized by record temperatures, persistent drought, and extreme weather events that had a significant impact on various italian regions.
FLOWS
Data aggiornamento scheda:
The indicator provides an assessment of the trend of water volumes measured in bedside sections of some of the main Italian watercourses compared to the year and the previous decade. For 2021 it was possible to represent the data of scope for 6 sections of closure of as many waterways of national importance (Po, Arno, Adige, Bacchiglione, Serchio and Tiber). In 2021, the annual volumes drained in the measurement sections showed significant increases compared to 2020, with increases of between 6% and 25%, with the exception of the sections on the Adige and the Po.
FREIGHT TRANSPORT DEMAND AND INTENSITY
Data aggiornamento scheda:
The indicator evaluates the demand for freight transport (also in relation to economic growth) and the evolution over time of modal split. The transport demand is increasingly met by road freight transport, which continues to dominate other transport modes in terms of growth and modal share (approximately 62% in 2023).
FROST DAYS
Data aggiornamento scheda:
This indicator describes trends in cold extremes across Italy, specifically quantifying the number of frost days, defined as days with daily minimum air temperature less than or equal to 0°C. In 2023, a reduction of approximately 10 frost days was observed compared to the 1991–2020 climatological baseline.
GLACIER MASS BALANCE
Data aggiornamento scheda:
The indicator is calculated for a limited sample of Alpine glaciers and represents the algebraic sum of ice mass gained through snowfall accumulation and mass lost through melting during the ablation period. Glacier mass balance data provide a fundamental measure for assessing the "health status" of glaciers.
Analysis of data from 1995 to 2023 shows that, for the glaciers considered collectively, the cumulative mass balance exhibits significant losses, ranging from nearly 25 meters water equivalent for the Basòdino glacier to over 50 meters water equivalent for the Caresèr glacier, corresponding to an average annual mass loss exceeding one meter water equivalent.
GREENHOUSE GAS EMISSION INTENSITY FROM ENERGY CONSUMPTION
Data aggiornamento scheda:
The indicator is based on the ratio between atmospheric greenhouse gas emissions and final energy consumption by sector. The average value of emission intensities shows a difference between sectors related to the varying adoption of renewable sources. Overall, the emission intensity for final uses has decreased by 25.1% from 1990 to 2022.
GREENHOUSE GAS EMISSIONS (CO2, CH4, N2O, HFCS, PFCS, SF6): PER CAPITA AND GDP
Data aggiornamento scheda:
The indicator represents, over the period 1990-2022, the trend of greenhouse gas emissions in Italy per capita and relative to GDP. A decrease is observed for both, accentuated by the growth of the population and GDP, which highlights a decoupling between drivers and pressures.
GREENHOUSE GAS EMISSIONS (CO2, CH4, N2O, HFCs, PFCs, SF6): SECTORAL BREAKDOWN
Data aggiornamento scheda:
The indicator represents the historical series of national greenhouse gas emissions from 1990 to 2022, broken down by sector. The data analysis shows a significant reduction in emissions in 2022 compared to 1990 (-21%), which can be explained by the economic recession that has slowed consumption in recent years, as well as by an increased use of renewable energy, leading to a reduction in CO2 emissions from the energy sector (-20% compared to 1990).
GREENHOUSE GAS EMISSIONS (CO2, CH4, N2O, HFCS, PFCS, SF6): TREND AND PROJECTIONS
Data aggiornamento scheda:
The indicator represents projections of national greenhouse gas emissions up to 2040, based on the current policies scenario as of 31/12/2022, including those implemented under the National Recovery and Resilience Plan (NRRP), as well as the additional policies and measures scenario defined in the Integrated National Energy and Climate Plan (INECP). The scenarios are calculated starting from the most recent consolidated historical data for 2022, and reflect the expected evolution of key macroeconomic drivers as reported to the European Commission. The projected reductions in total greenhouse gas emissions (including LULUCF) by 2030, compared to 1990 levels, are estimated at -38% under the current policies scenario and -49% under the additional measures scenario.
GREENHOUSE GAS EMISSIONS FROM AGRICULTURE
Data aggiornamento scheda:
The indicator describes greenhouse gas (GHG) emissions (CH₄, N₂O, CO₂) released into the atmosphere by the agricultural sector, mainly due to livestock management and fertilizer use. It allows for the assessment of the sector’s contribution to total national emissions and the achievement of emission reduction targets.
Since 1990, greenhouse gas emissions from the agricultural sector have shown a decreasing trend; however, further mitigation measures will be necessary to meet the targets established under the United Nations Framework Convention on Climate Change (UNFCCC), the Kyoto Protocol, and relevant European directives.
Specifically, Italy’s target for 2030 under the Effort Sharing Regulation (Regulation (EU) 2023/857) is a -43.7% reduction in total GHG emissions from agriculture, buildings, transport, waste, and industrial installations not covered by the EU Emissions Trading System (EU-ETS), compared to 2005 levels.
In 2022, GHG emissions from agriculture accounted for a relatively small share (11.2%) of total emissions from sectors covered by the Effort Sharing Regulation, while emissions from agriculture decreased by 12.2% compared to 2005.
GREENHOUSE GAS EMISSIONS FROM ENERGY PROCESSES BY ECONOMIC SECTOR
Data aggiornamento scheda:
The indicator evaluates the trend of greenhouse gas emissions from energy processes across different sectors, with the aim of reducing the impact of energy use on climate change. Greenhouse gas emissions from energy processes between 1990 and 2022 decreased by 20.7%, with varying trends across sectors. Emissions from the residential sector decreased by 7.5% compared to 1990, while emissions from transport increased by 6.7%. Over the same period, emissions from the energy industries sector decreased by 34.2%, and emissions from manufacturing industries showed a reduction of 40.6%. In 2021 and 2022, the end of the pandemic and the economic recovery led to an increase in greenhouse gas emissions from energy processes compared to 2020.
GREENHOUSE GAS EMISSIONS FROM TRANSPORT
Data aggiornamento scheda:
The indicator assesses greenhouse gas emissions from the transport sector in order to verify the achievement of national and international targets. In 2023, transport accounted for 28.3% of total greenhouse gas emissions in Italy.
Between 1990 and 2019, emissions from the transport sector (excluding international transport/bunkers) increased by 4.0%. In 2020, a significant decrease was observed (-18.6% compared to 2019), primarily due to mobility restrictions related to the COVID-19 pandemic. Subsequently, between 2020 and 2021, emissions rose by 18.9%. In 2023, a return to pre-pandemic levels was confirmed.
Overall, transport sector emissions increased by 6.7% from 1990 to 2023. The national transport system continues to face various critical issues and remains far from meeting the ambitious 2030 and 2050 European targets for greenhouse gas emission reductions.
GREENHOUSE GAS EMISSIONS IN ETS AND ESD SECTORS
Data aggiornamento scheda:
The indicator includes the emission allowances generated by installations covered by the EU Emissions Trading System (EU ETS), established under Directive 2003/87/EC, and the greenhouse gas emissions from all sectors not included in the ETS scope—namely small- and medium-scale industry, transport, residential and commercial buildings, agriculture, and waste. These are regulated under Decision No. 406/2009/EC (Effort Sharing Decision, ESD) up to 2020, and by the Effort Sharing Regulation (EU) 2018/842 (ESR) from 2021 onward. While non-ETS sector emissions in 2020 remained below the target threshold of 37 MtCO₂eq, in 2022 they exceeded the allowable limit by 5.5 MtCO₂eq, indicating a deviation from the reduction trajectory required to meet ESR targets.
GROSS INLAND ENERGY CONSUMPTION BY SOURCE
Data aggiornamento scheda:
The analysis of the contribution of different primary energy sources to gross inland energy consumption shows that the dominant role of petroleum products is declining, while natural gas (37.9% of the total in 2022) and renewable sources (19.0% of the total in 2022) are increasing. Greater diversification and the growing role of renewables have a positive impact on Italy’s energy self-sufficiency level, which remains among the lowest in industrialized countries.