L’obiettivo “inquinamento zero” è trasversale: contribuisce all’Agenda 2030 delle Nazioni Unite per lo sviluppo sostenibile e integra l’obiettivo della neutralità climatica entro il 2050 in sinergia con gli obiettivi dell’economia pulita e circolare e del ripristino della biodiversità. È parte integrante del Green Deal europeo e di altre iniziative e la Commissione continuerà a inserirlo nelle future iniziative politiche. Il monitoraggio attraverso indicatori in tale ambito è essenziale per garantire una gestione sostenibile delle risorse, preservare la salute umana, proteggere l'ambiente e avanzare verso obiettivi di sostenibilità.
Sono presenti gli indicatori ISPRA che maggiormente possono contribuire a descrivere o a monitorare, parzialmente o integralmente le varie componenti del tema.
AMBIENT AIR QUALITY: PARTICULATE MATTER (PM10)
Data aggiornamento scheda:
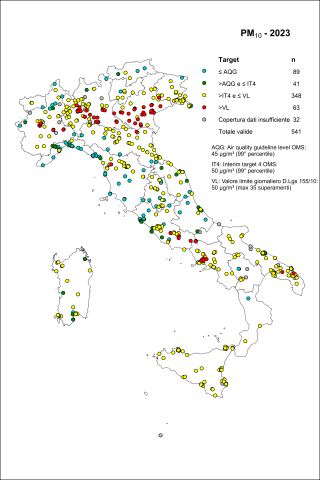
The indicator is based on atmospheric PM10 concentration data measured in 2023 at monitoring stations distributed across the national territory, collected and archived by ISPRA in the InfoAria database, in accordance with Directive 2008/50/EC (and its national transposition, Legislative Decree 155/2010) and Commission Implementing Decision 2011/850/EU. A total of 573 monitoring stations reported PM10 data. Of these, 541 provided time series with sufficient temporal coverage for validation against reference thresholds. No exceedances of the annual limit value were recorded, whereas the daily limit value was exceeded at 63 stations (equivalent to 12% of cases). Furthermore, the vast majority of monitoring stations reported exceedances of both the WHO annual reference level (91% of cases) and the daily reference level (84% of cases).
AMBIENT AIR QUALITY: PARTICULATE MATTER (PM2.5)
Data aggiornamento scheda:
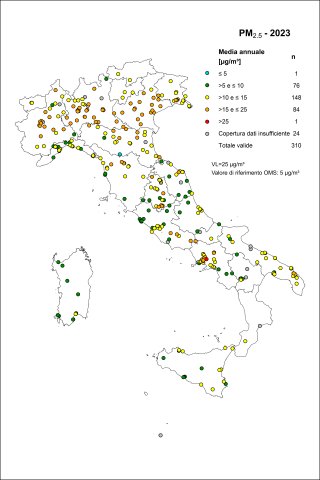
The indicator is based on atmospheric PM2.5 concentration data measured in 2023 at monitoring stations distributed across the national territory, collected and archived by ISPRA in the InfoAria database, in accordance with Directive 2008/50/EC (and its national transposition, Legislative Decree 155/2010, as amended) and Commission Implementing Decision 2011/850/EU.
A total of 334 monitoring stations measured and reported PM2.5 data. Of these, 310 provided data series with sufficient temporal coverage to assess compliance with reference values. The annual limit value for PM2.5 (25 µg/m³) was met at all stations except one, corresponding to 0.3% of cases. However, the majority of monitoring stations (99.7%) exceeded the updated WHO annual reference value of 5 µg/m³ (previously set at 10 µg/m³).
BATHING WATERS QUALITY CLASSIFICATION
Data aggiornamento scheda:
The quality of bathing waters is fundamental for safeguarding citizens' health and also plays an important role from the perspective of protecting the natural environment and in terms of economic aspects in the tourism sector. For this reason, specific monitoring is carried out throughout the entire bathing season.
For the 2023 bathing season, more than 31,000 samples of sea and lake water were collected and analyzed over a total of more than 5,000 km of coastline designated for bathing.
At the municipal level, the kilometers of coastline are divided into more or less extensive bathing waters, for a total of 5,490 bathing waters.
The results of the analyses, in addition to ensuring the absence of health and hygiene risks during the season, also made it possible to classify the waters.
The classification was made using the monitoring results from the 2023 bathing season and those of the previous three seasons (2022-2021-2020).
At the national level, most of the waters fall into the excellent class (90.6%), however, critical issues still persist due to the presence of waters in the poor class (1.3%) and not classifiable (0.5%), for which it is not possible to express a quality judgment.
Also at the regional level, the percentage of waters in the excellent class is the highest and in some cases equals 100%.
In almost all regions, the waters in the sufficient and poor classes are decreasing, but the presence of the latter still prevents the full achievement of the directive’s objective.
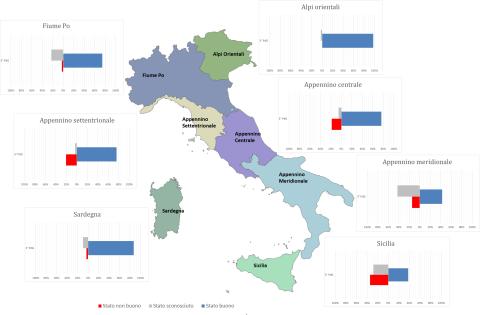
CHEMICAL STATUS OF COASTAL MARINE WATERS
Data aggiornamento scheda:
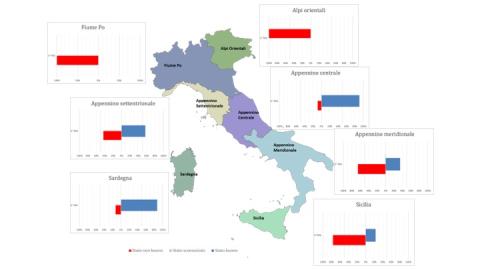
Coastal marine waters are “surface waters located inside an imaginary line, every point of which is one nautical mile seaward from the nearest point of the baseline used to determine the limit of territorial waters, and which may extend up to the outer limit of transitional waters” (Paragraph 1 of Article 74 of Legislative Decree 152/2006). The legislation (Legislative Decree 152/2006) mandates the achievement of a “good” status of water bodies (chemical + ecological) by the dates set by current legislation; failure to achieve environmental objectives results in the implementation of remediation measures. Based on the analysis of data reported by the Districts in the 3rd Reporting to the European Commission for the 2016–2021 six-year period (3rd RBMP), the chemical status of Italian coastal marine waters appears heterogeneous. This heterogeneity is evident both in terms of the number of water bodies identified per district and their classification. The Eastern Alps and Po River Districts have all water bodies in a “not good” chemical status, while in Sicily and the Southern Apennines District, over 60% of the water bodies are in a “not good” status. The Northern Apennines, Central Apennines, and Sardinia Districts, instead, register more than 50%, more than 90%, and more than 80%, respectively, in a “good” chemical status. At the national level, 51% of coastal marine water bodies are in good chemical status. Comparing the 2nd and 3rd RBMPs, in the 2nd RBMP, water bodies with unknown chemical status amounted to 26% (147 out of 561), whereas in the 3rd RBMP, only one water body has an unknown status. Generally, water bodies in good chemical status are comparable between the two RBMPs—52% and 51%, respectively—while water bodies in not good chemical status increased in the 3rd RBMP (49%).
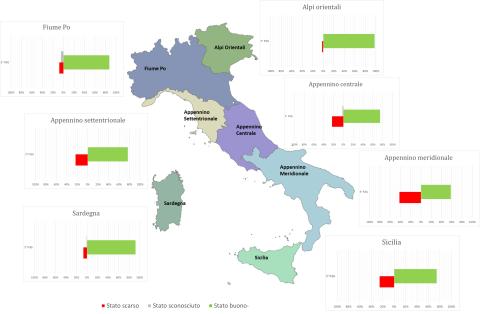
CHEMICAL STATUS OF GROUNDWATER (SCAS)
Data aggiornamento scheda:
The Chemical Status of Groundwater (SCAS) indicator assesses the chemical quality of Italian groundwater bodies by comparing pollutant concentrations with the Environmental Quality Standards and Threshold Values specified in Tables 2 and 3 of Ministerial Decree (DM) 6/7/2016.
Depending on whether these concentration limits are met, a groundwater body is classified as having either good or poor chemical status. This classification, along with quantitative status, determines the overall groundwater condition. The indicator is based on data from the classification of water bodies reported in WISE Reporting for the 3rd River Basin Management Plan (RBMP).
At the national level, during the 2016-2021 classification period related to the 3rd RBMP, there was an increase in groundwater bodies classified as having good chemical status, reaching 70% of the total (compared to 58% in the 2nd RBMP). The percentage of water bodies classified as poor was 27%.
At the district level, the percentage of groundwater bodies with good chemical status ranges from 56% in the Sicily District to 85% in the Eastern Alps District. Across all hydrographic districts, the number of water bodies with unknown status has significantly decreased compared to the previous cycle, with all water bodies now classified in the Eastern Alps, Southern Apennines, and Sicily Districts.
CHEMICAL STATUS OF INLAND SURFACE WATERS
Data aggiornamento scheda:
The indicator provides an assessment of the chemical quality of Italian surface water bodies. The chemical status is evaluated based on the concentration of chemical substances in the water and biota matrices, specifically those listed in the Priority Substances List (Table 1/A of Legislative Decree 152/2006 and subsequent amendments). These substances are classified as priority, priority hazardous, and other substances.
For each substance in the Priority Substances List, Italian legislation—implementing European Directives—establishes Environmental Quality Standards (EQS) that must be met for a water body to be classified as having good chemical status. The chemical status, together with the ecological status, contributes to the overall “environmental status” evaluation of each water body.
The indicator was developed using classification data from the WISE Reporting of the 3rd River Basin Management Plan (RBMP). At both the national and district levels, an increase in the number of water bodies classified as having good chemical status has been observed for rivers and lakes, along with a decrease in the number of unclassified water bodies, compared to the previous cycle.
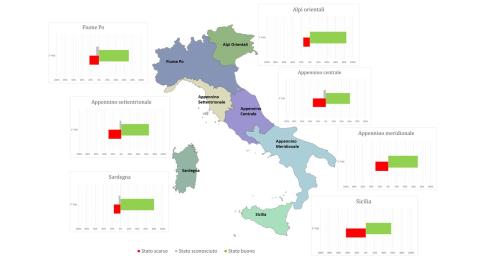
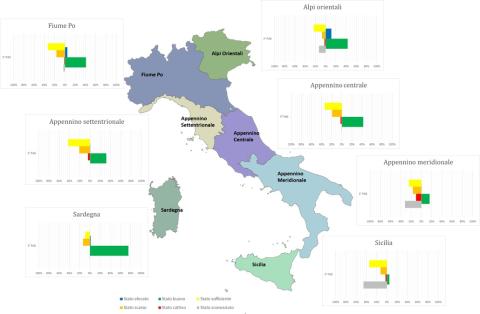
ECOLOGICAL STATUS OF COASTAL MARINE WATERS
Data aggiornamento scheda:
Coastal marine waters are defined as “surface waters situated inside an imaginary line one nautical mile away, at every point, on the outer side from the nearest point of the baseline used to define the territorial sea limit, and potentially extending to the outer boundary of transitional waters.” The legislation (Legislative Decree 152/2006) mandates achieving "good" status (ecological + chemical) for water bodies by the deadlines set by current regulations; failure to meet environmental goals entails remediation measures. Based on the analysis of data reported by Districts in the 3rd Reporting to the European Commission for the six-year period 2016–2021 (3rd WMP), the ecological status of Italian coastal marine waters is heterogeneous. This heterogeneity is expressed in both the number of water bodies identified per district and their ecological classification. The Eastern Alps, Northern Apennines, Central Apennines, Sicily, and Sardinia Districts show a percentage of water bodies in good and high ecological status greater than or equal to 70%. Specifically, in the Sardinia District, more than 40% of water bodies are in high status. Nationally, more than 60% of water bodies (261 out of 394 total) are in good and high ecological status. Comparing data from the 2nd WMP and the 3rd WMP shows that in the 2nd WMP, 27% of water bodies had unknown ecological status (149 out of 561 total), while in the 3rd WMP, only one water body is in unknown ecological status. In general terms, the proportion of water bodies in good and high ecological status increased from 55% in the 2nd WMP to 66% in the 3rd WMP.
ECOLOGICAL STATUS OF INLAND SURFACE WATERS
Data aggiornamento scheda:
The ecological status of surface waters reflects the quality of the structure and functioning of aquatic ecosystems. Directive 2000/60/EC (transposed in Italy with Legislative Decree 152/2006) mandates the achievement of "good" quality status for water bodies, which is determined by the assessment of both ecological and chemical status. The indicator provides an evaluation of the ecological status of surface water bodies—specifically inland waters—based on classification data from the WISE 2022 Reporting related to the 3rd Water Management Plan. At the national level, comparing the ecological quality status data between the 2nd and 3rd Management Plans shows a reduction in water bodies with unknown status, from 18% to 10%, though they are still present. In general, the ecological status has not significantly changed from the previous management cycle, except for the percentage of lakes in good status, which has increased from 17% to 35%.
EMISSIONS OF PARTICULATE MATTER (PM10): TREND AND SECTORAL DISAGGREGATION
Data aggiornamento scheda:
The indicator represents the trend of national particulate matter (PM10) emissions by source sector from 1990 to 2022, showing a significant overall reduction over the years (-40.5%). The road transport sector, which contributes 10% to total emissions in 2022, shows a reduction of 65.6% over the entire period. Emissions from non-industrial combustion, on the other hand, have increased by approximately 37.6% during the same period, becoming the most significant sector in 2022, accounting for 45.3% of total emissions.
FARMS ADOPTING ENVIRONMENTALLY FRIENDLY MEASURES AND PRACTICING ORGANIC FARMING
Data aggiornamento scheda:
n 2023, organic farming in Italy covered 2,456,020 hectares, involving approximately 94,400 organic operators. Organic agriculture accounted for 7.4% of all farms and 19.8% of the utilised agricultural area (UAA), according to the 2021 ISTAT Census, falling 5.2 percentage points short of the 25% UAA target for organic farming.
Over the past 33 years, the trend has been upward in both the number of operators and cultivated area, countering the long-standing decline in utilised agricultural area in Italy.
At the European level, Italy ranks among the most virtuous Member States.
FINE PARTICULATE MATTER EMISSIONS (PM2.5): TREND AND SECTORAL DISAGGREGATION
Data aggiornamento scheda:
The indicator represents the trend of national emissions of particulate matter (PM2.5) by source sector from 1990 to 2022, highlighting a significant overall reduction over the years (-39%). The road transport sector, which contributes 9.3% of total emissions in 2022, shows a 75% decrease over the entire period. Emissions from non-industrial combustion, during the same period, increased by almost 38%, making it the most significant sector in 2022, accounting for 63.8% of total emissions.
MARINE STRATEGY MONITORING - MICRO-LITTER IN THE SURFACE LAYER OF THE WATER COLUMN
Data aggiornamento scheda:
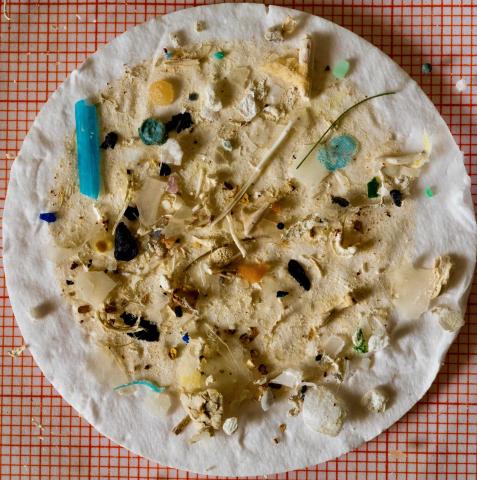
Italy, in application of the Marine Strategy Framework Directive, has implemented an extensive marine litter monitoring program since 2015, including micro-litter present in the surface layer of the water column. This monitoring is conducted by the National System for Environmental Protection (of which ISPRA is a part), under the coordination of the Ministry of Environment and Energy Security (MASE). The composition, quantity, and distribution of surface micro-litter are essential parameters for achieving the good environmental status of marine waters, the objective of the Directive. Micro-litter are particles smaller than 5 mm, whose origin is difficult to identify once dispersed in the environment. These particles derive from both primary sources, such as pellets and microbeads used in cosmetics or abrasive products, and secondary sources, such as the fragmentation of macro-litter. With the data processing carried out from 2016 to 2022, it was possible to define a median density value of micro-particles present in our seas, equal to 0.04 micro-particles per m², or 40,000 micro-particles per km². This value is confirmed by adding the 2023 data to the series. At the Mediterranean level, the Barcelona Convention has set a threshold value of 0.000845 micro-particles per m² (845 micro-particles per km²), therefore, compared to this value, Italy is still far from achieving good environmental status.
MARINE STRATEGY MONITORING – BEACH LITTER
Data aggiornamento scheda:
The Marine Strategy (Directive 2008/56/EC) represents an important governance tool for the marine system, promoting the adoption of strategies aimed at safeguarding the marine ecosystem to achieve Good Environmental Status. Good Environmental Status is assessed based on 11 themes or qualitative descriptors, and among these, Descriptor 10 requires that the properties and quantities of marine litter do not cause harm to the coastal and marine environment. Since 2015, Italy has been implementing an extensive monitoring program for marine litter, including beach litter. In 2023, the median of total marine litter stranded on Italian shores was 250 items per 100 m, the lowest value in the entire historical series. However, this is still a density significantly higher than the threshold value of 20 items per 100 m, established at the European level as a requirement for achieving Good Environmental Status. As in previous years, single-use plastics are the most common type of beach litter, representing 13% of the total; however, for this type of litter, there is a sharp decline compared to 2022 (29%), which, if confirmed in the coming years, could represent a significant first result of the effectiveness of the Marine Strategy Measures Program and, in particular, the application of Directive 2019/904 for the reduction of single-use plastics.
NITRATES IN GROUNDWATER
Data aggiornamento scheda:
The indicator provides the percentage of groundwater monitoring stations divided into quality classes based on the average nitrate concentration recorded over a four-year monitoring period (2016–2019). Specifically:
- 68.1% of stations show an average nitrate concentration below 25 mg/L,
- Only 12.6% of monitored points recorded an average concentration equal to or above 50 mg/L.
Additionally, an analysis comparing the trend over the last four years (2016–2019) to the previous four years (2012–2015) reveals predominantly stable nitrate concentrations, a decrease in average concentration at 37.9% of common stations between the two periods, and an increase at only 22.7% of the same stations.
OSTREOPSIS OVATA CONCENTRATION
Data aggiornamento scheda:
Ostreopsis cf. ovata is a potentially toxic benthic benthic microalgae, currently present in most Italian coastal regions with blooms that can give rise to phenomena of human intoxication and toxic effects on benthic marine organisms (states of suffering or mortality). The continuous expansion along the Italian coasts of Ostreopsis cf. ovata, its blooms and the health, environmental and economic problems associated with it, has led to the establishment of a microalga surveillance monitoring program since 2007. This activity is carried out annually in the summer season by the Regional Agencies for the Environment (ARPA). The data provided so far by ARPA, collected and processed by ISPRA have clarified the distribution and trend of blooms at national and regional level. To date, microalgae has been found at least once in the monitoring campaigns carried out so far in 12 of 15 coastal regions. In 2024, Ostreopsis cf. ovata is present in 11 coastal regions or in 135/196 stations (68.9%), while it is absent in all the samples taken along the coasts of Emilia-Romagna, Marche, Molise and Veneto.
POPULATION EXPOSURE TO OUTDOOR AIR POLLUTANTS - NO₂
Data aggiornamento scheda:
Estimates of the population-weighted annual average exposure (Population Weighted Exposure, PWE) to nitrogen dioxide (NO₂) have been developed at the municipal level through an integrated use of measurements and statistical models. The data, covering the period 2016–2022, enable comparison of PWE across all municipalities and provide a comprehensive overview of average exposure at the national scale.
In 2022, 82% of the population was exposed to NO₂ levels exceeding the WHO guideline value of 10 µg/m³. The national average PWE was 12 µg/m³ (range: 3–38 µg/m³).
Between 2016 and 2022, a downward trend in exposure levels was observed, with an average reduction of approximately 25%, primarily attributable to decreased emissions from road traffic.
POPULATION EXPOSURE TO OUTDOOR AIR POLLUTANTS – OZONE
Data aggiornamento scheda:
Estimates of the population-weighted annual average exposure (Population Weighted Exposure, PWE) to ozone (O₃) have been developed at the municipal level using an integrated approach combining measurements and statistical models. The data, covering the period 2016–2022, allow comparison of PWE across all municipalities and provide a comprehensive overview of average exposure at the national level.
In 2022, 100% of the population was exposed to levels exceeding the WHO guideline value of 60 µg/m³, calculated as the mean of the distribution of daily maximum 8-hour moving averages during the period from April to September.
The national average PWE was 104 µg/m³ (range: 64–134 µg/m³).
No decreasing trend in exposure levels was observed during the period analyzed.
POPULATION EXPOSURE TO OUTDOOR AIR POLLUTANTS – PARTICULATE MATTER PM10
Data aggiornamento scheda:
Estimates of the population-weighted annual average exposure (Population Weighted Exposure, PWE) to PM10 have been developed at the municipal level using an integrated approach combining measurements and statistical models. The data, covering the period 2016–2022, enable comparison of PWE across all municipalities and provide a comprehensive overview of average exposure at the national level.
In 2022, 97% of the population was exposed to levels exceeding the WHO guideline value of 15 µg/m³.
No decreasing trend in exposure levels was observed during the period analyzed: the national average PWE in 2022 matched the 2016 level at 21 µg/m³, with the highest value recorded in 2017 at 23 µg/m³.
POPULATION EXPOSURE TO OUTDOOR AIR POLLUTANTS – PARTICULATE MATTER PM2.5
Data aggiornamento scheda:
Estimates of the population-weighted annual average exposure (Population Weighted Exposure, PWE) to PM2.5 have been developed at the municipal level using an integrated approach combining measurements and statistical models. The data, covering the period 2016–2022, enable comparison of PWE across all municipalities and provide a comprehensive overview of average exposure at the national level.
In 2022, 100% of the population was exposed to levels exceeding the WHO guideline value of 5 µg/m³. The national average PWE was 14 µg/m³ (range: 6–25 µg/m³).
Between 2016 and 2022, the national average decreased from 15 µg/m³ in 2016 to 14 µg/m³ in 2022, representing a 7% reduction.
QUANTITATIVE STATUS OF GROUNDWATER (SQUAS)
Data aggiornamento scheda:
The quantitative status of groundwater describes the balance of a water body in terms of the relationship between extraction and natural replenishment of the water resource. A groundwater body is defined as being in "good quantitative status" if groundwater levels ensure that the annual average withdrawals for long-term anthropogenic activities do not exhaust the available groundwater resources, do not cause damage to surface waters and connected ecosystems, and do not lead to saline intrusion or other types of contamination.
This indicator has been derived from the classification data of water bodies in the WISE Reporting of the 3rd Water Management Plan (WMP). Nationally, during the 2016-2021 classification period under the 3rd WMP, an increase in groundwater bodies classified as being in "good quantitative status" was observed, reaching 79% of the total (compared to 61% in the 2nd WMP). The percentage of groundwater bodies in "poor" status is 19%, while 2% remain unclassified. At the district level, the percentages of water bodies achieving "good quantitative status" range from 98% in the Eastern Alps District to 58% in the Southern Apennine District.
USE AND RISK OF CHEMICAL PLANT PROTECTION PRODUCTS
Data aggiornamento scheda:
The European Farm to Fork strategy sets two targets to be achieved by 2030: a 50% reduction in the use and risk of chemical pesticides and a 50% reduction in the use of the most hazardous pesticides. To measure progress towards these targets, two indicators have been defined based on the sales of active substances contained in plant protection products and the hazardous properties of these substances. The indicators described represent the European and national trends in progress towards the pesticide reduction goals of the Farm to Fork strategy. In 2022, the use and risk of chemical pesticides showed a 36% decrease at the European level compared to the 2015-2017 baseline period. For Italy, the reduction exceeds the European target, reaching 53%, with a 10 percentage point decrease in the last year. Regarding the use of the most hazardous pesticides, the national decrease in 2022 was faster than the European one, amounting to a 34% reduction compared to the European 25% (relative to the 2015-2017 period).
WATER QUALITY – PESTICIDE POLLUTION
Data aggiornamento scheda:
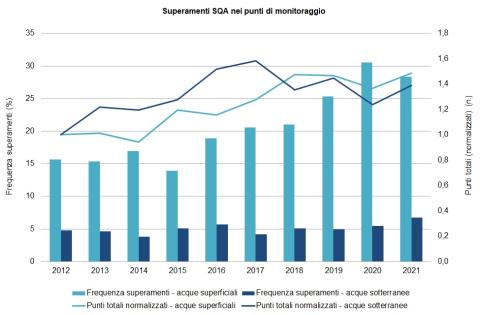
The indicator allows for the assessment of surface and groundwater contamination by pesticide residues released into the environment. Monitoring pesticide presence in water is complex due to the number of substances involved and their diffuse use. Measured levels are compared with the concentration limits established by current regulations. The presented indicators provide an analysis of the evolution of contamination over the 2012–2021 decade, in terms of the frequency of pesticide detection in water, as well as the environmental risks arising from their use. Data from 2021 confirm a state of contamination already reported in previous years, with exceedances of legal limits particularly in surface waters (28.3% of monitoring points); in groundwater, 6.8% of points exceed regulatory limits.