Panel 1
Giorgio Cattani, Mariacarmela Cusano, Alessandro Di Menno di Bucchianico, Raffaela Gaddi, Alessandra Gaeta, Giuseppe Gandolfo, Gianluca Leone

The indicator is based on atmospheric PM10 concentration data measured in 2023 at monitoring stations distributed across the national territory, collected and archived by ISPRA in the InfoAria database, in accordance with Directive 2008/50/EC (and its national transposition, Legislative Decree 155/2010) and Commission Implementing Decision 2011/850/EU. A total of 573 monitoring stations reported PM10 data. Of these, 541 provided time series with sufficient temporal coverage for validation against reference thresholds. No exceedances of the annual limit value were recorded, whereas the daily limit value was exceeded at 63 stations (equivalent to 12% of cases). Furthermore, the vast majority of monitoring stations reported exceedances of both the WHO annual reference level (91% of cases) and the daily reference level (84% of cases).
Airborne particulate matter refers to the mixture of solid and liquid particles suspended in ambient air. The term PM10 denotes particles with an aerodynamic diameter less than or equal to 10 µm. These particles exhibit long atmospheric residence times and can be transported over considerable distances from their emission sources. They possess a chemically complex and variable composition and are capable of penetrating the human respiratory tract, with adverse effects on health.
PM10 originates partly from direct emissions into the atmosphere (primary PM10) and partly from atmospheric chemical reactions involving other pollutant species (secondary PM10). Its sources can be both natural—such as wind erosion of rocks, volcanic eruptions, and spontaneous wildfires—and anthropogenic, including combustion processes. Among the main anthropogenic sources, residential wood burning and vehicular traffic play a major role. Secondary PM10 formation is also influenced by anthropogenic gaseous precursors, including sulfur oxides, nitrogen oxides, volatile organic compounds (VOCs), and ammonia.
The indicator was developed based on atmospheric PM10 concentration data measured in 2023 at monitoring stations across the national territory, collected and archived by ISPRA in the InfoAria database in accordance with Decision 2011/850/EU. In addition to parameters for comparison with health protection limit values established by the reference legislation (Legislative Decree 155/2010) and WHO air quality guidelines (WHO-AQG, 2021), the following statistical metrics were calculated: mean, 5th, 25th, 50th, 75th, 90.4th, and 99th percentiles, as well as the maximum of daily average values.
To provide information on the state of air quality through statistical parameters calculated from ambient PM10 concentration data, verifying compliance with regulatory limit values and comparing the results with the reference levels established by the World Health Organization (WHO).
Decisione 2011/850/EU – Commission Implementing Decision laying down rules for Directive 2004/107/EC and Directive 2088/50/EC of the European Parliament and of the Council as regards the reciprocal exchange of information and reporting on ambient air quality.
The objective of Directive 2008/50/EC is to enable the assessment of air quality on a harmonized basis, to gather information on the state of ambient air quality with the aim of combating air pollution, to ensure public availability of this information, and to promote cooperation among Member States. Legislative Decree 155/2010, which transposes the directive into national law, further aims to support regions and autonomous provinces in the assessment and management of ambient air quality. The limit values established by Legislative Decree 155/2010 represent air quality objectives to be pursued in order to avoid, prevent, and reduce harmful effects on human health and the environment as a whole. The reference values set by the World Health Organization (WHO) serve as guidelines for reducing the health impacts of air pollution.
The PM10 ambient air quality limit values set by Legislative Decree 155/2010 are:
- 24-hour averaging period: 50 µg/m³, not to be exceeded more than 35 times per calendar year;
- Annual averaging period: 40 µg/m³.
The WHO guideline values for PM10 in ambient air, as outlined in the 2021 WHO Global Air Quality Guidelines, are:
- 24-hour averaging period: 45 µg/m³, to be assessed at the 99th percentile of daily mean values over a calendar year;
- Annual averaging period: 15 µg/m³.
Panel 2
ISPRA, Annuario dei dati ambientali, various editions
SNPA, 2024, La qualità dell'aria in Italia. Ed. 2023
WHO global air quality guidelines. Particulate matter (PM2.5 and PM10), ozone, nitrogen dioxide, sulfur dioxide and carbon monoxide. Geneva: World Health Organization; 2021.
Data quality assessment
Province Autonome, Regioni, SNPA (Sistema Nazionale per la protezione dell’ambiente)
Database InfoAria- ISPRA
National
Regional: (20/20)
Provincial: (104/110)
Municipal: (381/8047)
2014-2023
Indicator assessment
The indicator is based on PM10 concentration data measured at monitoring stations distributed across the national territory, collected and archived by ISPRA in the InfoAria database, in accordance with Commission Implementing Decision 2011/850/EU. Parameters were calculated to enable comparison with the limit values for the protection of human health established by the relevant legislation (Legislative Decree 155/2010) and with the reference values set by the WHO for human health protection. All parameters were computed following European methodological standards and were validated by Regions, Autonomous Provinces, and regional/provincial environmental protection agencies (ARPA/APPA).
For comparison with the daily and annual limit values defined by Legislative Decree 155/2010 and with the WHO reference levels (as shown in Figures 2 and 3), only data series with a minimum temporal coverage of 90% were considered (excluding data gaps due to scheduled calibration or routine maintenance).
The statistical trend analysis (2014–2023) was conducted using the Mann-Kendall method adjusted for seasonality. Implementing a deseasonalization procedure allows for minimizing the influence of interannual variability due to deviations from the average seasonal cycle, highlighting any underlying trends, quantifying their statistical significance, and estimating the annual variation in mean concentrations over the observation period.
In 2023, no exceedances of the annual limit value were recorded. The daily limit value was exceeded at 63 stations (corresponding to 12% of cases), predominantly located in the Po Valley and in certain urban areas of Central and Southern Italy. Furthermore, the majority of monitoring stations reported exceedances of both the WHO annual reference level (91% of cases) and the daily reference level (84% of cases) (Table 1, Figures 2 and 3).
For PM10, a statistically significant decreasing trend was observed in 51% of cases (229 monitoring stations out of 448), with an estimated average annual variation of -0.6 µg/m³ per year [-2.1 µg/m³y to -0.2 µg/m³y]. Among the subset of stations showing a statistically significant decline, the mean annual reduction was 2.1% [-6.7% to -0.9%]. In contrast, for 45% of cases (200 stations out of 448), no statistically significant trend could be identified for PM10 (Table 4, Figures 4 and 5).
Data
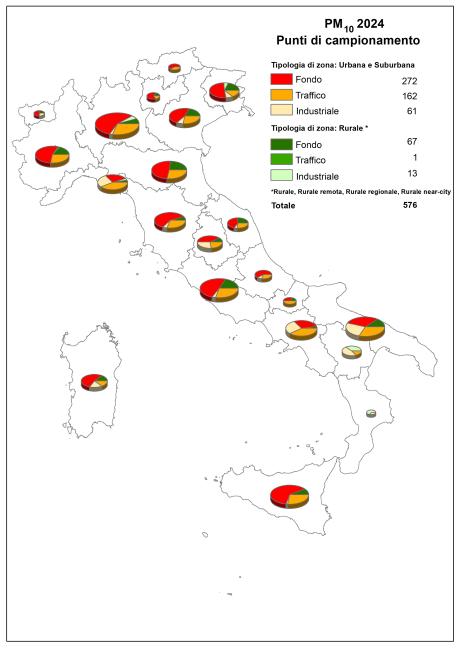
Figura 1: PM10 Classificazione dei punti di campionamento secondi i criteri di ubicazione su macroscala (Allegato III, D.Lgs.155/2010) (2024)
Elaborazione ISPRA su dati SNPA
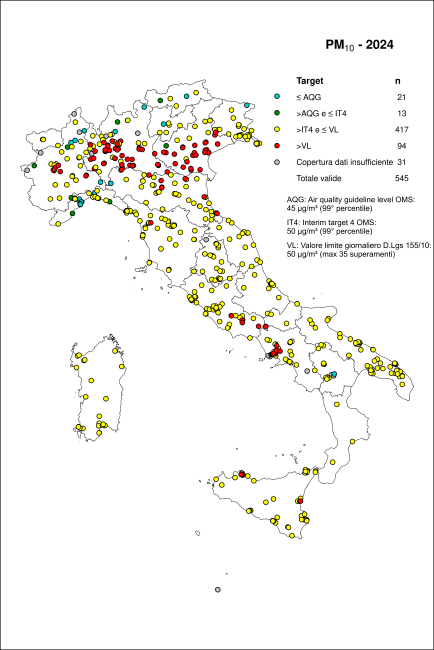
Figura 2: PM10 Stazioni di monitoraggio e superamenti del valore limite giornaliero per la protezione della salute (2024)
Elaborazione ISPRA su dati SNPA
AQG - Air Quality Guideline Levels OMS: 45 µg/m³, 99° percentile; IT4 - Interim Target 4 OMS: 50 µg/m³, 99° percentile;
VL - Valore Limite per la protezione della salute umana D.Lgs.155/2010: 50 µg/m³, da non superare più di 35 volte per anno civile
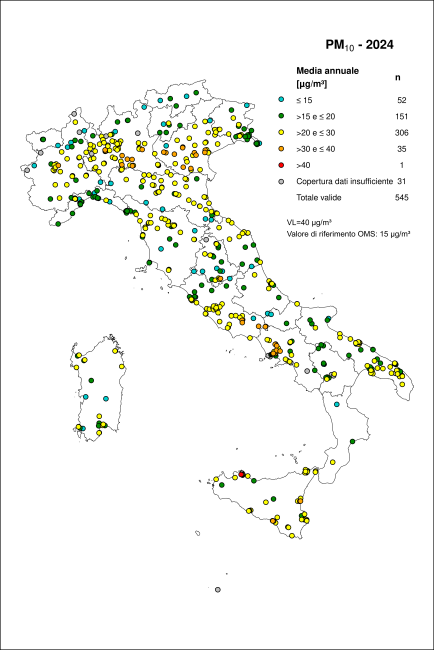
Figura 3: PM10 Stazioni di monitoraggio e superamenti del valore limite annuale per la protezione della salute (2024)
Elaborazione ISPRA su dati SNPA
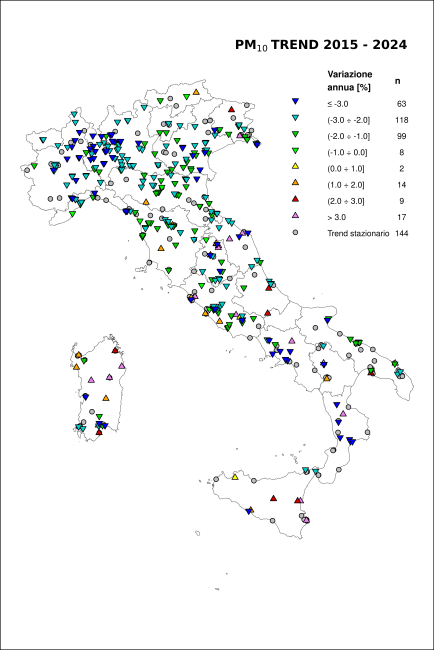
Figura 4: PM10 - Variazione percentuale media annua stimata della concentrazione presso le 474 stazioni analizzate.
Elaborazione ISPRA su dati SNPA
Risultati dell’analisi del trend (2015-2024) con il test di Kendall corretto per la stagionalità su un campione di 474 stazioni.
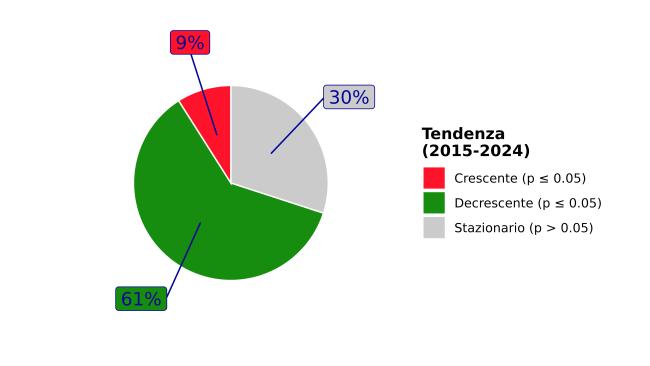
Figura 5: PM10 - Distribuzione percentuale delle stazioni di monitoraggio in base all'andamento del trend osservato nel periodo 2015-2024.
Elaborazione ISPRA su dati SNPA
Tabella 1: PM10 - Stazioni di monitoraggio: dati e parametri statistici per la valutazione della qualità dell'aria (2024)
Elaborazione ISPRA su dati SNPA
“1” tipo di zona: U = URBANA; S = SUBURBANA; R = RURALE
“2” tipo di stazione: T = TRAFFICO; F = FONDO; I = INDUSTRIALE
"3" in grassetto i dati riportati in mappa. Valore evidenziato in grassetto soltanto per serie di dati con almeno il 90% di dati validi al netto delle perdite dovute alla taratura periodica o alla manutenzione ordinaria (in accordo ai criteri di qualità definiti nella normativa vigente, D.Lgs.155/2010).
“-” valore non calcolato per mancanza di dati.
Tabella 2 - PM10. Classificazione delle zone rispetto alle soglie di valutazione e verifica della presenza di superamenti del valori limite giornaliero ai sensi del D.Lgs.155/2010 (2024)
Elaborazione ISPRA su dati SNPA
zona: parte del territorio nazionale delimitata, ai sensi del D.Lgs 155/2010, ai fini della valutazione e della gestione della qualità dell'aria ambiente;
agglomerato: zona costituita da un'area urbana o da un insieme di aree urbane che distano tra loro non più di qualche chilometro oppure da un'area urbana principale e dall'insieme delle aree urbane minori che dipendono da quella principale sul piano demografico, dei servizi e dei flussi di persone e merci, avente: 1) una popolazione superiore a 250.000 abitanti oppure; 2) una popolazione inferiore a 250.000 abitanti e una densità di popolazione per km 2 superiore a 3.000 abitanti;"
Superamento VL giornaliero: Si intende superato qualora sia stato determinato il superamento in almeno una stazione di monitoraggio collocata nel territorio della zona.
Classificazione: aboveUAT: superiore alla soglia di valutazione superiore (70% del valore limite, 35 μg/m³ da non superare più di 35 volte per anno civile); LAT-UAT : compresa tra la soglia di valutazione inferiore e la soglia di valutazione superiore; belowLAT : inferiore alla soglia di valutazione inferiore (50% del valore limite, 25 μg/m³ da non superare più di 35 volte per anno civile)
Il superamento delle soglie di valutazione superiore e delle soglie di valutazione inferiore deve essere determinato in base alle concentrazioni degli inquinanti nell'aria ambiente nei cinque anni civili precedenti. Il superamento si realizza se la soglia di valutazione è stata superata in almeno tre sui cinque anni civili precedenti.
Tabella 3 - PM10. Classificazione delle zone rispetto alle soglie di valutazione e verifica della presenza di superamenti del valore limite annuale ai sensi del D.Lgs.155/2010 (2024)
Elaborazione ISPRA su dati SNPA
zona: parte del territorio nazionale delimitata, ai sensi del D.Lgs 155/2010, ai fini della valutazione e della gestione della qualità dell'aria ambiente;
"agglomerato: zona costituita da un'area urbana o da un insieme di aree urbane che distano tra loro non più di qualche chilometro oppure da un'area urbana principale e dall'insieme delle aree urbane minori che dipendono da quella principale sul piano demografico, dei servizi e dei flussi di persone e merci, avente: 1) una popolazione superiore a 250.000 abitanti oppure; 2) una popolazione inferiore a 250.000 abitanti e una densità di popolazione per km 2 superiore a 3.000 abitanti;"
Superamento VL giornaliero: Si intende superato qualora sia stato determinato il superamento in almeno una stazione di monitoraggio collocata nel territorio della zona.
Classificazione:
aboveUAT: superiore alla soglia di valutazione superiore (70% del valore limite, 35 μg/m³ da non superare più di 35 volte per anno civile)
LAT-UAT : compresa tra la soglia di valutazione inferiore e la soglia di valutazione superiore
belowLAT : inferiore alla soglia di valutazione inferiore (50% del valore limite, 25 μg/m³ da non superare più di 35 volte per anno civile)
(a): Valutazione del superamento ottenuta mediante modello
Il superamento delle soglie di valutazione superiore e delle soglie di valutazione inferiore deve essere determinato in base alle concentrazioni degli inquinanti nell'aria ambiente nei cinque anni civili precedenti. Il superamento si realizza se la soglia di valutazione è stata superata in almeno tre sui cinque anni civili precedenti.
Tabella 4 – PM10. Analisi dei trend per stazione di monitoraggio (2015-2024)
p≤ 0,05: il trend osservato è statisticamente significativo
p>0,05: non può essere esclusa l'ipotesi nulla (assenza di trend)
Δy: variazione media annuale stimata sulla base dei risultati del test di Kendall corretto per la stagionalità
A total of 573 monitoring stations measured and reported PM10 data. Of these, 541 stations (94% of the total) met the minimum temporal coverage requirement of 90%, excluding data gaps due to scheduled calibrations or routine maintenance. All Italian regions are represented (Table 1). The classification of PM10 monitoring stations according to macroscale siting criteria, as defined by legislation, is shown in Figure 1.
Daily limit value exceedances were observed in 19 out of 82 zones, distributed across 8 regions, whereas no exceedances of the annual limit value were recorded in any of the 82 zones (Tables 2 and 3).
A statistical trend analysis of PM10 concentrations for the period 2014–2023 was also conducted across 448 monitoring stations nationwide. The dataset is homogeneous, as all included stations maintained continuous data series throughout the period, with a minimum annual data coverage of 75% (Table 4).