Gianluca Maschio, Emanuela Pace, Sonia Rossi (ISTAT), Giovanni Seri (ISTAT)
The European strategy Farm to Fork sets two objectives to be achieved by 2030, which consist of reducing the use and risk of chemical pesticides by 50% and reducing the use of the most dangerous pesticides by 50%. In order to measure the progress made towards these objectives, two indicators have been defined based on the sales of active substances contained in plant protection products and on the dangerous properties of these substances. The indicators described represent the European and national trend of progress towards the pesticide reduction objectives of the strategy Farm to Fork. In 2023, the use and risk of chemical pesticides, both at European and national level, will be reduced, compared to the reference period 2015-2017, beyond the set target, with decreases corresponding to 58% and 64% respectively. As regards the use of the most dangerous pesticides, however, the trend towards the objective of 50% reduction is slower, in fact in 2023 the European reduction will reach 27%, that of Italy 29%.
The European strategy Farm to Fork (from producer to consumer) is at the heart of Green Deal european Union with the aim of making food systems fair, healthy and environmentally friendly. The strategy focuses on the need to better balance the relationship between nature and the food system, considering the strong impact of the latter on global greenhouse gas emissions, the consumption of natural resources and the loss of biodiversity. Our food systems will have to be relocated within a path aimed at environmental recovery, while at the same time guaranteeing food security, nutrition and public health, also allowing for the economic accessibility of food and fairer economic returns. As part of the transition towards a sustainable food system, the European Commission has announced two objectives for the reduction of chemical pesticides in agriculture, to be achieved by 2030. To monitor the progress made towards the reduction objectives, two indicators have been defined based on the sales data of the active substances contained in plant protection products: the first relates to the set of chemical active substances weighted by their hazardous properties; the second relates to the most dangerous active substances, represented by substances "candidate for replacement".
Measure the progress made towards the objectives of reducing the use and risk of chemical pesticides by 50% and reducing the use of the most dangerous pesticides by 50% by 2030. Furthermore, set in a national context, they describe the progress made by Italy and allow the comparison of this contribution with the European trend.
The European Commission, in line with the Green Deal european Union (COM(2019) 640 final) adopts the strategy Farm to Fork with Communication (COM(2020) 381 final ) to the European Parliament, the Council, the European Economic and Social Committee and the Committee of the Regions. The strategy sets two objectives for the reduction of chemical pesticides in agriculture to be achieved by 2030, which consist of reducing the use and risk of chemical pesticides at European level by 50% and the use of the most dangerous pesticides by 50%. In order to measure progress towards these reduction targets, the Commission has developed two indicators: trends in the use and risk of chemical pesticides and trends in the use of the most dangerous pesticides.
In the context of the strategy, the most dangerous pesticides are plant protection products containing one or more active substances approved as “candidate for substitution” pursuant to Article 24 of Regulation (EC) No. 1107/2009 and listed in part E of the annex to Implementing Regulation (EU) no. 540/2011, or containing one or more active substances listed in the annex to Implementing Regulation (EU) 2015/408.
A common framework of reference for the systematic production of community statistics on the placing on the market and use of pesticides is provided by Regulation (EC) 1185/2009 on statistics on pesticides.
The indicators described (trends in the use and risk of chemical pesticides and trends in the use of the most dangerous pesticides) are based on sales data. Sales represent one variable proxy , as pesticide use data is not available.
EU-level determination of reduction targets for individual Member States
https://food. ec. europa. eu/plants/pesticides/sustainable-use-pesticides/farm-fork-targets-progress/eu-trends_en
EU, National
2015-2023
To calculate the trend indicator of the use and risk of chemical pesticides, the annual sales data of the active substances contained in chemical plant protection products are used. The substances are divided into 4 groups, each of which is assigned a weight that represents the risk associated with their use. The indicator is obtained as a weighted average of the quantities of each substance by its relative weight in relation to the average of the three-year period 2015-2017.
The use indicator of the most dangerous pesticides is obtained by adding the annual sales of the active substances candidates for replacement, weighted with respect to the three-year period 2015-2017.
The procedure for calculating the indicators is similar to that used for the harmonized risk indicator (HRI-1) established with Directive (EU) 2019/782 ( Harmonized Risk Indicators (HRI) | PAN-Fitosanitari (isprambiente. it)) and is illustrated in detail on the EUROSTAT website Statistics | Eurostat (europa. eu)
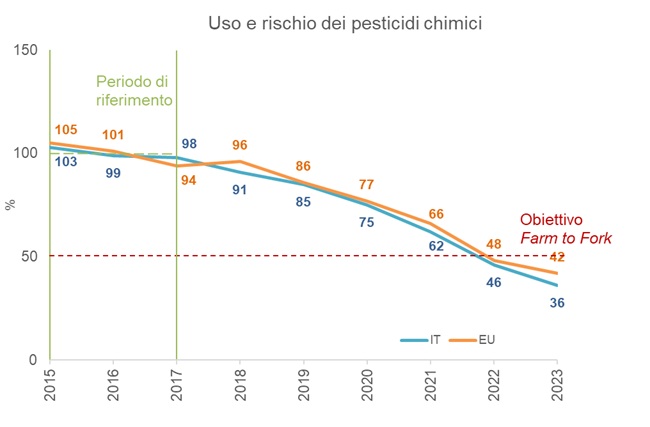
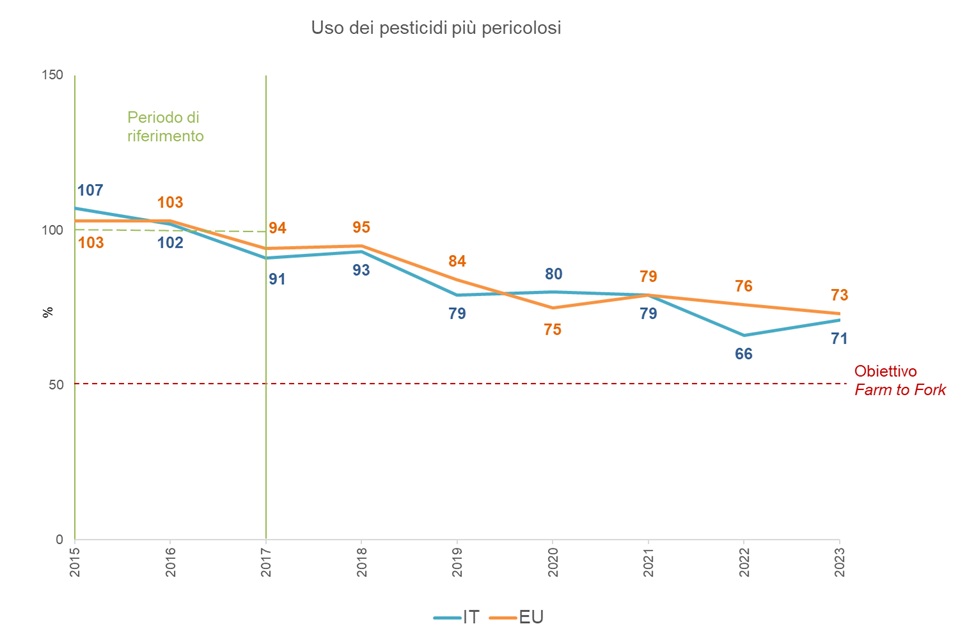
The indicator on the use and risk of chemical pesticides in Europe reaches 42% in 2023 compared to the reference period 2015-2017; for Italy, however, the value is equal to 36%, therefore there is a reduction that exceeds the objective set at European level. As regards the use of the most dangerous pesticides, the national indicator in 2023 is equal to 71%, while the European one corresponds to 73%.
As regards the use of the most dangerous pesticides, the national and European indicators slowly decrease in the reference period, in the last year the decrease for Italy corresponds to 29%, while the European one corresponds to 27% (compared to the three-year period 2015-2017). This second indicator, although showing less rapid reduction trends than the first indicator, indicates a positive evolution.
Overall, the observed reductions are in line with the 50% reduction targets set in the strategy Farm to Fork.
| Data |
|---|
Thumbnail
Titolo
Figure 1: Trends in the use and risk of chemical plant protection products Fonte
ISTAT, European Commission (DG SANTE) |
Thumbnail
Titolo
Figure 2: Trends in the use of more hazardous chemical plant protection products Fonte
ISTAT, European Commission (DG SANTE) |
The indicator on the use and risk of chemical plant protection products highlights that the progress made by the EU and Italy is consistent with the 50% reduction trajectory by 2030 envisaged by the “Farm to Fork” strategy.
The first indicator shows a decrease in the use and risk of chemical pesticides in 2023 beyond the target set at European level. The decrease in the EU is 58%, compared to the reference period 2015-2017; for Italy the reduction reaches 64%, with a decrease of 10 percentage points in the last year (Figure 1).
As regards the use of the most dangerous pesticides (Figure 2), the national trend, although fluctuating, is decreasing, in 2023 it decreased by 29% compared to the three-year period 2015-2017; the European reduction is more constant and corresponds to 27% in the last year.
Overall, the results described indicate significant progress towards reducing the impact of plant protection products, while making it necessary to maintain a high level of attention to consolidate these trends and encourage further improvements in terms of environmental protection.