Gianluca Maschio, Emanuela Pace

The indicator allows for the assessment of surface and groundwater contamination by pesticide residues released into the environment. Monitoring pesticide presence in water is complex due to the number of substances involved and their diffuse use. Measured levels are compared with the concentration limits established by current regulations. The presented indicators provide an analysis of the evolution of contamination over the 2012–2021 decade, in terms of the frequency of pesticide detection in water, as well as the environmental risks arising from their use. Data from 2021 confirm a state of contamination already reported in previous years, with exceedances of legal limits particularly in surface waters (28.3% of monitoring points); in groundwater, 6.8% of points exceed regulatory limits.
The use of plant protection products (also known as pesticides) plays an important role in ensuring the yield and quality of agricultural products; however, these chemicals can pose a risk to human health and ecosystems, with both immediate and long-term impacts.
The indicator allows the assessment of surface and groundwater contamination by pesticide residues released into the environment and the associated risks. In addition to plant protection products used in agriculture, pesticides also include biocides, which in some cases use the same active substances. Monitoring pesticides in water is complex due to the number of substances involved and the widespread use over large areas. Measured concentrations are compared with environmental limits established at both the European and national levels: Environmental Quality Standards (EQS). For groundwater, the limits correspond to those for drinking water, while for surface waters, they are set based on ecotoxicological evaluations of the substances.
The purpose is to provide a representation of the contamination status of surface and groundwater by pesticides at the national level, with reference to the concentration limits set by current regulations.
To identify the substances most frequently found in water bodies, supporting decision-making processes aimed at reducing environmental risks.
To track the evolution of contamination from pesticide use.
Monitoring of pesticides in water is carried out in accordance with the tasks established by the National Action Plan (Ministerial Decree No. 35 of January 22, 2014), pursuant to Directive 2009/128/EC on the sustainable use of pesticides, in order to obtain information on water quality, identify unforeseen effects not adequately addressed during authorization, and ensure proper control during use.
From a regulatory standpoint, pesticides include plant protection products (Regulation EC 1107/2009), used for plant protection and storage of plant products, and biocides (Regulation EU 528/2012), used in various fields (disinfectants, preservatives, non-agricultural pesticides, etc.). In some cases, both types of products share the same active ingredients.
Monitoring fits into the broader regulatory framework for water protection. Directive 2000/60/EC and related directives establish environmental quality standards for surface waters (Directive 2008/105/EC and Directive 2013/39/EU, transposed in Italy by Legislative Decree 172/15) and quality standards for groundwater protection (Directive 2006/118/EC transposed by Legislative Decree 30/09 and Ministerial Decree No. 165 of July 6, 2016). Directive 2009/90/EC (transposed in Italy by Legislative Decree 260/2010) sets minimum performance criteria for chemical analysis methods and rules to ensure the quality of analytical results. The analysis of contamination trends complies with Directive 2009/128/EC, which establishes a framework for sustainable pesticide use and a National Action Plan. This Plan, implemented by Ministerial Decree No. 35 of January 22, 2014, provides a set of indicators, including some specifically for aquatic environment protection, detailed in the Interministerial Decree of July 15, 2015, which defines data collection and processing methods for implementing the indicators set out in the Plan.
SNPA, National Report on Pesticide Monitoring in Water – 2021 Data (2024 edition)
ISPRA, National Report on Pesticide Monitoring in Water (various editions)
Data retrieval difficulties; inconsistencies among different territorial units (monitoring networks, sampling frequency, substances monitored, laboratory performance).
Improving the indicator requires broader spatial and temporal monitoring coverage, harmonization of investigations according to substance prioritization criteria, and enhancement of analytical methods with lower quantification limits.
ARPA/APPA (Regional and Autonomous Province Environmental Protection Agencies), Autonomous Provinces, Regions
The pesticide monitoring data produced by the regions are transmitted to ISPRA through the National Information System for the Protection of Italian Waters (SINTAI). The monitoring results can be consulted on the ISPRA Pesticide Portal (Pesticide Monitoring Portal – Portale di monitoraggio dei Pesticidi (isprambiente.it))
National (I)
2012-2021
The contamination level is given by the number of non-compliant monitoring points out of the total number of monitored points.
Non-compliant monitoring points are those where the concentration of substances exceeds legal reference limits.
Monitoring points with pesticide presence are those where concentrations exceed 30% of the reference regulatory limit.
Pesticide detection frequency is reported as the percentage of samples in which the substance concentration is above the quantification limit.
2021 monitoring data show widespread pesticide presence in water: 28.3% of surface water and 6.8% of groundwater monitoring points have concentrations exceeding regulatory limits (Table 1). As seen in previous years, contamination is more significant in the Po-Venetian plain due to the region’s hydrological characteristics and intensive agricultural use. However, more effective monitoring is also revealing contamination in central and southern Italy. Despite the progressive improvement in investigations—which require constant updates to include newly marketed substances—the monitoring results are still insufficient to fully represent the national situation.
Monitoring indicates widespread pesticide presence in water, with an increasing frequency of detection over time—particularly in surface waters, which reached a 56% detection rate in 2021 (Figure 6). This increase is related to improved monitoring in terms of network coverage, number of samples analyzed, and substances searched. It can be reasonably stated that we are still in a transitional phase where the extent and spread of pollution are not yet fully understood, especially considering the continuous emergence of new substances.
| Data |
|---|
Headline
Table 1: National summary of the substances monitored and pesticide concentration levels at monitoring points (2021) Data source
Data processed by ISPRA using information provided by the Regions, Autonomous Provinces, and the Regional/Provincial Environmental Protection Agencies (ARPA/APPA). Data legend
a) The average measured concentrations exceed the EQS (Environmental Quality Standards); b) The average measured concentrations are equal to or between 30% of the EQS and the EQS; c) Includes concentrations below 30% of the EQS and measurements below the limit of quantification. |
Headline
Table 2: Substances detected above the EQS in surface waters (2021) Data source
ISPRA elaboration based on data from regions, autonomous provinces, and ARPA/APPA
Data legend
a) Total number of monitoring points; b) Monitoring points with average residue concentration exceeding the EQS (Environmental Quality Standards). |
Headline
Table 3: Substances detected above the EQS in groundwater (2021) Data source
ISPRA elaboration on data from regions, autonomous provinces, and ARPA/APPA.
Data legend
a) Total number of monitoring points; b) Monitoring points with average residue concentration exceeding the EQS (Environmental Quality Standards). |
Thumbnail

Headline
Figure 1: Monitoring points (2012-2021) Data source
ISPRA elaboration on data from regions, autonomous provinces, and ARPA/APPA |
Thumbnail
Headline
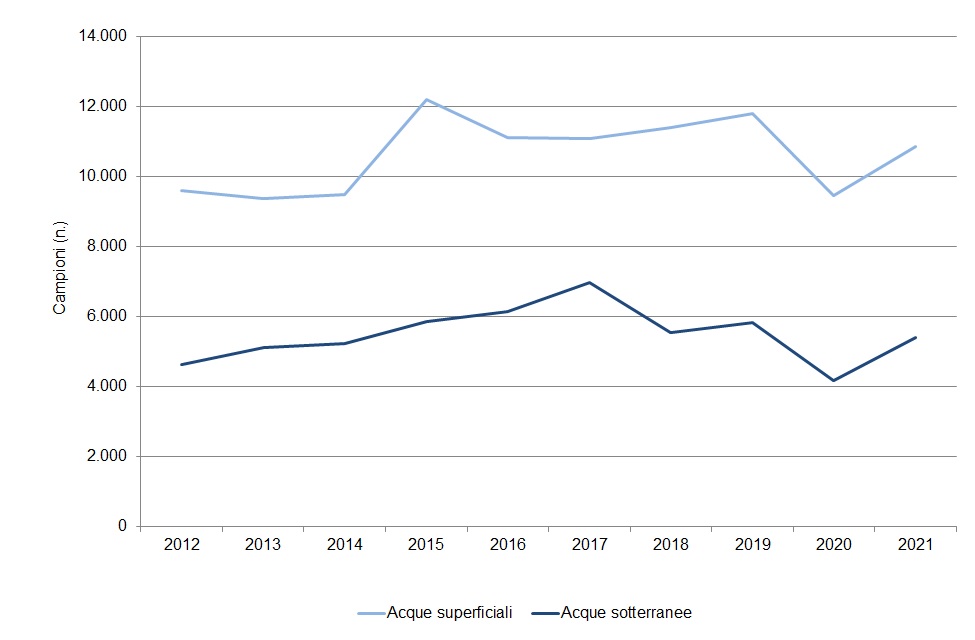
Figure 2: Number of samples monitored (2012-2021) Data source
ISPRA elaboration on data from regions, autonomous provinces, and ARPA/APPA.
|
Thumbnail

Headline
Figure 3: Number of substances analyzed (2012-2021) Data source
ISPRA elaboration on data from regions, autonomous provinces, and ARPA/APPA |
Thumbnail

Headline
Figure 4: Pesticide concentration levels at surface water monitoring points (2021)" Data source
ISPRA elaboration on data from regions, autonomous provinces, and ARPA/APPA |
Thumbnail

Headline
Figure 5: Pesticide concentration levels at groundwater monitoring points (2021 Data source
ISPRA elaboration based on data from regions, autonomous provinces, and ARPA/APPA |
Thumbnail

Headline
Figure 6: Detection frequency in samples and extent of pesticide monitoring in surface waters Data source
ISPRA elaboration based on data from regions, autonomous provinces, and ARPA/APPA
Note
The detection frequency represents the percentage of samples containing pesticide residues. The number of samples is normalized to the starting year of the trend and corresponds to 9,612; the number of substances analyzed corresponds to 254. |
Thumbnail

Headline
Figure 7: Detection frequency in samples and extent of pesticide monitoring in groundwater Data source
ISPRA elaboration based on data from regions, autonomous provinces, and ARPA/APPA
Note
The detection frequency represents the percentage of samples containing pesticide residues. The number of samples is normalized to the starting year of the trend and corresponds to 4,638; the number of substances analyzed corresponds to 315. |
Thumbnail
Headline
Figure 8: Exceedances of Environmental Quality Standards (EQS) at monitoring sites Data source
ISPRA elaboration based on data from regions, autonomous provinces, and ARPA/APPA
Note
The exceedance frequency represents the percentage of monitoring sites where the average concentration of pesticides exceeds the Environmental Quality Standards (EQS). The number of monitoring sites is normalized to the starting year of the trend and corresponds to 1,343 for surface waters and 2,063 for groundwater. |
National monitoring has improved over the 2012–2021 period. There has been an increase in territorial coverage, number of samples, and substances searched (Figures 1, 2, and 3). Contamination levels refer to environmental limits defined by water protection regulations—these limits are the Environmental Quality Standards (EQS).
In surface waters, 566 out of 1,997 monitoring points (28.3%) exceeded EQS. In groundwater, 194 out of 2,867 monitoring points (6.8%) were non-compliant (Table 1).
2021 data confirm a contamination status already reported in previous years, with substantial exceedances mainly in surface waters. In some cases, high limits of quantification (LoQ) hinder proper contamination assessment. Additionally, the absence of findings may result from a narrow and unrepresentative range of investigated substances. Pesticide contamination is more prevalent in the Po-Venetian plain (Figures 4 and 5), largely due to more representative investigations in northern regions. In the rest of the country, the situation remains quite uneven, with limited territorial coverage and substances monitored in some regions.
The substances most frequently causing EQS exceedances in surface waters (Table 2) are glyphosate—the most widely used herbicide in Italy—and its metabolite AMPA, exceeding EQS in 16% and 45.3% of monitored sites, respectively. Noteworthy are the herbicide metolachlor and its metabolite metolachlor-ESA (above limits in 1.9% and 14.5% of sites), as well as the priority substance cypermethrin (2.2%), for which actual contamination may be underestimated due to its very low and hard-to-detect EQS.
In groundwater (Table 3), the most frequent non-compliant substance is the metabolite metolachlor-ESA, found in 4.6% of sites, followed by the triazine metabolite desethyl-desisopropyl atrazine in 3.4%. Glyphosate and AMPA also appear in groundwater, exceeding limits in 2.7% and 2.6% of cases, respectively, along with the herbicide bentazone detected at 48 sites (2.6%). The contamination trend analysis (Figures 6 and 7) indicates a progressive increase in pesticide presence in samples from 2012 to 2021. Detection frequency correlates with increased monitoring efforts (i.e., sample and substance numbers).
In 2021, detection frequency reached 56% in surface waters (Figure 6) and 32.3% in groundwater (Figure 7). The indicator for EQS exceedance frequency (Figure 8) reflects pesticide contamination trends in terms of potential environmental risk, accounting for substance toxicity levels. Surface waters show an upward trend, with a peak of 30.5% in 2020 and a slight decline to 28.5% in 2021. The trend in groundwater is relatively stable, around 5%, with a peak of 6.8% in 2021. This is likely due to the slower dynamics of deeper aquifers.