QUANTITIES OF DANGEROUS SUBSTANCES AND PREPARATIONS IN ESTABLISHMENTS AT RISK OF MAJOR ACCIDENT
Data aggiornamento scheda:
The indicator analyzes the type of substances or categories of dangerous substances/mixtures most widespread in establishments at risk of major accidents, present on the national territory and declared by the managers of establishments subject to Legislative Decree 105/2015. Among the categories of dangerous substances (Annex 1 - part 1 of Legislative Decree 105/2015) most widespread in quantitative terms, those belonging to Section "P" - Physical dangers, in particular flammable liquids, are worth mentioning. Substances that are dangerous for the environment and fall into the "E" hazard category - Dangers for the environment are also very widespread. The regions with the greatest presence of toxic substances are found to be the Sardinia followed by Sicily, Lombardy and Emilia Romagna . While the region where the greatest quantities of flammable substances are present is the Sicily , followed by Friuli-Venezia Giulia , Lombardy and Sardinia . There is a conspicuous presence, distributed throughout Italy, of flammable liquefied gases and natural gases (LPG and methane) and petroleum products.
SAFETY OF CHEMICALS: REACH
Data aggiornamento scheda:
Over the last hundred years, global production of chemicals has increased exponentially, going from 1 million tons in 1930 to several hundred million tons today. The European Union (EU) is the world's second largest producer after China and it is estimated that there are more than 100,000 chemicals on the European market. Italy, with a production value of over 65 billion euros, is the third European producer, after Germany and France, and the tenth globally. There are approximately 2,800 chemical companies active in Italy and they employ over 113,000 people, but the use of chemical products affects all production sectors. European regulation of chemicals is probably the most ambitious in the world, its aim is to ensure a high level of protection of human health and the environment. The main reference standards are the REACH Regulation ( Registration, Evaluation, Authorization and Restriction of Chemicals ) and the CLP Regulation ( Classification, Labeling and Packaging ). Safety in the management of chemical substances is primarily the responsibility of the companies that produce, import or use them. ECHA ( European Chemicals Agency ) and the competent authorities of the EU Member States carry out a control activity on the obligations of companies and can intervene with specific measures if it is demonstrated that the risk of the substances for humans and the environment is not adequately controlled. The indicator, through the monitoring of regulatory processes, provides the elements to evaluate progress in achieving the safety objectives established by the legislation.
ESTABLISHMENTS WITH A RISK OF MAJOR ACCIDENT (PROVINCIAL AND REGIONAL DISTRIBUTION)
Data aggiornamento scheda:
The indicator allows the number of establishments to be identified, by regional and provincial area, divided by category, based on the obligations established by the legislation to which the plant managers are subject. Al november 30, 2025, the total number of establishments considered dangerous for the purposes of a major accident, present in Italy, is equal to 971. As compared to june 2025, where the number of establishments was equal to 932, there is an increase (39 more). Regarding the distribution of the notified establishments throughout the country, the situation remains almost unchanged, around a quarter is concentrated in Lombardy and in regions with a high presence of industries such as: Veneto, Piedmont and Emilia-Romagna . In almost all Italian provinces there is at least one plant at risk of a major accident.
USE AND RISK OF CHEMICAL PLANT PROTECTION PRODUCTS
Data aggiornamento scheda:
The European strategy Farm to Fork sets two objectives to be achieved by 2030, which consist of reducing the use and risk of chemical pesticides by 50% and reducing the use of the most dangerous pesticides by 50%. In order to measure the progress made towards these objectives, two indicators have been defined based on the sales of active substances contained in plant protection products and on the dangerous properties of these substances. The indicators described represent the European and national trend of progress towards the pesticide reduction objectives of the strategy Farm to Fork. In 2023, the use and risk of chemical pesticides, both at European and national level, will be reduced, compared to the reference period 2015-2017, beyond the set target, with decreases corresponding to 58% and 64% respectively. As regards the use of the most dangerous pesticides, however, the trend towards the objective of 50% reduction is slower, in fact in 2023 the European reduction will reach 27%, that of Italy 29%.
MUNICIPALITIES HOSTING ESTABLISHMENTS WITH A MAJOR ACCIDENT HAZARD
Data aggiornamento scheda:
The indicator allows the identification of areas with a particular concentration of establishments at risk of a major accident, providing useful information for territorial planning, in particular for the destination and use of land. In 2025, the municipalities in which there are 4 or more RIR (Major Accident Risk) establishments are 30, distributed in 13 regions: they host approximately a quarter of all the factories at risk of major accidents in Italy. The regions with the largest number of these municipalities are: Lombardy 5, Sicily 4, Lazio 4 and Piedmont 4. Among the municipalities characterized by a high number of establishments, Ravenna is worth mentioning 28, Genoa with 13, followed by Trecate and Venezia con 10, Naples and Filago with 9, Augusta and Catania with 8, Anagni and Livorno with 7 each.
ESTABLISHMENTS WITH A RISK OF MAJOR ACCIDENT (PROVINCIAL AND REGIONAL DISTRIBUTION)
Data aggiornamento scheda:
The indicator analyzes the distribution across the national territory of all industrial activities according to the categories defined in Legislative Decree 105/2015 for establishments at risk of a major accident. The analysis of the types of factories allows us to define, albeit in a qualitative way, a mapping of the industrial risk in our country. The legislation divides establishments into 38 activity categories plus a thirty-ninth category (other) including all activities not included in the previous ones, on the basis of the NACE code, a general classification system used to systematise and standardize the definitions of economic/industrial activities in the various member states of the European Union. In particular, on the date of november 30, 2025, it appears that the total number of establishments at risk of a major accident is equal 971, with an increase compared to june 2025 of 39 units. As regards the type of activities present on the national territory, there is a prevalence of deposits of "(14) LPG storage”1st and “(22) chemical plants”2nd . The so-called follow "(39) Other activities, unspecified"3rd , the factories of “(13) production, bottling and wholesale distribution of liquefied petroleum gas (LPG)”4th and the deposits of “(10) Storage of fuels (including for heating, retail etc.)”5th . Together these constitute approximately 50% of the total establishments. The deposits follow "(16) Wholesale and retail storage and distribution (excluding LPG)"6th , the systems of “(07) treatment of metals by electrolytic or chemical processes”7th , systems "(19) production of pharmaceutical products"8th and of “(38) manufacture of chemical substances (not otherwise specified in the list)”9th, of "(11) production, destruction and storage of explosives”10th . Followed by the systems “(17) production and storage of pesticides, biocides and fungicides” 11th and those of “(20) storage, treatment and disposal of waste” 12th .
WATER QUALITY – PESTICIDE POLLUTION
Data aggiornamento scheda:
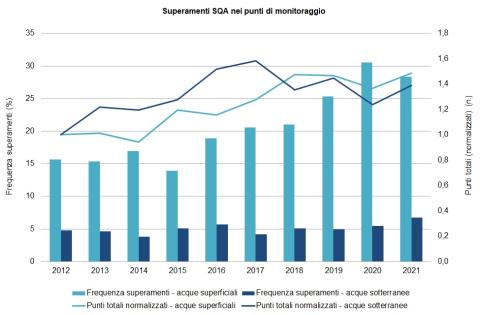
The indicator allows for the assessment of surface and groundwater contamination by pesticide residues released into the environment. Monitoring pesticide presence in water is complex due to the number of substances involved and their diffuse use. Measured levels are compared with the concentration limits established by current regulations. The presented indicators provide an analysis of the evolution of contamination over the 2012–2021 decade, in terms of the frequency of pesticide detection in water, as well as the environmental risks arising from their use. Data from 2021 confirm a state of contamination already reported in previous years, with exceedances of legal limits particularly in surface waters (28.3% of monitoring points); in groundwater, 6.8% of points exceed regulatory limits.