Panel 1
Daniela Romano
The indicator represents the trend of national emissions of particulate matter (PM2.5) by source sector from 1990 to 2022, highlighting a significant overall reduction over the years (-39%). The road transport sector, which contributes 9.3% of total emissions in 2022, shows a 75% decrease over the entire period. Emissions from non-industrial combustion, during the same period, increased by almost 38%, making it the most significant sector in 2022, accounting for 63.8% of total emissions.
Particulate matter with a size smaller than 2.5 µm consists of airborne particles of such size that, once inhaled, they penetrate deeply into the human respiratory system. Like PM10, PM2.5 is partially emitted directly into the atmosphere from sources (primary PM2.5) and partially formed through chemical reactions between other pollutants (secondary PM2.5). The direct emission of PM2.5 is associated with all combustion processes, particularly those involving the use of solid fuels (coal, wood) or liquid fuels such as diesel and fuel oil. Fine particles are thus emitted from road transport, energy production plants, domestic heating systems, and forest fires. The estimates provided are for primary emissions only, while secondary emissions, as well as those caused by the resuspension of dust deposited on the ground, are not calculated.
Assessing the temporal trend of PM2.5 (particulate matter with a size less than 2.5 µm) emissions disaggregated by sector is essential for monitoring the effectiveness of emission reduction regulations, with particular attention to urban areas.
As part of the UNECE Convention on Long-Range Transboundary Air Pollution (CLRTAP), Italy is required to annually update and communicate its national air pollutant emission inventory, which includes, among other pollutants, PM2.5. The national regulatory framework for air protection and atmospheric emission reduction is set out in Legislative Decree No. 152/2006 of April 3, 2006 ("Environmental Standards", Part V). This Decree was later updated by Legislative Decree No. 128/2010 and further amended following the enactment of Legislative Decree No. 46 of March 4, 2014, concerning industrial plants. Several regulations limit particulate emissions in specific sectors, particularly in road transport and industry. For stationary sources, Directive 2010/75/EU establishes emission limit values for particulate matter from solid, liquid, and gaseous fuels in large combustion plants. For medium-sized combustion plants, Directive (EU) 2015/2193 also sets standards for air emissions control to reduce potential risks to human health and the environment. Regarding mobile sources, the most recent measures concerning particulate material emissions come from Regulation EC 715/2007, which deals with the approval of motor vehicles concerning emissions from light-duty passenger and commercial vehicles (Euro 5 and Euro 6), and Regulation EC 595/2009, which concerns the approval of motor vehicles and engines for emissions from heavy-duty vehicles (Euro VI). The new NEC Directive 2016/2284 of the European Parliament and Council (transposed by Legislative Decree No. 81/2018) addresses the reduction of national emissions of certain air pollutants, setting national reduction commitments for the period 2020-2029 and from 2030 onwards, with respective targets of a 10% and 40% reduction compared to 2005 levels.
Panel 2
Cóndor R., De Lauretis R., Romano D., Vitullo M., 2008. Inventario nazionale delle emissioni di particolato e principali fonti di emissione. In: Atti 3° Convegno Nazionale sul Particolato Atmosferico. Il particolato atmosferico: la conoscenza per l’informazione e le strategie di intervento Bari 6-8 Ottobre, Italia.
De Lauretis R., Gaudioso D., Gonella B., Romano D., 2006. Inventario delle emissioni in atmosfera di PM10 e strategie di riduzione, XXII Congresso Nazionale della Società Chimica Italiana, Firenze, 10-15 Settembre 2006, Atti del Congresso.
ISPRA, anni vari. Dati e pubblicazioni disponibili su: https://emissioni.sina.isprambiente.it/inventario-nazionale/ISPRA, 2023.
La disaggregazione a livello provinciale dell’inventario nazionale delle emissioni. Disponibile su http://www.isprambiente.gov.it/it/pubblicazioni/rapporti ISPRA, 2010.
ISPRA, De Lauretis R. et al., Trasporto su strada Inventario nazionale delle emissioni e disaggregazione provinciale, Rapporti - N. 124 /2010.
Italian Emission Inventory 1990-2022. Informative Inventory Report 2024 (https://www.isprambiente.gov.it/it/pubblicazioni/rapporti; https://www.ceip.at/status-of-reporting-and-review-results/2024-submission).
Data quality assessment
ISPRA (Italian National Institute for Environmental Protection and Research)
https://emissioni.sina.isprambiente.it/inventario-nazionale/
National
1990-2022
Indicator assessment
Estimation calculated within the framework of the preparation of the national air emissions inventory. For air pollutants, the methodology used is that outlined by the European Environment Agency (EMEP/EEA Air Pollutant Emission Inventory Guidebook 2019). For the description of the estimation methodology, reference is made to the Informative Inventory Report – IIR (https://www.isprambiente.gov.it/it/pubblicazioni/rapporti/inventario-nazionale-emissioni-1990-2022-informative-inventory-report-2024; https://www.ceip.at/status-of-reporting-and-review-results/2024-submission).
The PM2.5 emission levels in 2022 are 144 kt, remaining below the target set for 2020-2029 (164 kt, a 10% reduction compared to 2005 levels) (Figure 1).
National PM2.5 emissions decreased by 39% from 1990 to 2022, showing a positive environmental trend (Table 1). Despite the overall decreasing trend, a detailed sectoral analysis reveals some increases, particularly in emissions from non-industrial combustion, which grew by almost 38% between 1990 and 2022, due to the rise in wood combustion in residential heating systems. In 2022, this sector is the most significant, accounting for 63.8% of total emissions.
Data
Table 1: National Emissions of PM2.5 by Source Sector
ISPRA
A: Combustion in energy and industrial transformation
B: Non-industrial combustion
C: Industrial combustion
D: Production processes
E: Fossil fuel extraction and distribution / Geothermal energy
F: Use of solvents
G: Road transport
H: Other mobile sources
I: Waste treatment and disposal
L: Agriculture
The emission values have been updated in accordance with the annual revision of the National Air Emission Inventory.
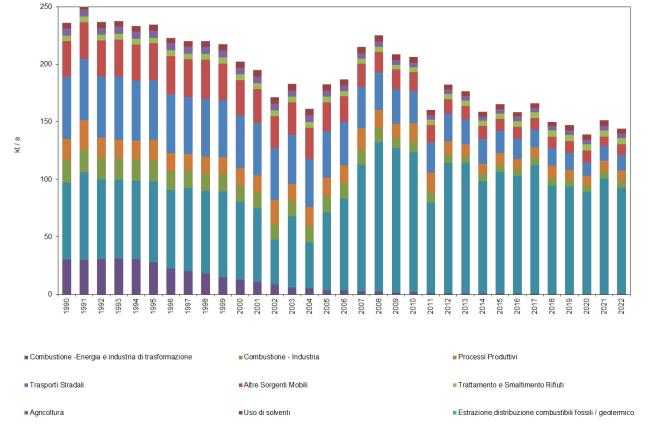
Figura 1: Emissioni nazionali di PM2.5 per settore di provenienza
ISPRA
I valori di emissione sono stati aggiornati coerentemente con l'aggiornamento annuale dell'inventario nazionale delle emissioni.
National emissions are calculated in accordance with the estimation methodology adopted at the European level, as outlined in the EMEP/EEA Air Pollutant Emission Inventory Guidebook – 2019. The totals exclude emissions from natural sources (other emission sources and sinks) in line with the classification used in the national emission inventory. Between 1990 and 2022, the road transport sector saw a reduction of 75%, contributing approximately 9.3% to total emissions in 2022. Emissions from non-industrial combustion, on the other hand, increased by 37.5%, while other combustion processes recorded significant reductions in particulate emissions. In particular, emissions from combustion for energy production and in the transformation industry decreased by 98.4%, accounting for only 0.3% of total emissions in 2022, compared to an average of around 13% up to 1995. Emissions from combustion processes in industry decreased by 67.2%, reaching 4.5% of total emissions in 2022. The reductions observed in the energy and industry sectors are mainly due to the introduction of two regulatory instruments: DPR 203/88, which establishes the rules for plant authorization, and the Ministerial Decree of July 12, 1990, which sets emission limits for facilities. In 2022, emissions from agricultural activities, production processes, and other mobile sources accounted for 2.5%, 6.1%, and 6.4% of the total, with reductions from 1990 of -40.7%, -51.6%, and -70.5%, respectively. Emissions related to waste treatment and disposal increased by 18.6% since 1990, reaching 3.9% of total emissions in 2022 (Table 1, Figure 1).