Daniela Romano
The indicator represents, over the period 1990-2023, the trend of greenhouse gas emissions in Italy per capita and relative to GDP. A decrease is observed for both, accentuated by the growth of the population and GDP, which highlights a decoupling between drivers and pressures.
The indicator is calculated by relating national greenhouse gas emissions to the resident population in Italy, as well as to the national gross domestic product (GDP) at current market prices.
Assessing the temporal trends in greenhouse gas emissions per capita and relative to GDP
United Nations Framework Convention on Climate Change (UNFCCC) 1992
Kyoto Protocol 1997
Law 65/1994
CIPE Resolution 123/2002
Law 120/2002
Law 316/2004 (Conversion into law, with amendments, of Decree-Law no. 273/2004, containing urgent provisions for the implementation of Directive 2003/87/EC on the emissions trading scheme for greenhouse gases in the European Community)
Legislative Decree 51/2008
"Effort Sharing" Decision 406/2009/EC
Legislative Decree 30/2013
EU Regulation 525/2013
Legislative Decree 111/2015
Paris Agreement 2015
Law 79/2016
EU Regulation 842/2018
EU Regulation 1999/2018
EU Directive 2001/2018
ISPRA, anni vari. Italian Greenhouse Gas Inventory, National Inventory Report (https://www.isprambiente.gov.it/it/pubblicazioni/rapporti)
Nessuna
Nessuna
(http://emissioni.sina.isprambiente.it/inventario-nazionale/) e i dati Istat sulla popolazione e sul PIL (http://demo.istat.it e /http://dati.istat.it/).
National
1990 - 2023
The indicator represents the trend of greenhouse gas emissions in Italy per capita from 1990 to 2023, derived by relating the emission data officially reported by ISPRA to the resident population data as of January 1st, published by ISTAT (Intercensal Population Reconstruction), and the trend of greenhouse gas emissions relative to the GDP at market prices, with values chained to the reference year 2015, published by ISTAT. The indicators are presented as index numbers with a fixed base (1990 = 100).
In 2023, national greenhouse gas emissions amounted to approximately 385 million tonnes of CO₂ equivalent. In the same year, the Gross Domestic Product (GDP) was equal to €1,917,249 million, resulting in an emissions intensity of 200.7 tonnes of CO₂ equivalent per million euros of GDP. As of 1 January 2024, the resident population was 58,989,749 inhabitants, corresponding to per capita emissions of 6.5 tonnes of CO₂ equivalent (Table 1 and Table 2).
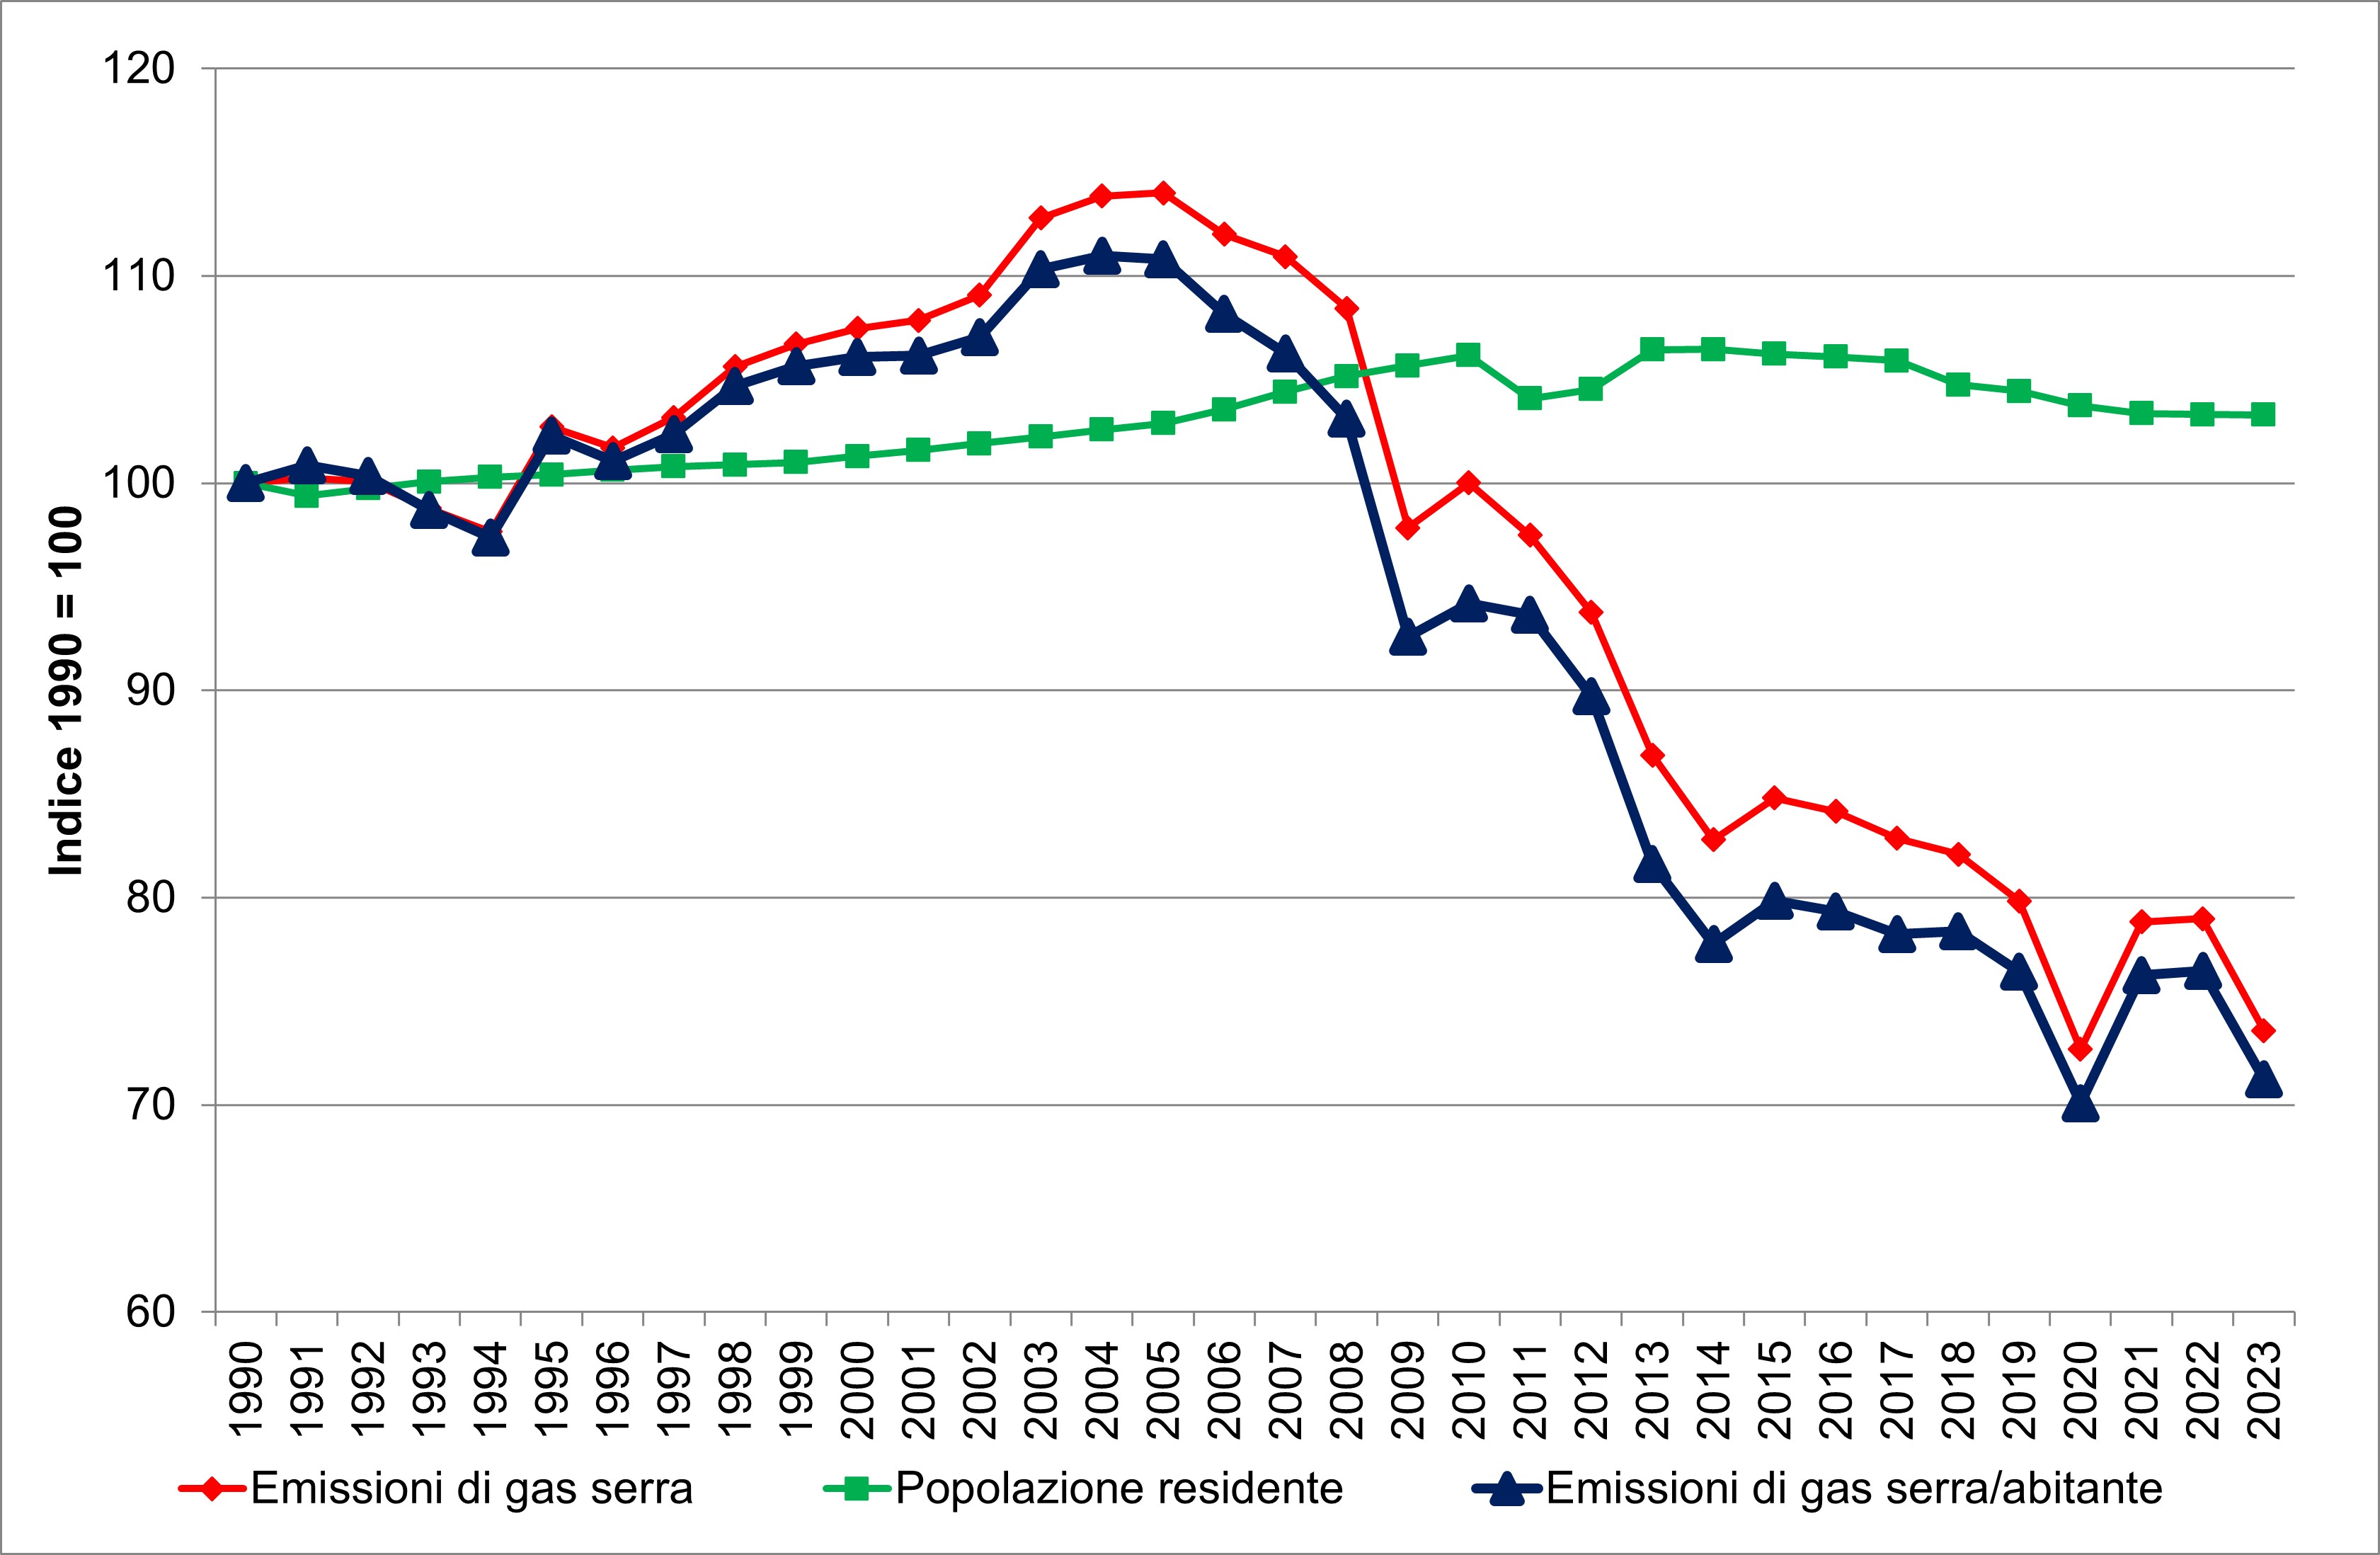
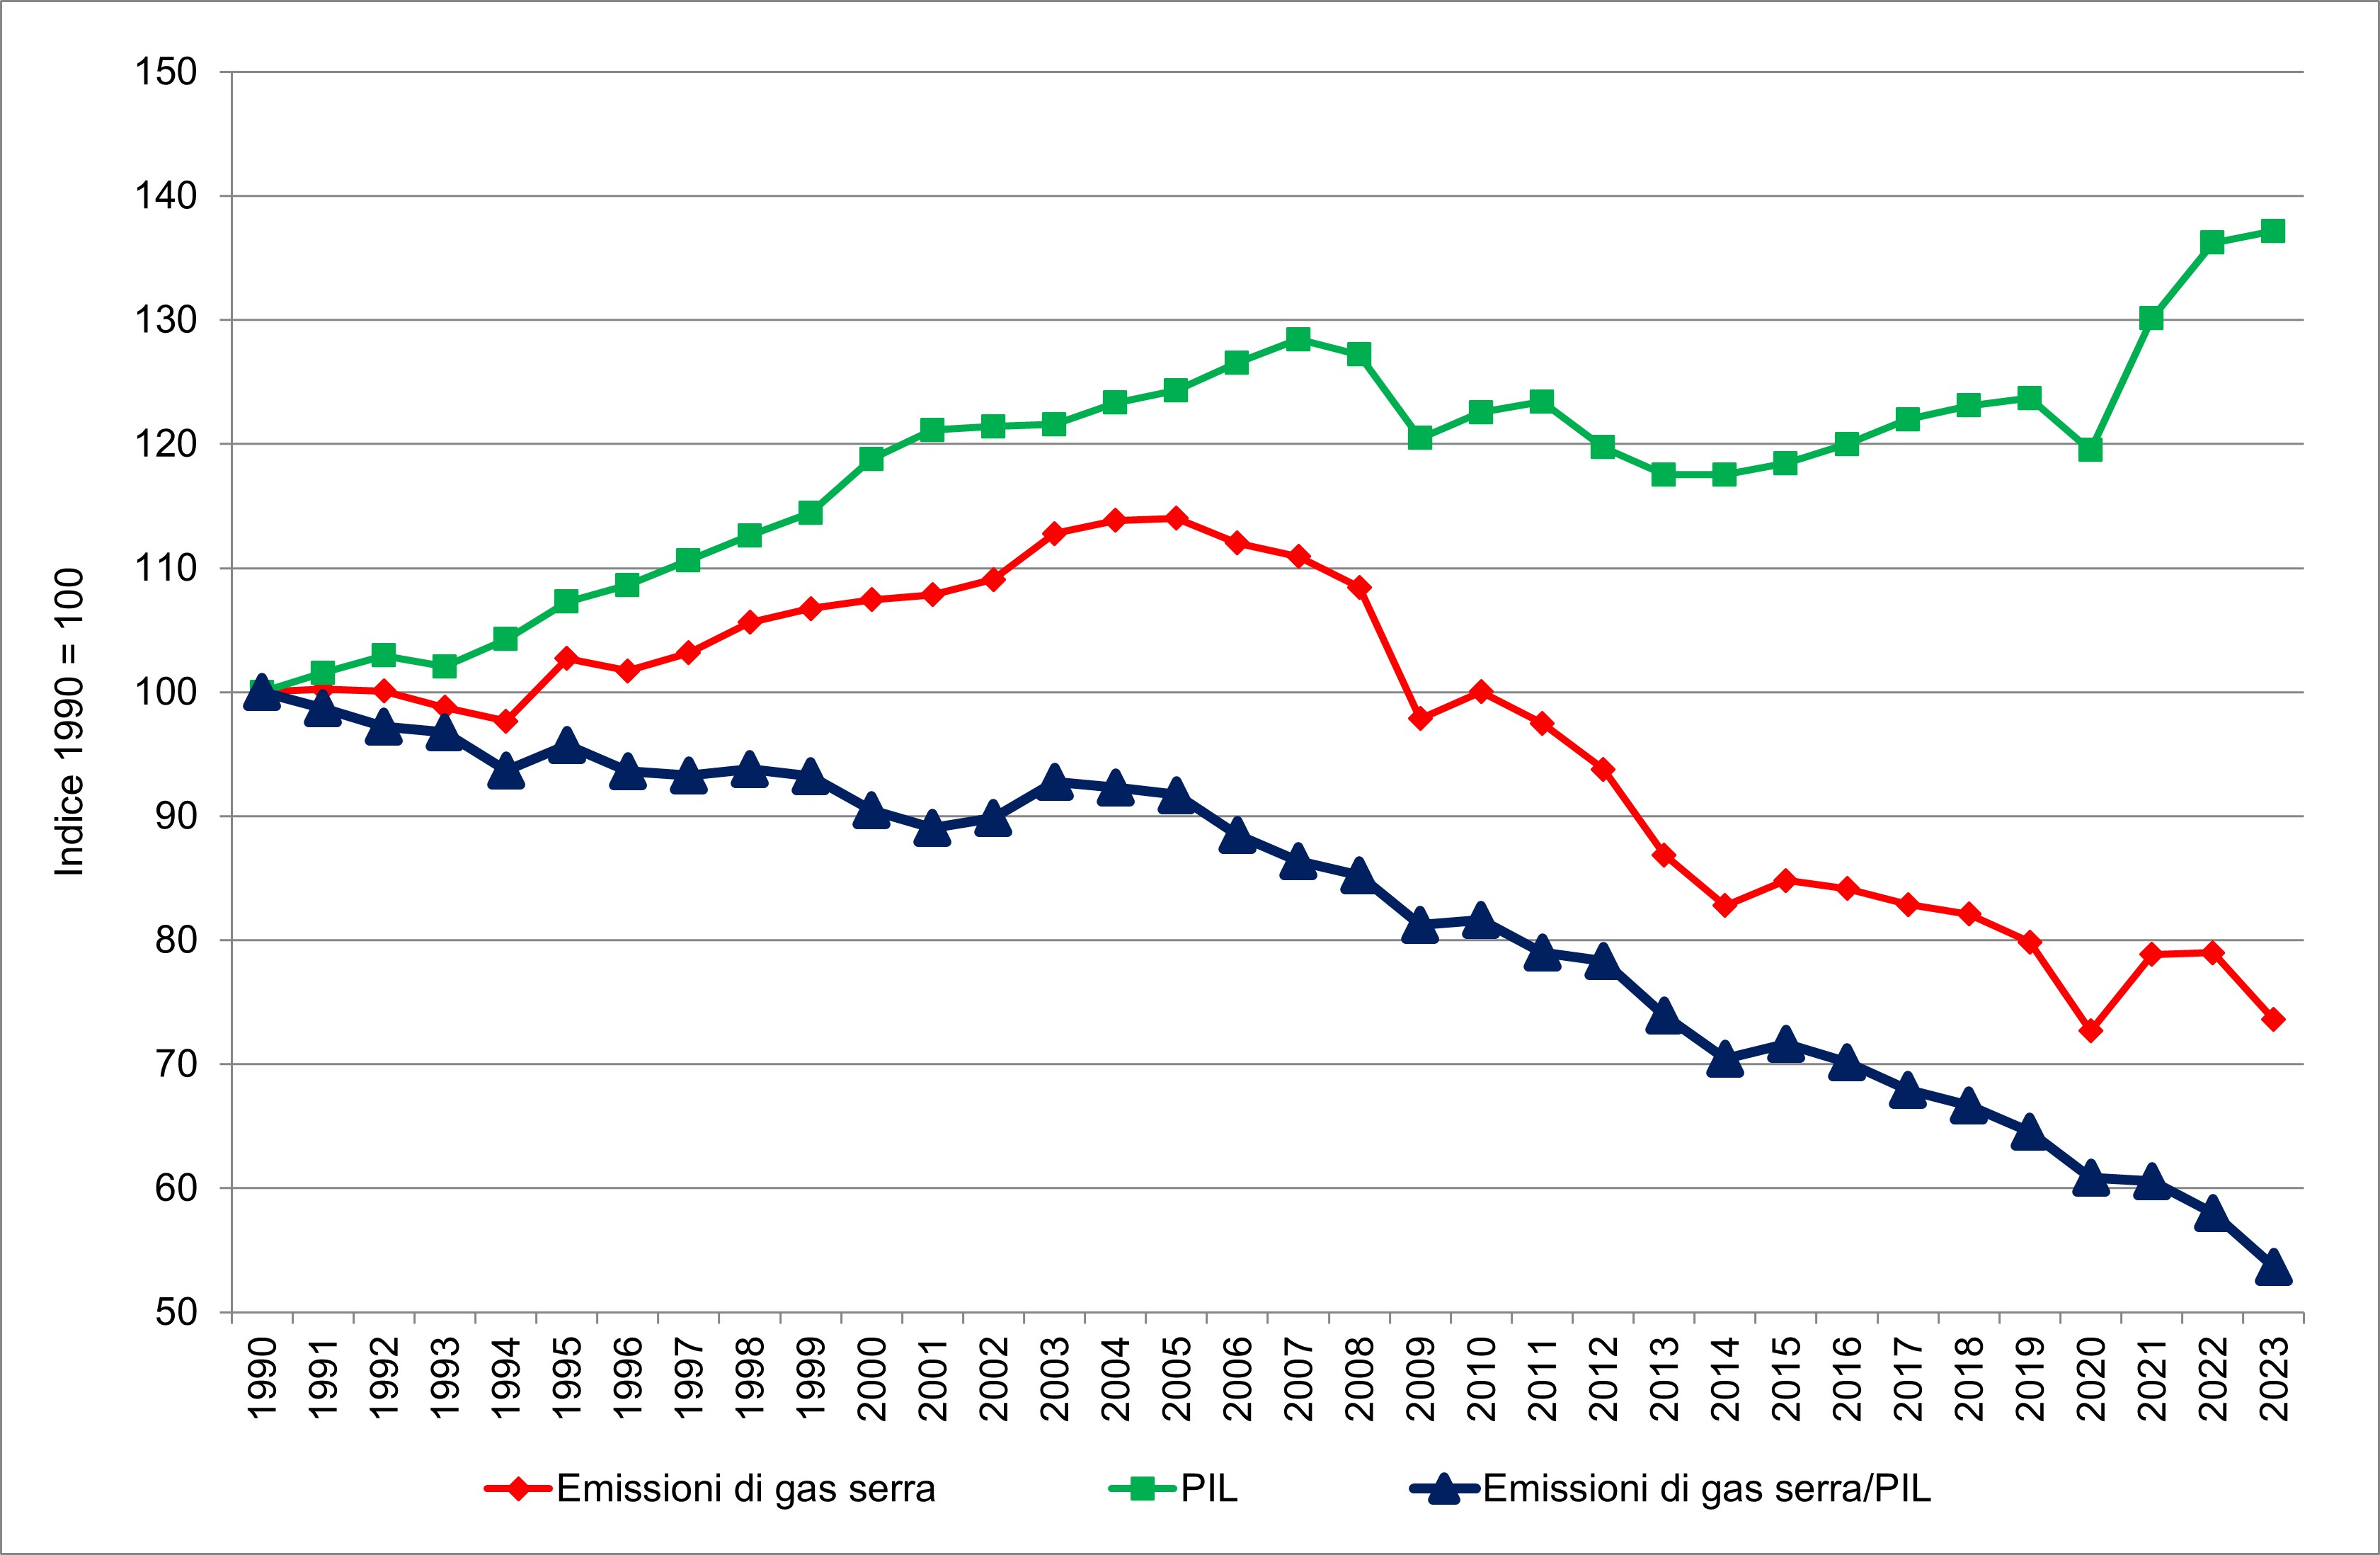
Between 1990 and 2023, national greenhouse gas emissions decreased by approximately 26%. Over the same period, the resident population increased by 3.3%, resulting in a 28.8% reduction in per capita emissions, thereby indicating a decoupling between the driving force and the environmental pressure (Table 1 and Figure 1). A similar trend is observed with respect to GDP, which grew at a significantly higher rate than the population (+37.2%), while greenhouse gas emissions per unit of GDP decreased by more than 46% (Table 2 and Figure 2).
| Data |
|---|
Headline
Table 1: Greenhouse gas emissions per capita in Italy Data source
Processing by ISPRA based on emissions data (ISPRA) and resident population data (Istat) |
Headline
Table 2: Greenhouse gas emissions relative to GDP in Italy Data source
Processing by ISPRA based on emissions data (ISPRA) and GDP data (Istat) |
Thumbnail
Headline
Figure 1: Greenhouse Gas Emissions per Capita (Index, base year 1990 = 100) Data source
Processing by ISPRA based on emissions data (ISPRA) and resident population data (Istat) |
Thumbnail
Headline
Figure 2: Greenhouse Gas Emissions Relative to GDP (Index, base year 1990 = 100) Data source
Processing by ISPRA based on emissions data (ISPRA) and GDP data (Istat) |
The indicator, which reflects greenhouse gas emissions per capita and in relation to GDP, highlights national progress towards a low-carbon, green, and competitive economy based on efficient resource use. It shows significant reductions both in relation to population (–28.8%) (Table 1 and Figure 1) and GDP (–46%) (Table 2 and Figure 2).