GREENHOUSE GAS EMISSIONS FROM TRANSPORT
Data aggiornamento scheda:
The indicator evaluates greenhouse gas emissions produced by the transport sector to verify the achievement of national and international objectives. In 2024 in Italy, transport is responsible for 31.2% of total greenhouse gas emissions. In the period 1990 - 2019, emissions from the transport sector (excluding international transport/bunkers) grew by 4.0%; in 2020 there was a marked reduction (-18.6% compared to 2019) fundamentally attributable to the mobility restriction measures due to the pandemic crisis, subsequently, from 2020 to 2021, there was an increase in emissions equal to 18.9%. From 2022 there will be a return to pre-pandemic levels. Overall, sector emissions from 1990 to 2024 increase by 10.9%. Various critical issues characterize the national transport system, which is far from the ambitious 2030 and 2050 objectives for reducing greenhouse gas emissions at a European level.
SHARE OF THE VEHICLE FLEET COMPLYING WITH CERTAIN EMISSION STANDARDS
Data aggiornamento scheda:
The indicator delves into the percentage distribution of the vehicle fleet circulating in Italy based on European emission standards (Euro classes) updated to 2024, highlighting the level of technological obsolescence and the environmental impact of the different categories of road vehicles. It constitutes a fundamental tool for evaluating the effectiveness of fleet renewal policies and for calculating the national inventory of climate-altering and polluting emissions into the atmosphere. In 2024, for Euro 0 cars there is a 13.4% share of petrol vehicles and 2.9% of diesel cars. More worrying is the situation of the commercial fleet, largely with diesel engines, where 10% of light vehicles (vans) and 24.9% of heavy vehicles remain in the Euro 0 class.
The penetration of cleaner technologies and zero or low emission vehicles varies significantly depending on the type of engine and intended use of the vehicle. While on the one hand the latest generation electrified and hybrid fuel systems show a strong concentration in the most advanced emission standards, at the same time there remains a non-negligible share of historic or traditionally fueled vehicles (especially petrol) belonging to the most obsolete environmental classes, such as Euro 0. This phenomenon highlights the persistence of an older fleet segment which slows down the overall process of decarbonisation of transport.
TAXATION IN TRANSPORT
Data aggiornamento scheda:
The indicator allows us to evaluate to what extent taxation levels correspond to external costs and favor the use of cleaner products, to move towards a pricing system that better incorporates environmental costs. With regard to the fiscal taxes applied in European states, in May 2026, Italy was in third place for petrol (50% incidence) and in first place for automotive diesel (47% incidence). Petrol is taxed at 53% by Greece, Finland and the Netherlands and 52% by Estonia and Ireland. The European Union average for petrol is 46% while for diesel it is 40%.
EXPENSES FOR PERSONAL MOBILITY
Data aggiornamento scheda:
The indicator evaluates the extent and evolution of Italian families' spending on transport, analyzing whether this item has a fixed or variable impact on the overall family budget. In 2024, the average monthly expenditure on transport stood at 297.22 euros. Comparing this data with 2015, two different weights can be seen depending on the prices considered: at current prices there is a decrease of around 12%, while at constant prices an increase of 10%. The evolution of spending in the last decade clearly shows the impact of socioeconomic events: in the period 2015-2018 there was a phase of constant growth, with an increase of 10%. In 2019 there was a first sign of a reversal of the trend, with a slight reduction, followed the following year by the vertical collapse of mobility and a 25% contraction in spending. In the last period (2021-24) there is a progressive recovery, even if the full return to pre-pandemic levels was only achieved in 2024. The negative peak of 2020 spared very few sectors: all expenditure items suffered a contraction, with the exception of food products, which remained constant during the pandemic and grew progressively in the following years. In the budget of Italian families, transport spending is consolidated as the second most important cost item. However, spending on housing and utilities remains firmly in first place, the economic value of which exceeds that for mobility by more than three times.
SIZE OF THE VEHICLE FLEET
Data aggiornamento scheda:
This indicator measures the quantitative consistency and evolution of the road vehicle fleet in Italy by relating it to the resident population - through parameters such as vehicles per inhabitant - in order to measure the size of a fleet which constitutes an important factor of environmental pressure. According to Eurostat, Italy has the highest vehicle fleet among the European Union countries in relation to the population. In 2024, the number of cars per thousand inhabitants is 701 (exceeded only by Liechtenstein which is not a member of the European Union). The fleet circulating on the road is characterized by growth over the years mainly driven by the passenger car sector
EMISSIONS OF AIR POLLUTANTS FROM TRANSPORT
Data aggiornamento scheda:
The indicator allows the emissions of the main air pollutants produced by the transport sector to be assessed. In Italy, harmful emissions produced by road transport have decreased significantly in recent years, thanks to the introduction of catalytic converters, fine particulate filters and other technologies installed in vehicles. From 1990 to 2024, emissions from total transport of non-methane volatile organic compounds will be reduced by 87.4%, nitrogen oxide emissions by 71.6% and fine particulate matter emissions by 69.6%. Sulfur oxide emissions, now almost absent in road transport, are still significant in sea transport. Polluting emissions into the atmosphere are monitored at a national level for the purpose of verifying compliance with the reduction commitments imposed at European level, with the aim of achieving air quality levels that do not entail significant negative impacts and significant risks for human health and the environment.
TRANSPORT PRICES
Data aggiornamento scheda:
The indicator describes the dynamics of transport prices (passengers and goods), highlighting the evolution over time of this important determinant of transport demand and its modal split. The average national consumer prices of petroleum products used for transport, expressed as annual average values, in the period 2000-2025 show considerable increases: approximately 60% for petrol, approximately 85% for automotive diesel, approximately 32% for automotive LPG. For 2025 there is a countertrend compared to the previous year with reductions, respectively, of 5.4% and 1% for the three types of petroleum products considered.
PASSENGER TRANSPORT DEMAND AND INTENSITY
Data aggiornamento scheda:
The indicator measures passenger transport demand (according to different modes) and compares its trend with that of economic growth and population. Transport demand is increasingly met by individual road transport (passenger cars and motorcycles), which, due to its growth and modal share (approximately 79% in 2024), remains dominant compared to other transport modes.
TRANSPORT INFRASTRUCTURE NETWORK CAPACITY
Data aggiornamento scheda:
This indicator monitors the development of transport infrastructure networks. Between 1990 and 2023, 1.376 km of new motorways were constructed in Italy (+22.2%). As of 2023, Italy ranks eighth in the world for operational high-speed rail network length, according to the International Union of Railways (UIC).
FREIGHT TRANSPORT DEMAND AND INTENSITY
Data aggiornamento scheda:
The indicator evaluates the demand for freight transport (also in relation to economic growth) and the evolution over time of modal split. The transport demand is increasingly met by road freight transport, which continues to dominate other transport modes in terms of growth and modal share (approximately 59% in 2024).
SPECIFIC CO₂ EMISSIONS
Data aggiornamento scheda:
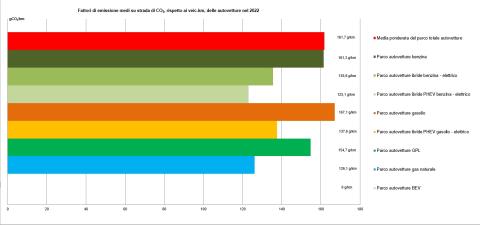
The indicator allows the evaluation of the trend of specific carbon dioxide emissions of the circulating car fleet through the comparison between the values resulting from type-approval procedures and the values deriving from the actual use of vehicles on the road. It is also useful for the monitoring of carbon dioxide emissions of the circulating car fleet in relation to compliance with the voluntary agreements between the European Commission and the automotive industry. Since 2001, the year in which the Civil Motorization began to monitor the specific emissions of the newly registered fleet, these emissions have been decreasing and are in any case significantly lower than the estimates of real on-road emissions, showing a gap between type-approval data and real-world data.
SPECIFIC EMISSIONS OF NMVOC, NOX AND PM
Data aggiornamento scheda:
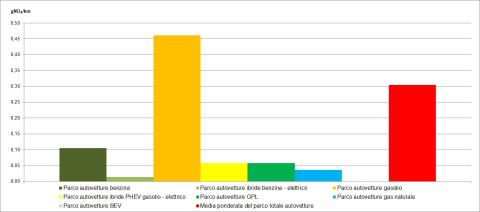
Stricter emission standards, the introduction of new technologies into the market—such as the installation of catalytic converters in vehicles—and improvements in fuel quality have led to significant reductions in the specific emissions of various pollutants from passenger cars and trucks; however, these improvements have been partially offset by the increase in traffic.
TRANSPORT ACCIDENT RATES
Data aggiornamento scheda:
The indicator determines mortality and severity rates associated with different transport modes, to inform policies for enhancing transport safety. In Italy during 2023, 166,525 road accidents involving personal injuries were recorded, resulting in 3,039 fatalities and 224,634 injuries. Compared to 2022, the number of road accidents increased by 0.4%, while fatalities and injuries showed a decrease of -3.8% and an increase of 0.5%, respectively.