Antonella Bernetti, Francesca Palomba
In Italy, the use of low environmental impact fuels is more widespread compared to other European countries.
This result has been facilitated by factors such as partial exemption from excise duties for these fuels and the allowance for vehicles powered by liquefied petroleum gas (LPG) and natural gas to circulate in urban areas during traffic restriction periods.
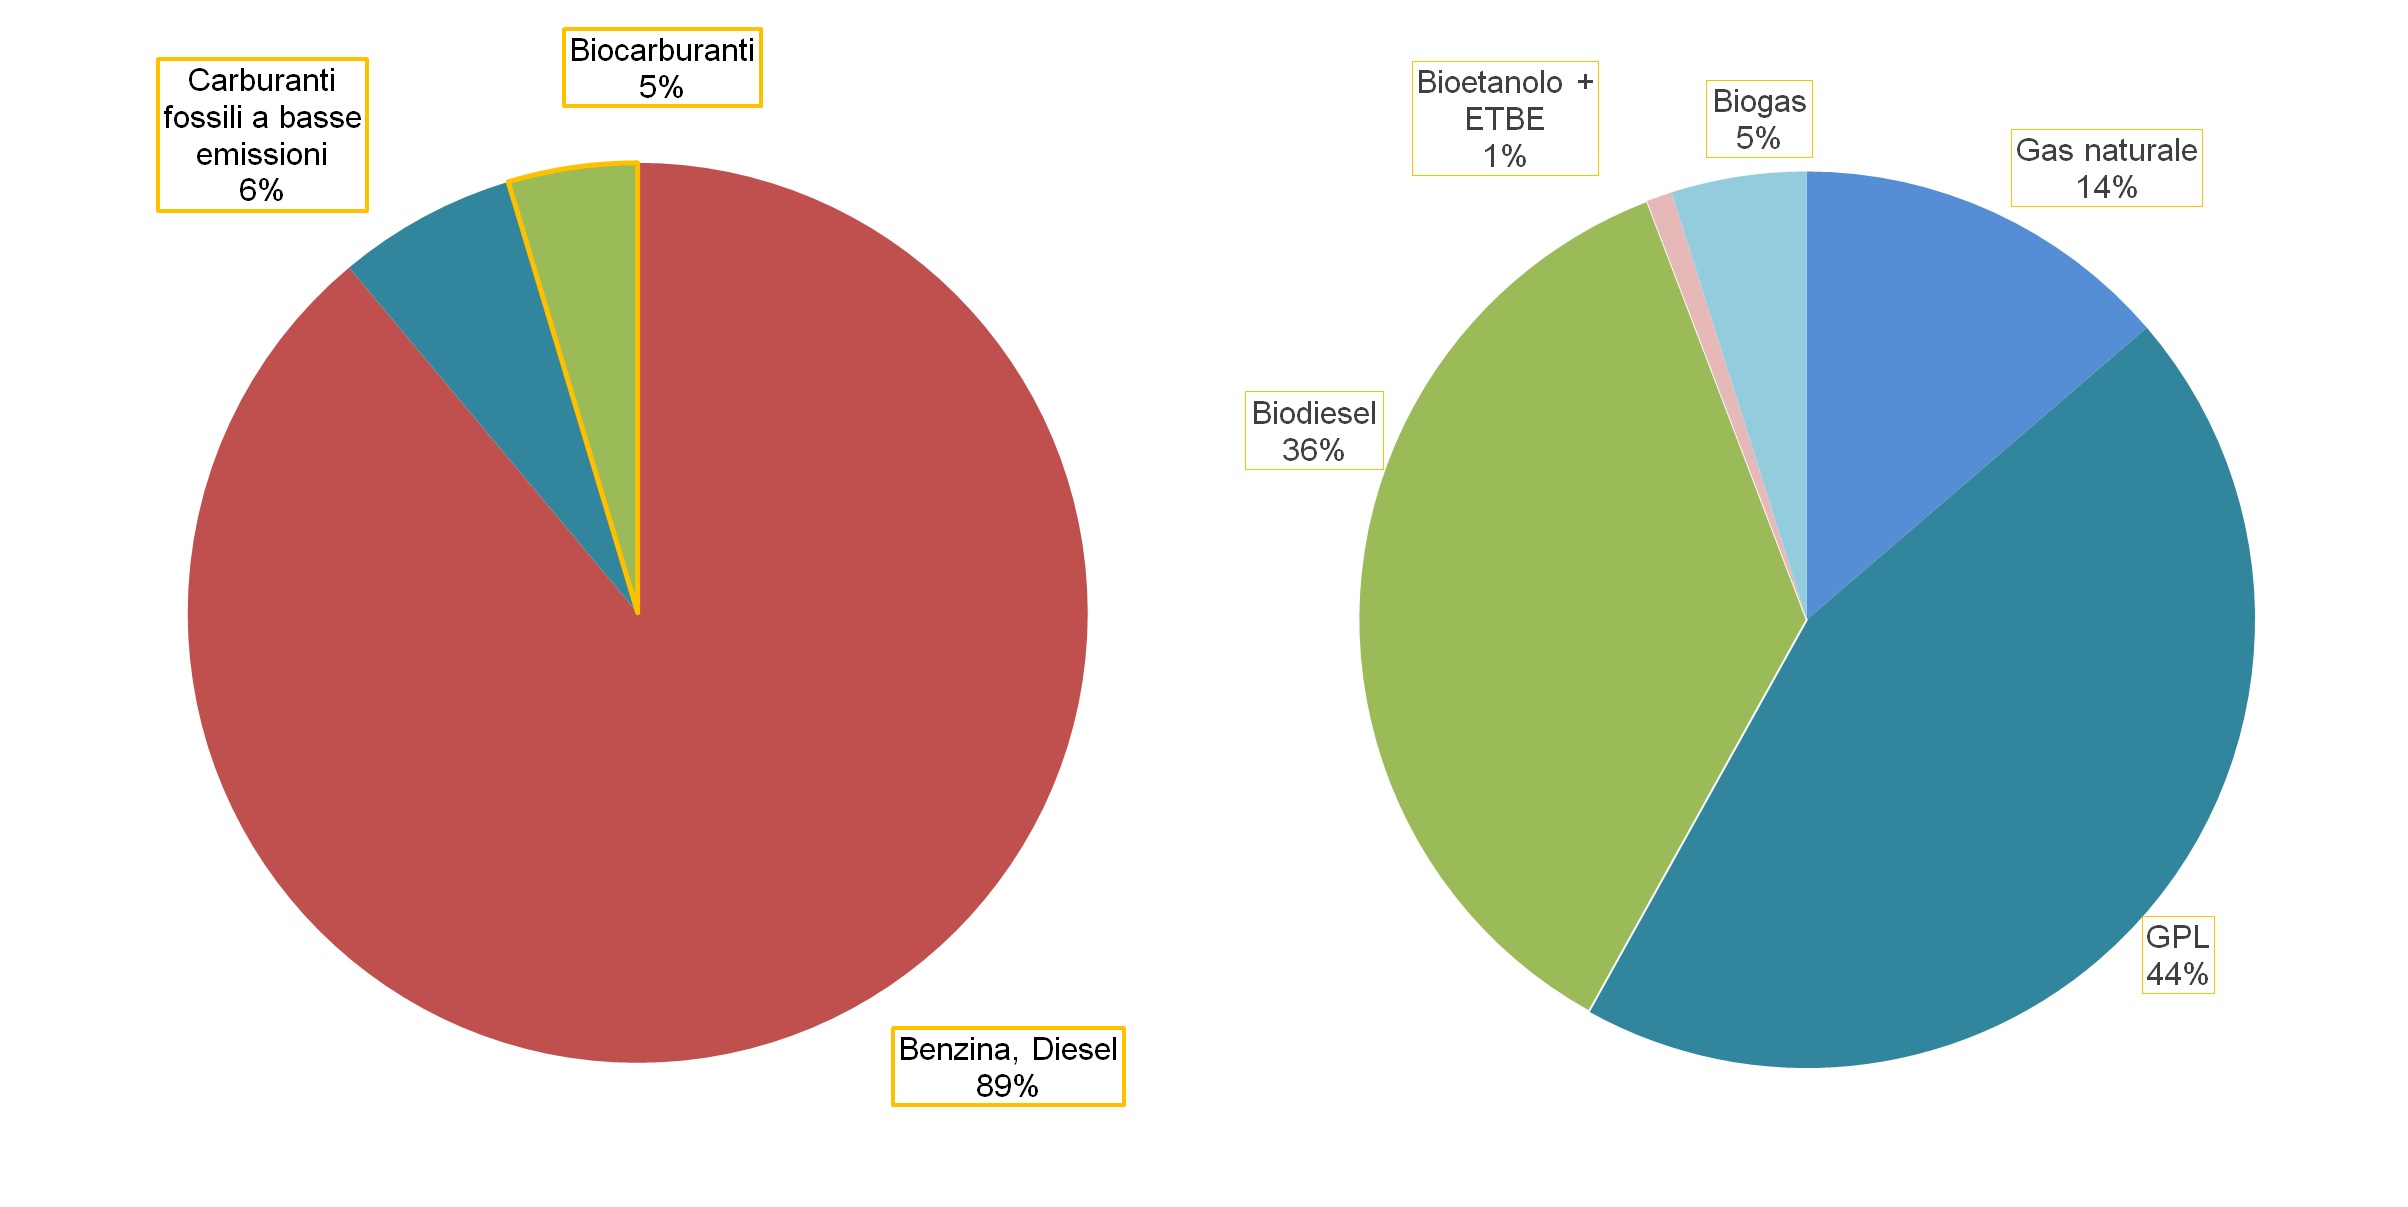
Nevertheless, the use of low-impact fuels (of which biofuels account for 42,2%) remains limited. In 2023, they represented only 11% of total road fuel consumption: 6% from low-emission fossil fuels and 5% from biofuels, while gasoline and diesel still accounted for 89% of the total.
The indicator measures the penetration of low environmental impact fuels and biofuels in the transport sector. These fuels include: natural gas; liquefied petroleum gas (LPG); biodiesel (derived from oilseed crops such as rapeseed or sunflower); bioethanol (produced from sugar- or starch-rich crops such as sugar beets, cereals, and sugarcane, and more recently, second-generation bioethanol produced from pilot plants using lignocellulosic waste); and biogas (obtained through the anaerobic fermentation of organic substances of animal or plant origin).
The increased use of biofuels is one of the key objectives of the EU climate and energy package.
Misurare il livello di penetrazione dei carburanti meno inquinanti, al fine di favorirne la diffusione.
Directive 2003/30/EC encouraged Member States to achieve, by 2010, a 5.75% share of biofuels in the total amount of fuels placed on the market, on an energy content basis. This directive was subsequently superseded by Directive 2009/28/EC on the promotion of the use of energy from renewable sources, which required each Member State to ensure that, by 2020, a minimum 10% share (also on an energy basis) of diesel, gasoline, and electricity used in road transport would come from renewable sources. Directive 2009/28/EC was later repealed by Directive (EU) 2018/2001 on the promotion of the use of energy from renewable sources.
The White Paper on Transport set the targets of halving the use of conventionally-fuelled cars in urban transport by 2030 and phasing them out completely by 2050, as well as establishing, by 2030, urban logistics systems with zero CO₂ emissions in major cities. For the aviation sector, it set a 2050 target of a 40% share of low-carbon sustainable fuels, while for maritime transport it aimed to reduce CO₂ emissions from bunker fuels used in the EU by 40% (and, if feasible, by 50%) by 2050.
Directive 2009/30/EC on fuel quality required at least a 6% reduction by 2020 in the greenhouse gas intensity of transport fuels. Together with Directive 2009/28/EC on renewable energy, it also established criteria for the sustainability of biofuels.
The 2030 Climate and Energy Framework sets EU-wide policy targets for the period 2021–2030. The key targets for 2030 include: at least a 40% reduction in greenhouse gas emissions compared to 1990 levels; at least a 32% share of renewable energy; and at least a 32.5% improvement in energy efficiency. The framework was adopted by the European Council in October 2014, and the targets for renewable energy and energy efficiency were revised upward in 2018.
Directive (EU) 2018/2001 establishes a common framework for the promotion of energy from renewable sources and sets an overall binding target. Member States are collectively required to ensure that the share of energy from renewable sources in the Union’s gross final energy consumption reaches at least 32% by 2030. To this end, they must set national contributions as part of their integrated national energy and climate plans, in accordance with Regulation (EU) 2018/1999.
The European Green Deal (European Commission, 2019) calls for accelerating the transition toward smart and sustainable mobility. Among its climate neutrality targets for 2050 is the scaling up of the production and deployment of sustainable alternative fuels in the transport sector.
The target for 2030 assigned to Italy by the Integrated National Energy and Climate Plan (NECP), submitted to the European Commission in July 2024, calculated using the methodology set out in Directive (EU) 2023/2413 (RED III), is 34.2%.
(a) European Commission, Communication from the Commission to the European Parliament, the Council, the European Economic and Social Committee and the Committee of the Regions – *"A Roadmap for Moving to a Competitive Low-Carbon Economy in 2050"*, COM(2011) 112, 8.3.2011.
(b) European Commission, White Paper – "Roadmap to a Single European Transport Area – Towards a Competitive and Resource-Efficient Transport System", COM(2011) 144, 28.3.2011.
(c) European Commission, Energy Roadmap 2050, COM(2011) 885/2.
(d) European Commission, White Paper on the Future of Europe – Reflections and Scenarios for the EU27 by 2025, COM(2017) 2025, 1 March 2017.
(e) European Commission, The European Green Deal, COM(2019) 640 final.
(f) EEA (European Environment Agency), Monitoring CO₂ Emissions from Passenger Cars, various years. https://www.eea.europa.eu/data-and-maps/data/co2-cars-emission-20
(g) EUROSTAT Database, European Commission, various years. https://ec.europa.eu/eurostat/data/database
(h) GSE (Gestore dei Servizi Energetici), Monitoring of Renewable Energy Sources, 2023. https://www.gse.it/dati-e-scenari/monitoraggio-fer/monitoraggio-nazionale/settore-trasporti
(i) Innovhub, Report on the Physico-Chemical Characterization of Fossil Fuels Used in Italy, Experimental Fuel Station, various years.
(j) IPCC, 2006 IPCC Guidelines for National Greenhouse Gas Inventories, 2006.
(k) ISPRA (Italian National Institute for Environmental Protection and Research), National Inventory of Atmospheric Emissions, 2024. https://emissioni.sina.isprambiente.it/inventario-nazionale/
(l) ISPRA, Italian Greenhouse Gas Inventory 1990–2022, National Inventory Report 2024, Report 398/2024.
(m) ISPRA, Annual Report on the Quality of Automotive Fuels Produced, Imported, and Marketed in Italy, various years. https://www.isprambiente.gov.it/it/pubblicazioni/documenti-tecnici/relazione-annuale-sulla-qualita-dei-combustibili-per-autotrazione-prodotti-importati-e-commercializzati-nell-anno-2022
(n) ISTAT (National Institute of Statistics), Gross Domestic Product at Market Prices, various years. http://dati.istat.it/
(o) MASE (Ministry of Environment and Energy Security), National Integrated Energy and Climate Plan (PNIEC), 2023. https://www.mase.gov.it/sites/default/files/PNIEC_2023.pdf
(p) MASE, MIMIT, National Energy Balance, various years. https://dgsaie.mise.gov.it/ben.php
(q) MIMIT (Ministry of Enterprises and Made in Italy), Guide to Fuel Savings and CO₂ Emissions, various years. https://www.mise.gov.it/index.php/it/mercato-e-consumatori/qualita-di-prodotti-e-servizi/auto-ed-emissioni-co2
(r) MIMIT, National Action Plan for Renewable Energy in Italy, 2010.
-
-
GSE SpA (Energy Services Manager)
ISPRA
MiTE (Ministry of Ecological Transition)
MSE (Ministry of Economic Development)
The data originate from official statistics and archives (Eurostat, GSE, ISPRA), and fiscal documentation - National Energy Balance (MASE, MIMIT).
Source References:
Eurostat Database - European Commission https://ec.europa.eu/eurostat/data/database
GSE (Gestore dei Servizi Energetici) - Renewable Energy Sources Monitoring https://www.gse.it/dati-e-scenari/monitoraggio-fer/monitoraggio-nazionale/settore-trasporti
ISPRA (Italian National Institute for Environmental Protection and Research) - National Emissions Inventory https://emissioni.sina.isprambiente.it/inventario-nazionale/
MASE (Ministry of Environment and Energy Security) - National Energy Balance https://sisen.mase.gov.it/dgsaie/
National
1990 - 2023
Fuel consumption data were processed by ISPRA based on the information provided in the National Energy Balance (compiled by MASE and MIMIT), in accordance with the methodologies set out in the IPCC Guidelines for the preparation of National Greenhouse Gas Inventories submitted under the United Nations Framework Convention on Climate Change (UNFCCC).
The share of gross final energy consumption covered by renewable energy sources is published by GSE as part of the monitoring of Italy’s national RES target for the transport sector. The 2021 figure was calculated according to the methodology established by Directive (EU) 2018/2001 (RED II), whereas the data up to 2020 were calculated based on the methodology established by Directive 2009/28/EC (RED I), and are therefore not fully comparable.
The status is assessed as “poor” since, as of today, the use of low environmental impact fuels remains limited; in 2023, they accounted for only 11% of total road fuel consumption, of which 6% consisted of low-emission fossil fuels and 5% of biofuels, while 89% was made up of petrol and diesel (Table 1, Figure 1).
In Italy, however, the adoption of lower-impact fuels is relatively good compared to other European countries. Partial excise tax exemptions for these fuels have contributed to their spread. Another factor is the ability of LPG- and natural gas-powered vehicles to circulate in urban areas during traffic restriction periods. Italy has a relatively large fleet of alternative-fuel vehicles compared to the European average. However, the share of biofuels in total consumption remains low and largely consists of products that are either imported or made from imported raw materials.
In 2023, of the total energy consumption from low environmental impact fuels, biofuels accounted for approximately 42.2%, natural gas for 12.4%, and LPG held the largest share at 45.4% (Figure 1).
In 2023, the share of total energy consumption in the transport sector covered by renewable sources in Italy, calculated using the methodology set out in Directive (EU) 2018/2001 (RED II), stood at 10.3%, a slight increase compared to 2022 (10.0%).
A negative assessment is given to the trend in relation to the environmentally desirable direction because, despite some progress over the years and a more significant use of biofuels since 2009, the overall increase in the use of low environmental impact fuels has not been substantial compared to total fuel consumption in the transport sector. LPG consumption, which has remained predominant over the years compared to natural gas and biofuels, showed a sharp decline, particularly between 2000 and 2007, in line with a reduction in the vehicle fleet. Consumption later increased as a result of incentive policies (Table 1). Natural gas consumption showed an upward trend until 2019; from 2020 onwards, a marked decrease was observed, reaching about 19.3 PJ in 2023. The overall drop in consumption between 2019 and 2020 was mainly due to mobility restrictions related to the pandemic crisis, followed by a general recovery in 2021 (Table 1).
| Data |
|---|
Headline
Table 1: Energy consumption of low-environmental-impact fuels and biofuels Data source
ISPRA processing based on data from MASE, MIMIT, and GSE. Note
(a) Data on the share of gross final energy consumption covered by renewable energy sources from GSE, included in the monitoring of the national RES target for the transport sector. The historical time series has been recalculated consistently with the update of the National Emissions Inventory reported under the United Nations Framework Convention on Climate Change (UNFCCC). Regarding the data on the share of gross final energy consumption covered by renewable energy sources from GSE, the 2021 value was calculated applying the methodology established by Directive (EU) 2018/2001 (RED II), while data up to 2020 were calculated using the methodology set by Directive 2009/28/EC (RED I) and are therefore not fully comparable. |
Thumbnail
Headline
Figure 1: Composition of energy consumption from transport fuels, with particular focus on low environmental impact fuels (2023) Data source
Processed by ISPRA based on data from MASE and MIMIT |
In general, the use of lower environmental impact fuels in transportation, and in particular biofuels, enables the reduction of greenhouse gas emissions, diversification of energy sources, and substitution or supplementation of fossil fuels. Despite some fluctuations over the years in the historical data series considered, the consumption of low-impact fuels has shown overall growth since the 1990s (Table 1), but it has not yet had a significant share of the total fuels used. To date, the most significant fuel among the lower impact options is LPG. Italy has a relatively large fleet of vehicles powered by LPG and natural gas compared to the European average; however, while the LPG distribution network is widespread nationwide, the adoption of natural gas vehicles is still hindered by an insufficient distribution infrastructure, especially in Southern Italy. In recent years, various incentives have been directed toward subsidizing the purchase of electric vehicles and the establishment of a recharging network for these vehicles, which however remain numerically limited compared to the total fleet in circulation.