Antonella Bernetti, Gianluca Iarocci
This indicator tracks the share of road vehicles complying with the most recent emission standards during the 2005-2023 period. In 2023, passenger cars still showed a non-negligible proportion (13.5%) of Euro 0 gasoline vehicles, while for diesel cars this share was significantly lower at approximately 2.9%. More concerning is the commercial vehicle fleet situation - predominantly diesel-powered - where 10.4% of light commercial vehicles (vans) and 25.9% of heavy goods vehicles remain at Euro 0 standard.
The indicator measures the share of the vehicle fleet that complies with the most recent and stringent emission standards for new vehicles. Harmful emissions in this sector are largely linked to the combustion of fossil energy sources; the use of appropriate technologies significantly reduces these emissions.
To monitor the share of the vehicle fleet that complies with the most recent emission standards for new vehicles.
Regolamento CE 715/2007
Regolamento CE 595/2009
Regolamento UE 459/2012
Regolamento UE 143/2013
Regolamento UE 136/2014
Regolamento UE 45/2015
Regolamento UE 1347/2017
Regolamento UE 858/2018
Regolamento UE 1832/2018
ACI (Automobile Club d'Italia), Studies and Research, various years, https://www.aci.it/laci/studi-e-ricerche.html
ISPRA (Istituto Superiore per la Protezione e la Ricerca Ambientale), National Inventory of Atmospheric Emissions, various years, https://emissioni.sina.isprambiente.it/inventario-nazionale/
MIT (Ministero delle Infrastrutture e dei Trasporti), National Transport Infrastructure Report, Ministry of Infrastructure and Transport, various years, https://www.mit.gov.it/
-
-
ACI (Automobile Club d'Italia)
MIT (Ministero delle Infrastruttura e dei Trasporti)
ACI (https://www.aci.it/laci/studi-e-ricerche/dati-e-statistiche/open-data.html)
MIT (https://www.mit.gov.it/)
National, Regional
2005–2023 (and regional data for the year 2024)
The percentages of the circulating vehicle fleet that comply with specific emission standards are derived from data provided by the Ministry of Infrastructure and Transport. These data, used for the preparation of the national air pollution emissions inventory, refer to the size of the national vehicle fleet in the year under study, broken down by vehicle type, fuel type, engine capacity or weight class, and Euro emission standard.
In Italy, the adjustment of the vehicle fleet to the environmental standards for new vehicles is proceeding at a natural pace driven by the replacement of the existing fleet. In 2023, for passenger cars there is still a non-negligible share of petrol vehicles in the Euro 0 class (13.5%), while for diesel cars this share is much lower, at around 2.9%. As for mopeds and motorcycles, about 42.8% belong to the Euro 0 and Euro 1 classes (the latter being equivalent to or worse than Euro 0 with regard to nitrogen oxides).
The situation of the commercial vehicle fleet is more concerning, largely composed of diesel-powered vehicles, where 29.8% of “light” petrol vehicles (vans) and 16% of diesel ones are still Euro 1 or lower, and 30.5% of “heavy” goods vehicles are Euro I or lower (Table 1). For commercial vehicles, significant reductions in nitrogen oxide and particulate matter emissions are observed only starting with the Euro IV class. It is also noted that, in the case of heavy commercial vehicles, on-road tests of Euro V vehicles did not show the expected reductions in nitrogen oxide and particulate matter emissions; more pronounced reductions are instead observed subsequently with Euro VI vehicles.
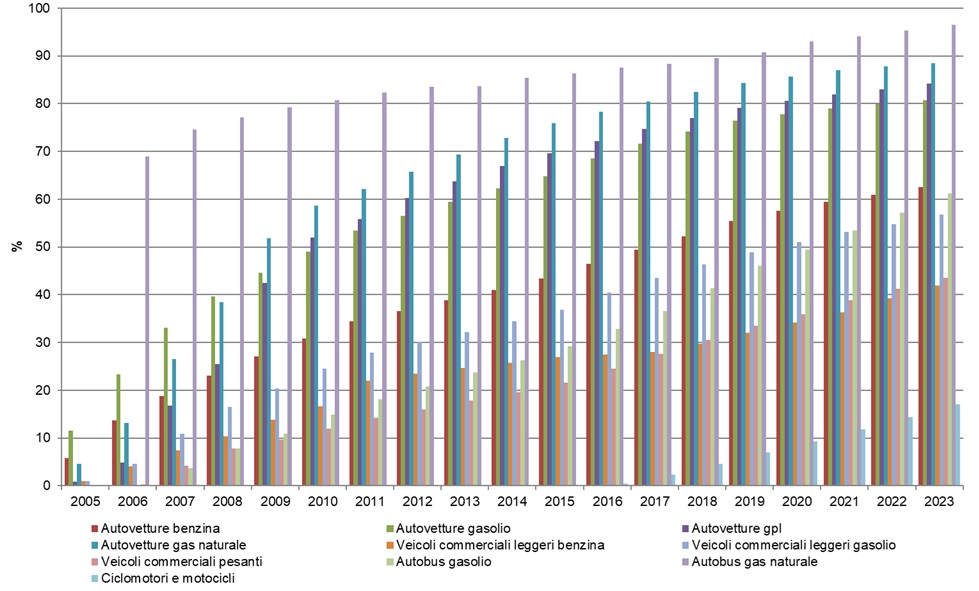
Over the period 2005–2023, an increase is observed in the share of the circulating vehicle fleet compliant with Euro 4 or higher standards. However, the trend does not move in the desirable direction from an environmental perspective, both in terms of the still significant presence of vehicles compliant with older Euro standards and the predominance of fossil fuel powertrains.
In 2023, the share of the fleet compliant with Euro 4 or higher standards is 62.5% for petrol cars, 80.7% for diesel cars, 84.2% for LPG vehicles, 88.5% for natural gas vehicles; for light commercial vehicles, the share is 42.0% for petrol and 56.8% for diesel. In 2023, the share of the fleet compliant with Euro IV or higher standards is 43.5% for heavy commercial vehicles, 61.3% for diesel buses, 96.5% for natural gas buses, and 17.1% for mopeds and motorcycles.
Hybrid vehicle categories, which still represent a minor share of the circulating fleet, comply with the most recent Euro standards (Table 1 and Figure 1).
| Data |
|---|
Headline
Table 1: Distribution of circulating vehicles by category and Euro standard (2023) Data source
ISPRA processing based on Motorization data (Ministry of Infrastructure and Transport) Note
The table reports percentage values referring to the circulating fleet. |
Thumbnail
Headline
Figure 1: Percentages of the circulating fleet compliant with Euro 4 standards or higher (2023) Data source
ISPRA elaboration based on data from the Motorization Department (Ministry of Infrastructure and Transport) Note
Hybrid categories, always compliant with Euro 4 standards or higher, are not shown here for the purpose of comparison across years |
Thumbnail
Headline
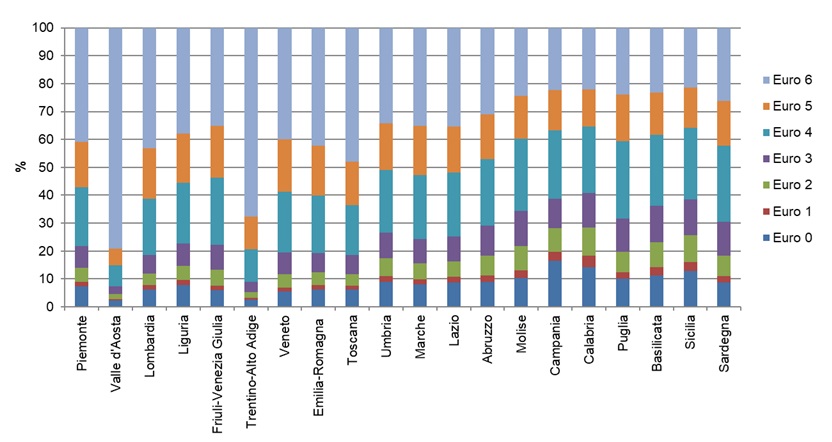
Figure 2: Percentage Composition of the Passenger Car Fleet by Region and Technology (Year 2024) Data source
ISPRA elaboration based on ACI data |
Thumbnail

Headline
Figure 3: Percentage composition of the commercial vehicle fleet by region and technology (Year 2024) Data source
Processed by ISPRA based on ACI data |
The identification of a vehicle's Euro class refers to regulatory periods that vary significantly depending on the vehicle type. The type of vehicle also determines a high variability in both emissions per kilometre travelled and the reduction percentage of regulated pollutants (carbon monoxide, nitrogen oxides, volatile organic compounds, and particulate matter), which generally increases with more recent Euro classes. However, emissions across different vehicle types are not directly comparable—on average, heavy-duty vehicles emit more per kilometre than passenger cars or light commercial vehicles. Nevertheless, classification by Euro standard provides a concise overview that helps assess the penetration of less polluting vehicles within the circulating fleet.
Figure 1 shows the share of the national vehicle fleet that complies with stricter environmental standards. The renewal and technological upgrading of the vehicle fleet is closely linked to the average income level of the population. The penetration of newer vehicles is not uniform across the country.
In 2024, passenger cars in the regions of Basilicata, Sicily, Calabria, Campania, Puglia, and Molise are still characterized by a share of Euro 0 vehicles equal to or higher than 10%. Moreover, in Sicily, Calabria, and Campania, vehicles of the “older generation” (up to and including Euro 2 standards) still account for more than 25% of the fleet.
Conversely, in the regions of Veneto, Emilia-Romagna, Lombardy, Tuscany, Trentino–Alto Adige, and Valle d’Aosta, the development of motorization is characterized by vehicles compliant with the most recent emission standards (Euro 4–6), which account for more than 80% of the fleet (Figure 2).
The analysis of industrial vehicles—including light and heavy vehicles and road tractors—for 2024 shows a more modern vehicle fleet (Euro IV–VI) in Piedmont, Emilia-Romagna, Veneto, Tuscany, Lombardy, Trentino–Alto Adige, and Valle d’Aosta (Figure 3).