Marina Colaiezzi
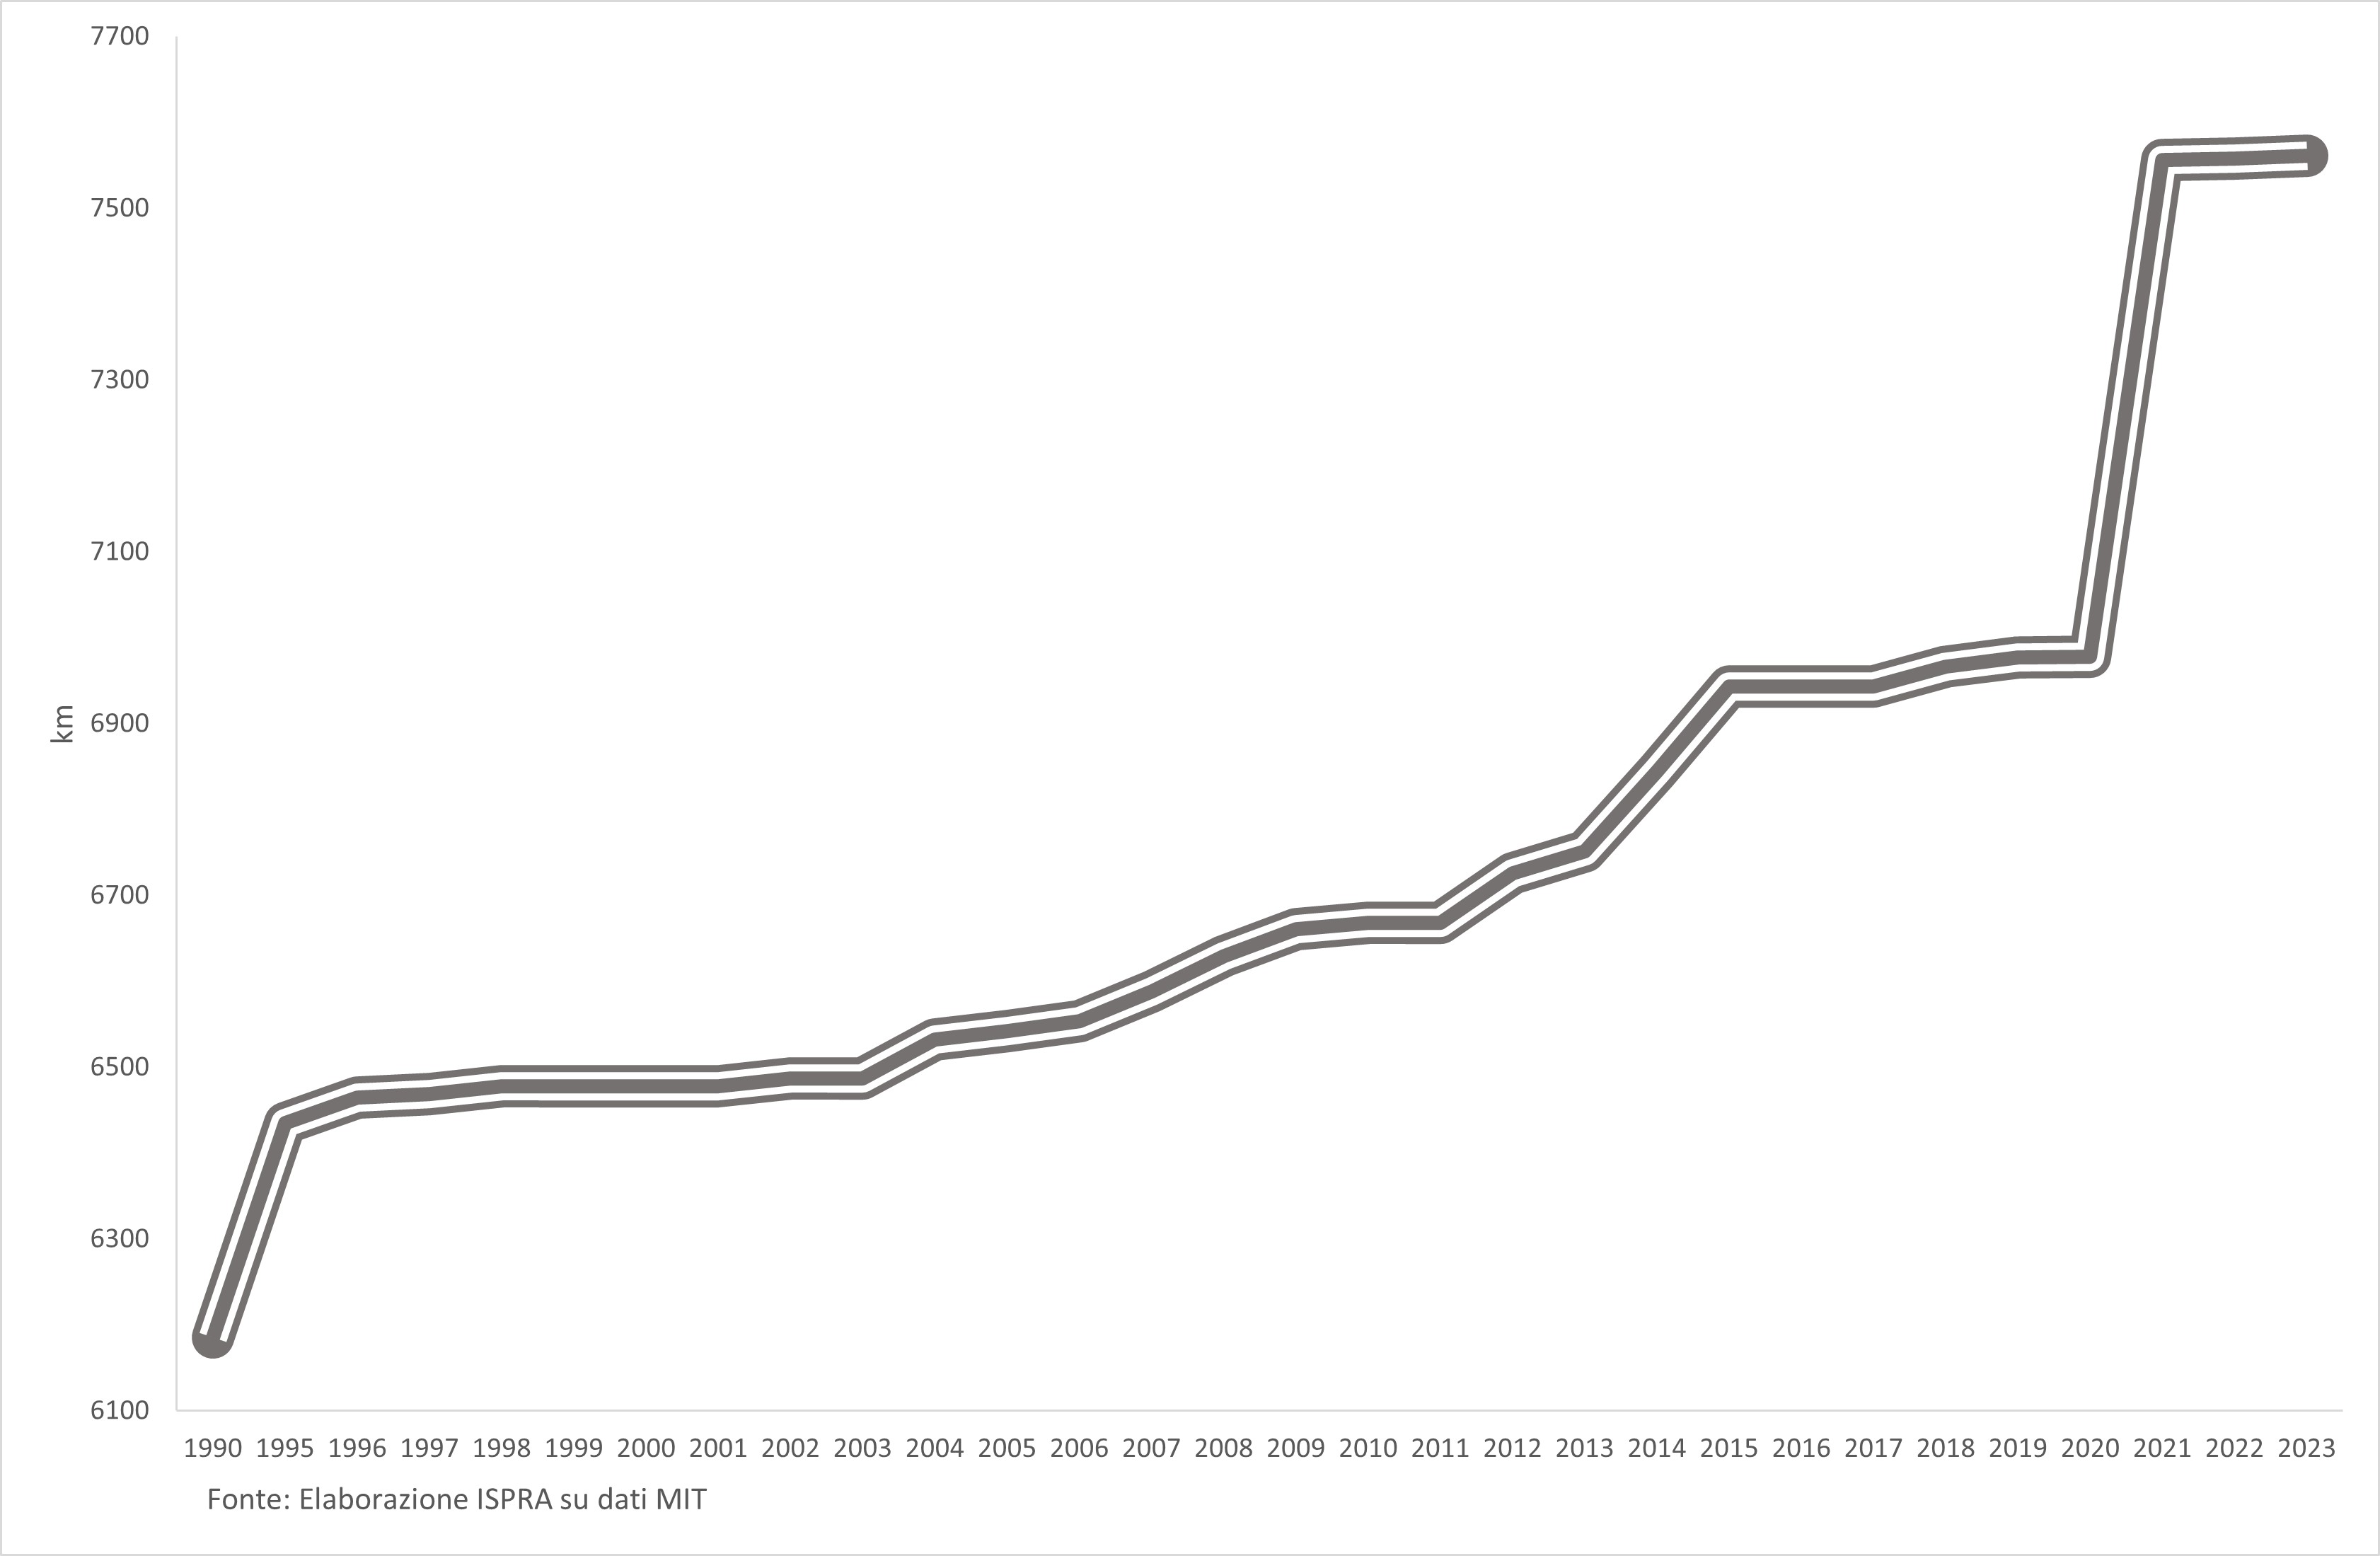
This indicator monitors the development of transport infrastructure networks. Between 1990 and 2023, 1.376 km of new motorways were constructed in Italy (+22.2%). As of 2023, Italy ranks eighth in the world for operational high-speed rail network length, according to the International Union of Railways (UIC).
The indicator assesses the availability and functionality of transport infrastructure across different modes. For road and rail transport, network infrastructures are considered, whereas for air and maritime transport, point infrastructures are taken into account. Transport infrastructure supports national and European markets and enhances social cohesion through accessibility. However, it can also contribute to social fragmentation, land use pressures, noise, and air pollution.
To monitor transport infrastructure networks in order to optimize their use and to revitalize certain modes, such as rail transport and urban fixed-track systems.
Starting with the new White Paper on Transport (28 March 2011), the European Commission outlined key objectives and challenges to be addressed. Among these objectives are: connecting transport networks (rail, airport, maritime, and inland waterways), upgrading infrastructure, and creating a single European airspace with a common aviation regulation framework.
In 2013, the EU adopted Regulation (EU) No 1315/2013 to enhance transport development within the EU, focusing on the Trans-European Transport Network (TEN-T). The regulation introduced two network concepts: the comprehensive network (to be completed by 2050) aiming for EU-wide accessibility and connectivity, and the core network (to be completed by 2030) consisting of the most crucial components of the comprehensive network.
More recently, in April 2021, the Italian Parliament approved the National Recovery and Resilience Plan (NRRP). In particular, Mission 3: Infrastructure for Sustainable Mobility aims to modernize, digitize, and make the national infrastructure system more sustainable by 2026. The goal is to meet the decarbonization targets outlined by the European Union in the framework of the European Green Deal and its related Strategy for Sustainable and Smart Mobility (published on 9 December 2020), and to align with the Sustainable Development Goals of the United Nations’ 2030 Agenda.
Mission 3 is divided into two components:
-
Rail Network Investments: focused on the development of Italy’s high-speed and high-capacity railway system, integration with regional rail services, and ensuring safety across the entire railway network. The primary objective is to enhance rail transport for both passengers and freight by increasing capacity and connectivity, improving service quality along key national and regional corridors, and strengthening cross-border links.
-
Intermodality and Integrated Logistics: includes measures to support the modernization and digitalization of the logistics system.
Additionally, aligned with the strategic framework of Mission 3 and financed through national resources, further investments will be implemented, including:
-
Road Safety 4.0: to enhance the safety and climate/seismic resilience of bridges and viaducts using technological innovation and climate change adaptation approaches.
-
Port system development: to increase the competitiveness, capacity, and productivity of Italian ports, with a focus on reducing pollutant emissions.
-
Strengthening regional rail services: further interventions will be carried out to improve regional railway transport.
Conto Nazionale delle Infrastrutture e della Mobilità Sostenibili 2022-2023, https://www.mit.gov.it/comunicazione/pubblicazioni
Rete ferroviaria italiana https://www.rfi.it/it/rete/la-rete-oggi/La_rete_oggi_regione_per_regione.html
Eurostat, Transport statistics, https://ec.europa.eu/eurostat/data/database, https://assaeroporti.com/
A limitation lies in the fact that the length of a transport infrastructure (e.g., highway, railway, etc.) only serves as a proxy indicator of its capacity. In reality, capacity should be measured by the maximum traffic flow the infrastructure can sustain, but this data is currently unavailable.
-
-
AISCAT – Italian Association of Motorway and Tunnel Concessionaire Companies
-
EUROSTAT – Statistical Office of the European Communities
-
ISTAT – Italian National Institute of Statistics
-
MIT – Ministry of Infrastructure and Transport (Italy)
-
RFI – Italian Railway Network
-
UIC – International Union of Railways
MIT- Conto Nazionale delle Infrastrutture e della Mobilità Sostenibili 2022-2023 Aiscat-Informazioni Eurostat-Db https://ec.europa.eu/eurostat/data/database?node_code=hlth UIC https://uic.org/passenger/highspeed/high-speed-database-maps RFI https://www.rfi.it/it/rete/la-rete-oggi.html ASSAEROPORTI https://assaeroporti.com/dati-annuali/
National; Regional
1990-2022/2023
For road networks, railways, metro systems, funiculars, and both urban and interurban tramways, length in kilometers was considered. For ports, the following metrics were used: the number of ports per province, the number of berths, and the number of ports equipped with rail tracks connected to the railway network. Additionally, the total surface area of storage yards and tanks for petroleum products and other liquids (in m²) was included. Finally, container volume and passenger traffic (arrivals and departures) were analyzed for major European ports.
As of 2023, the primary road network in Italy includes motorways (7,561 km), regional and provincial roads (131,095 km), and other roads of national interest (30,193 km), for a total extension of 168,849 km. The motorway network has remained almost unchanged compared to the previous year (Table 1).
Regarding maritime transport infrastructure (as of 30 September 2023), there are 280 ports—many of which are small in size—with a total of 2,486 berths, corresponding to an overall quay length of approximately 510 km. Of these, only 256 are equipped with rail tracks connected to the railway network (Table 3). In the aviation sector, there are 41 airports in Italy open to commercial traffic (certified by ENAC). Among the 20 Italian regions, only Molise and Basilicata lack airports (Table 5).
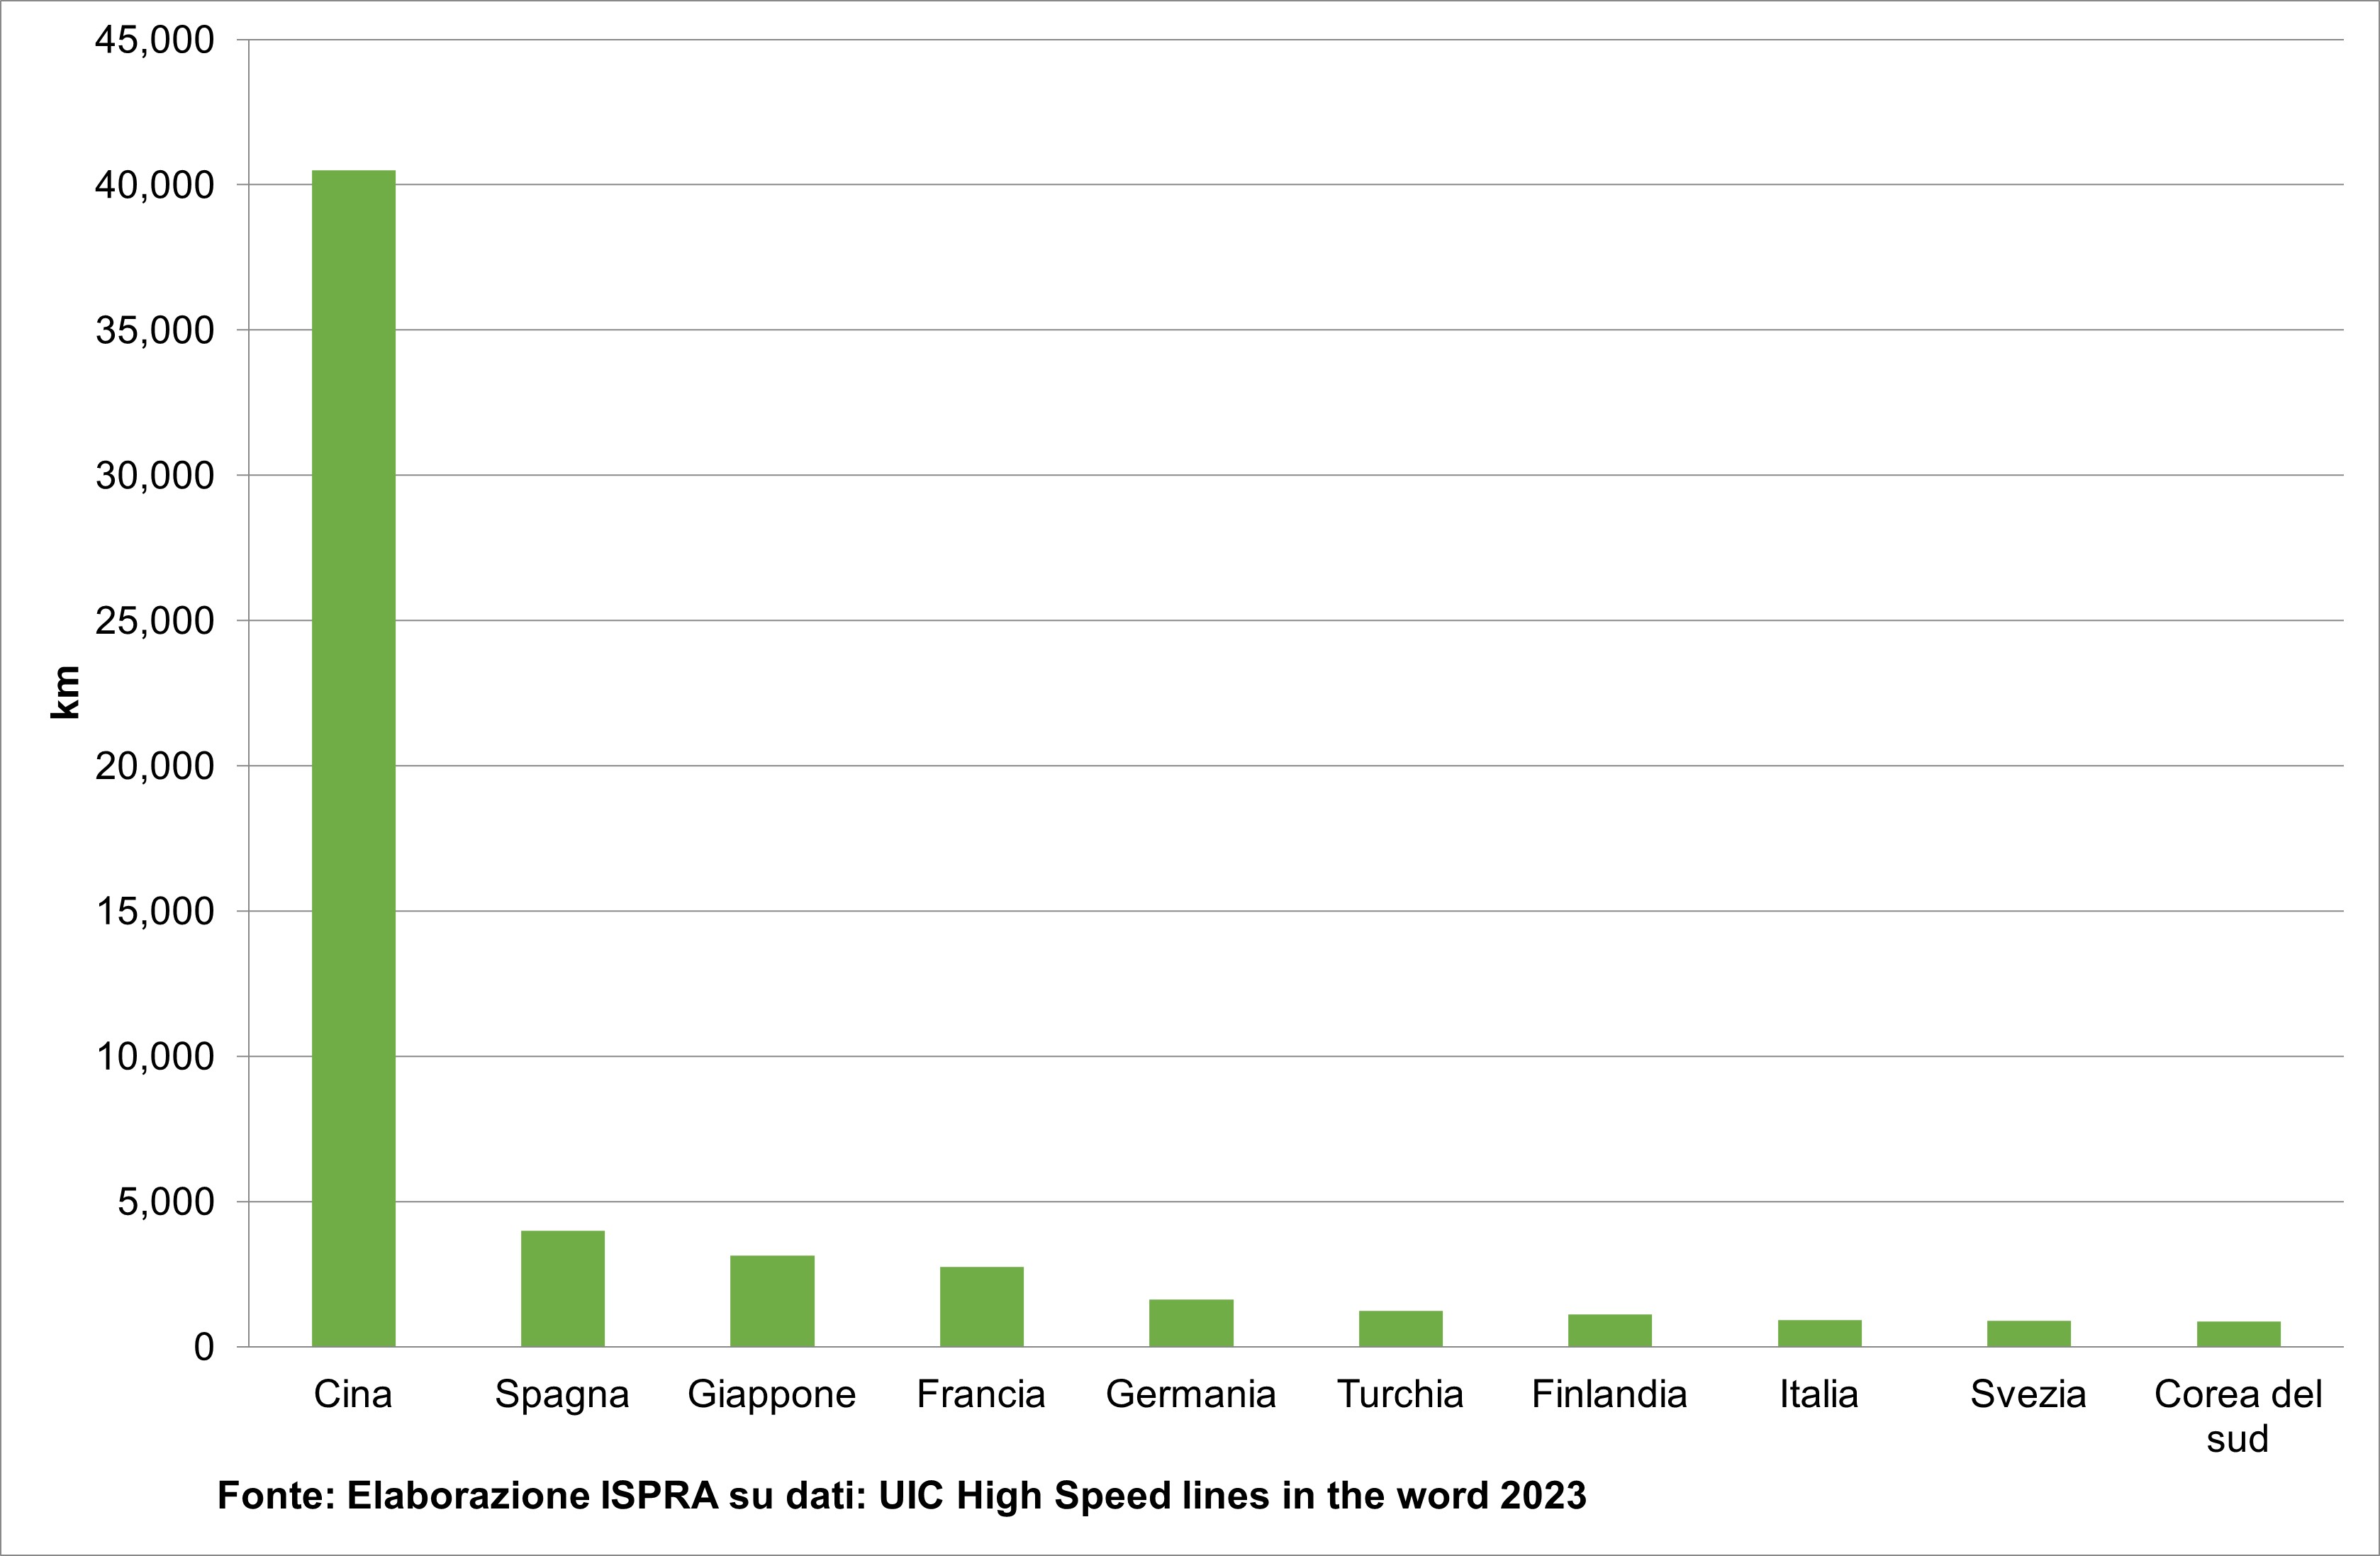
According to data from the Ministry of Infrastructure and Transport (MIT), the total length of the Italian railway network amounts to 16,762 km, of which 4,575 km are non-electrified (Table 1). Italy ranks 19th globally for total high-speed rail length (including planned/under-construction lines) and 8th for operational HSR lines (Table 6 and Figure 3).
An efficient and sustainable transport system is crucial for connecting regions and countries, as it links markets and people while supporting economic activity, development, and growth. In this context,Italy's current transport infrastructure system exhibits uneven spatial distribution in both road/highway and rail networks, with a clear disparity between Northern and Southern Italy in terms of network length (Table 2).
Regarding passenger rail systems—the country's primary transport infrastructure—the high-speed rail (HSR) network currently terminates at Naples/Salerno. Consequently, populations beyond this segment remain disconnected from the HSR system. This issue also affects Central Italy, where enhanced East-West rail connections are needed to provide inland communities with access to modern rail infrastructure. Further development of the still-limited metro network is also required, while construction is underway on infrastructure components needed to complete the core TEN-T network by 2030.
| Data |
|---|
Headline
Table 1: Inland passenger traffic in Italy, by mode of transport Data source
Conto Nazionale delle Infrastrutture e dei Trasporti (CNIT) 2023-2024, MIT Data legend
|
Headline
Table 2: Road and Railway Networks by Region – Road Network Density Indicators Data source
Processing by the Ministry of Infrastructure based on data from AISCAT, ANAS, ISTAT, and direct surveys conducted with Regions and Provinces. Processing by ISPRA based on data from ISTAT and RFI – Italian Railway Network (https://www.rfi.it/en/network/the-network-today/The_network_today_by_region.html) |
Headline
TABLE 3: PORT INFRASTRUCTURE ASSETS AND CAPACITY IN ITALY (AS OF 30/09/2024) Data source
Source: Ministry of Infrastructure and Transport (MIT), Harbour Master's Offices, Port System Authorities. Note
|
Headline
TABLE 4: TOP EUROPEAN PORTS BY CONTAINER VOLUME AND PASSENGER TRAFFIC (ARRIVALS + DEPARTURES) Data source
Eurostat, Transport statistics (Last updated 04/12/2023 for container volume and 03/09/2024 for passenger traffic) Data legend
1 TEU = Twenty Foot Equivalent Unit. The container volume refers to the total capacity, regardless of the type of goods contained within |
Headline
Table 5: Main Technical Characteristics of Italian Airports Certified by ENAC – January–December 2024 Data source
Ministry of Infrastructure and Transport, based on provisional data from ENAC – ASSAEROPORTI Data legend
Commercial air traffic (international and domestic) refers to the transport of passengers or cargo for remuneration. It includes scheduled services, charter flights, and air taxis. "Movements" refers to the total of arrivals and departures. "Passengers" include both arriving and departing individuals at each airport. "Cargo" includes freight and mail. Note
|
Headline
Table 6: High-Speed Rail Lines Worldwide, 2023 (updated October 2025) Data source
Source: UIC - International Union of Railways (website: https://uic.org/passenger/highspeed/article/high-speed-data-and-atlas) Data legend
|
Thumbnail
Headline
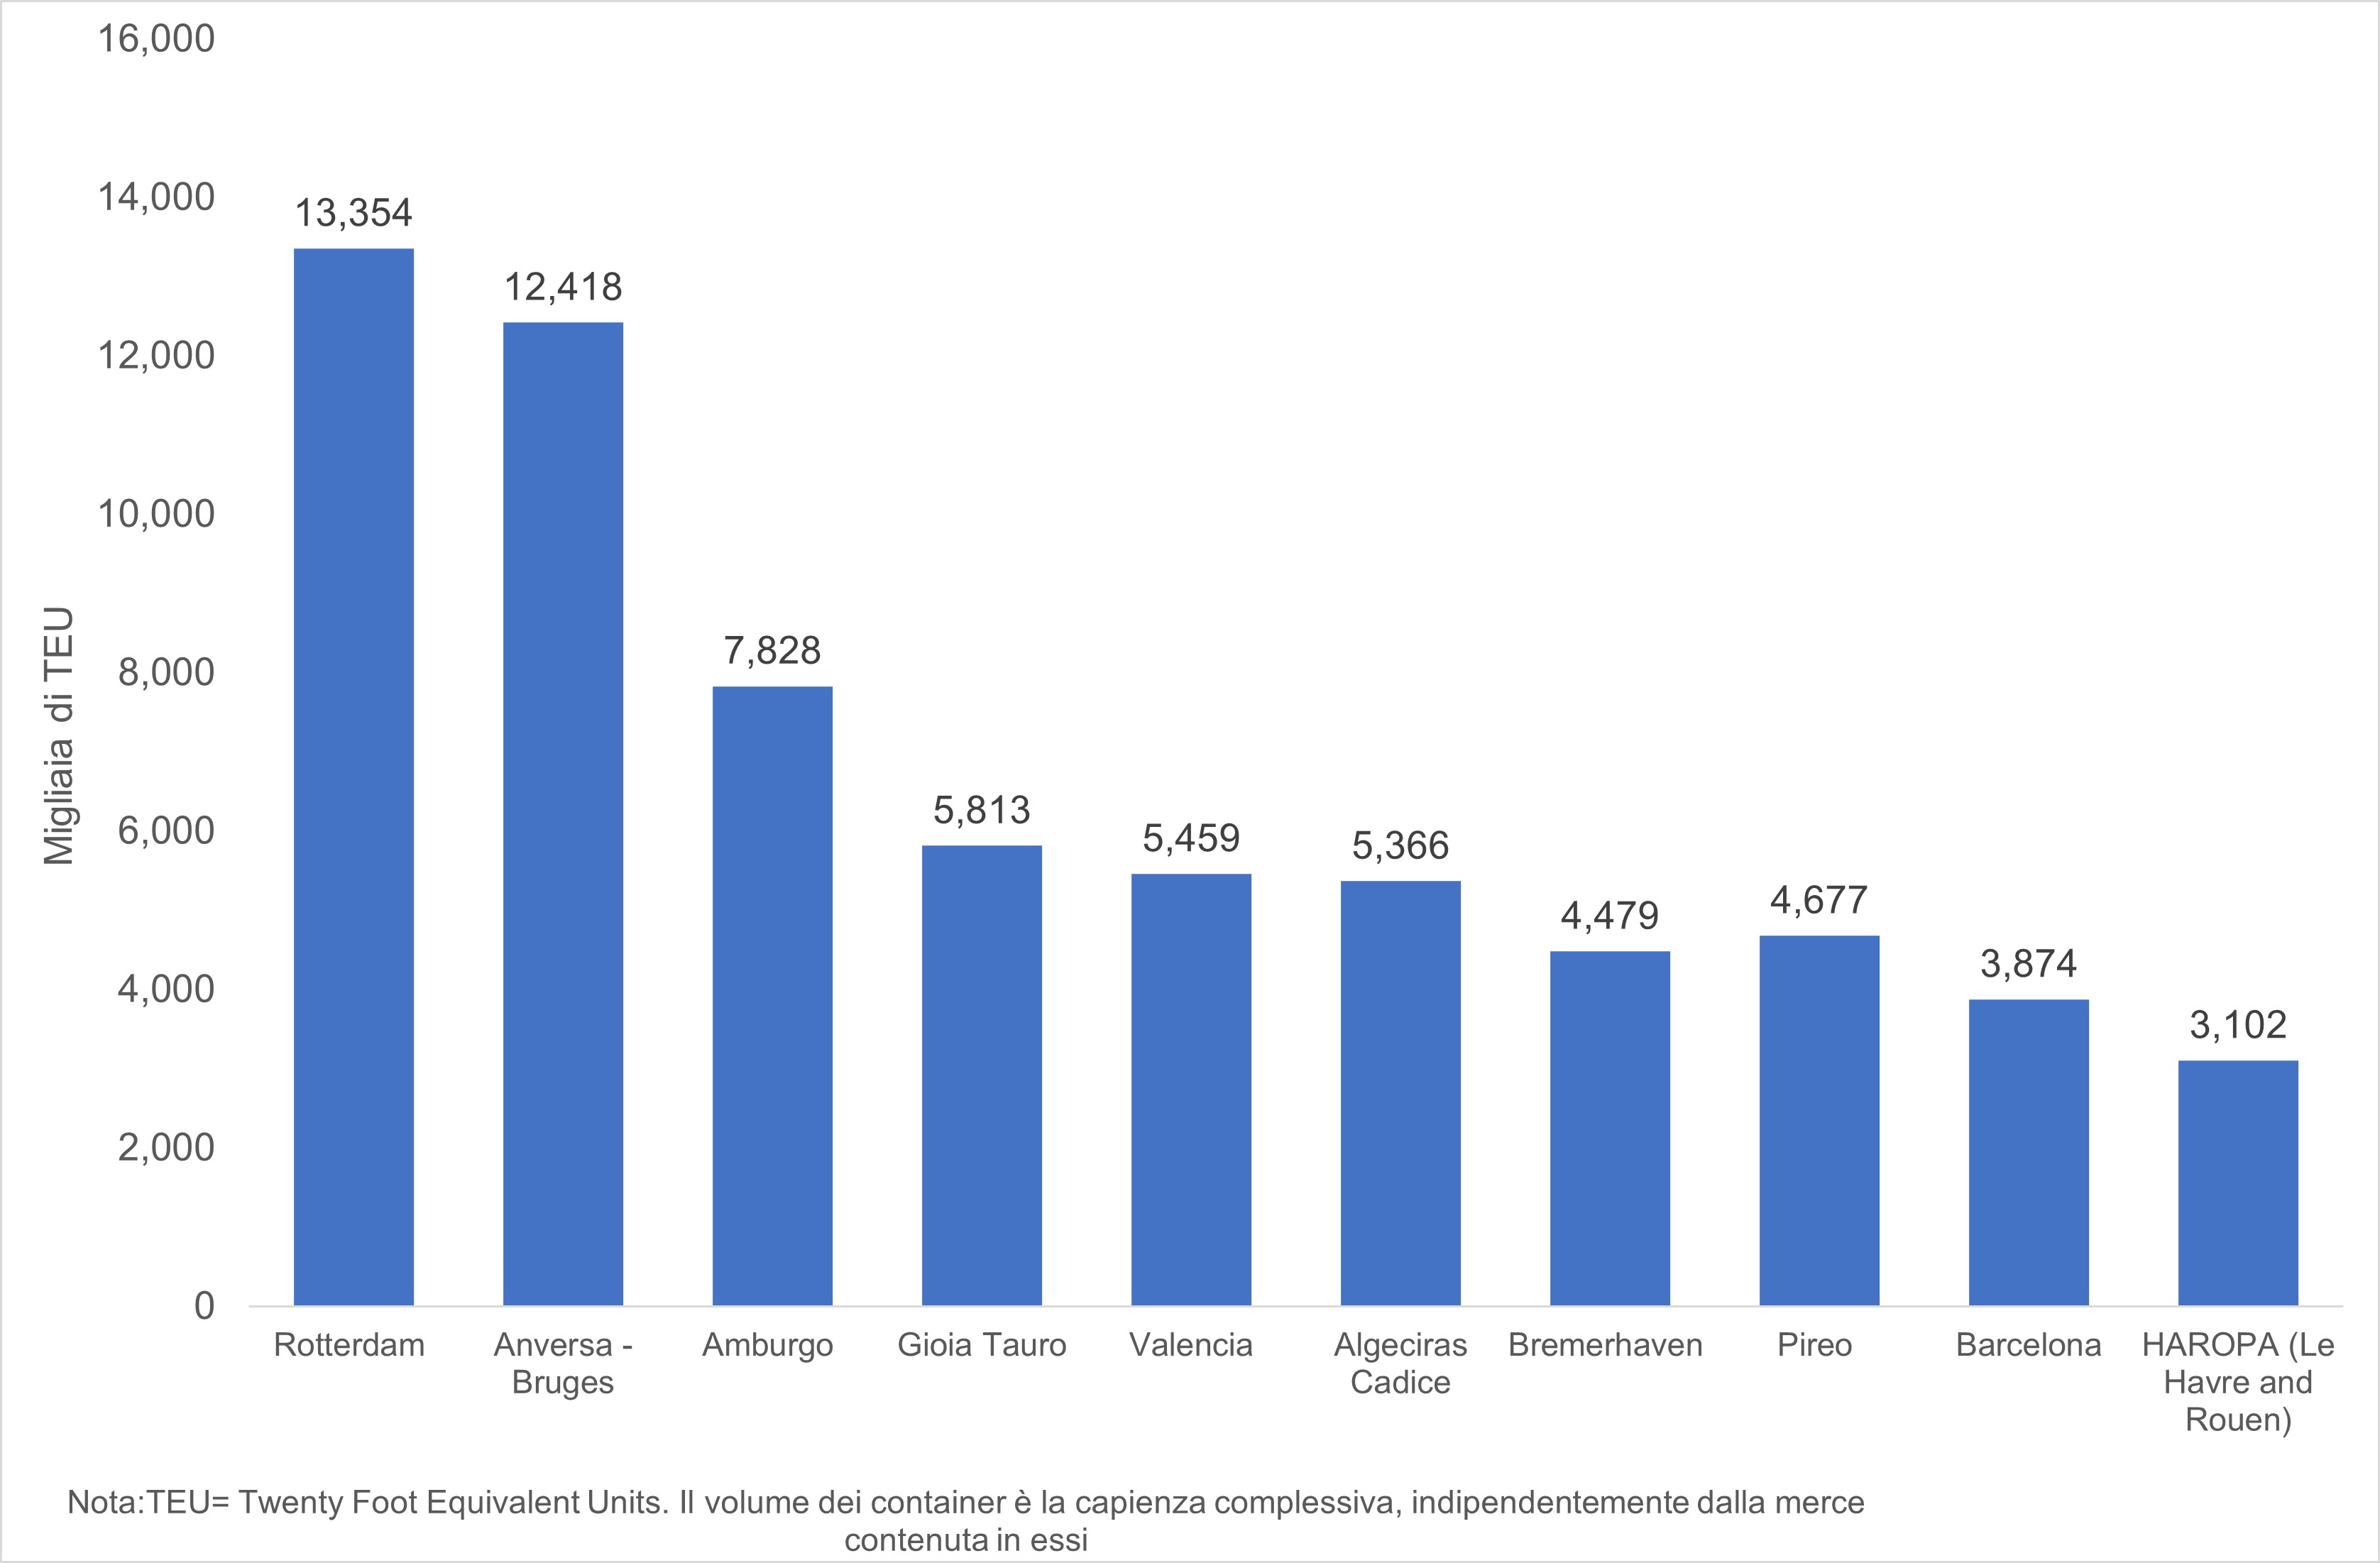
Figure 1: Major European Ports by Container Throughput Volume Data source
Source: Eurostat, Transport Statistics (latest available update: 03/12/2025 for container throughput volume) Note
1 TEU = Twenty-Foot Equivalent Unit. Container volume refers to total capacity, regardless of the type or value of the goods contained. |
Thumbnail
Headline
Figure 2: Development of the Italian Motorway Network Data source
ISPRA elaboration based on MIT data |
Thumbnail
Headline
Figure 3: High-Speed Rail Lines “In Operation” Worldwide in 2023 Data source
Data Source: ISPRA elaboration based on data from UIC – High-Speed Lines in the World 2023 |
During the period 1990-2023, the length of road infrastructure (excluding municipal roads) increased by 13.1%. In 2023, the railway network extended over 16.832 km, comprising 12.205 km of electrified network (+21 km compared to 2022) and 4,627 km of non-electrified network. The total extension of urban and suburban tram networks in 2023 was 431 km, while the metro network length remained relatively modest at approximately 232 km. Terrestrial funicular railways, essential for transportation along steep gradients, are operated in Italy by 19 companies, with a total operational length of 21 km. While primarily serving tourist needs, they often facilitate daily commuting for local residents (Table 1).
Rotterdam, handling approximately 13.4 million TEU in 2024 (13 million in 2023), remained Europe's largest container port by volume, followed by Antwerp (12.4 million TEU in 2024) and Hamburg (7.8 million TEU in 2022) (Table 4 and Figure 1). Gioia Tauro ranked ninth with 3.5 million TEU in 2022 (3.4 million in 2021) (Table 4).
With regard to the passenger segment, in 2024 all the ports considered recorded an overall increase in passenger traffic compared to 2023, with the sole exception of Stockholm (-2%). The three leading ports in terms of passenger volumes are Messina (11.3 million passengers per year), Reggio Calabria (11.2 million passengers), and Naples (approximately 11 million passengers in 2024).