Antonella Bernetti, Gianluca Iarocci
The indicator measures the size of the vehicle fleet, which represents a major factor contributing to environmental pressure. According to Eurostat, Italy has the highest vehicle fleet among EU countries in relation to population. In 2022, the number of passenger cars per thousand inhabitants was 682, exceeded only by Liechtenstein and Iceland.
The indicator measures the evolution of the road vehicle fleet, which is responsible for a significant share of energy consumption, greenhouse gas emissions, and pollutant emissions in the transport sector.
To measure the size of the vehicle fleet.
-
ACI, Studies and Research, various years, https://www.aci.it/laci/studi-e-ricerche.html
ANCMA, Statistics and Research, various years, https://www.ancma.it/statistiche/
EUROSTAT Database, European Commission, various years, https://ec.europa.eu/eurostat/data/database
ISPRA, National Inventory of Atmospheric Emissions, various years, https://emissioni.sina.isprambiente.it/inventario-nazionale/
ISPRA, Italian Emission Inventory 1990–2022, Informative Inventory Report 2024, Italian National Institute for Environmental Protection and Research, Reports 400/2024, https://emissioni.sina.isprambiente.it/wp-content/uploads/2024/05/IIR2024-Rapporto-400-2024.pdf
ISPRA, Italian Greenhouse Gas Inventory 1990–2022, National Inventory Report 2024, Reports 398/2024, https://emissioni.sina.isprambiente.it/wp-content/uploads/2024/05/NIR2024-Rapporto-398-2024.pdf
ISTAT, Database, http://dati.istat.it/, various years
MIT, National Transport Infrastructure Report, Ministry of Infrastructure and Transport, various years, https://www.mit.gov.it/
The indicator is constructed using multiple primary data sources; for comparative purposes, it is therefore necessary to account for this aspect, particularly regarding vehicle fleet data from ACI and MIT databases, which are not fully aligned across years.
-
ACI - Automobile Club of Italy
ANCMA - National Association of Cycle Motorcycle Accessories
EUROSTAT - Statistical Office of the European Communities
ISTAT - National Institute of Statistics (Italy)
MIT - Ministry of Infrastructure and Transport (Italy)
ACI (Automobile Club of Italy), Data and Statistics, various years, http://www.aci.it/laci/studi-e-ricerche/dati-e-statistiche/open-data.html
ANCMA (National Association of Cycle Motorcycle Accessories), Two-Wheel Vehicle Statistics, various years, http://www.ancma.it/statistiche/
EUROSTAT Database, European Commission, various years, https://ec.europa.eu/eurostat/data/
ISTAT (National Institute of Statistics) Database, Resident Population Data, various years, http://dati.istat.it/
MIT (Ministry of Infrastructure and Transport), National Transport Infrastructure Report, various years, http://www.mit.gov.it
National
1990-2022
The data on circulating vehicles have been processed based on information from the Ministry of Infrastructure and Transport. Population data are sourced from ISTAT. The vehicle fleet data presented in Table 1 constitute the baseline data used for estimating road traffic emissions for the preparation of the National Emissions Inventory. The vehicle categories referenced derive from the COPERT classification. The Eurostat data reported for the Italian fleet (Table 2) are sourced from ACI.
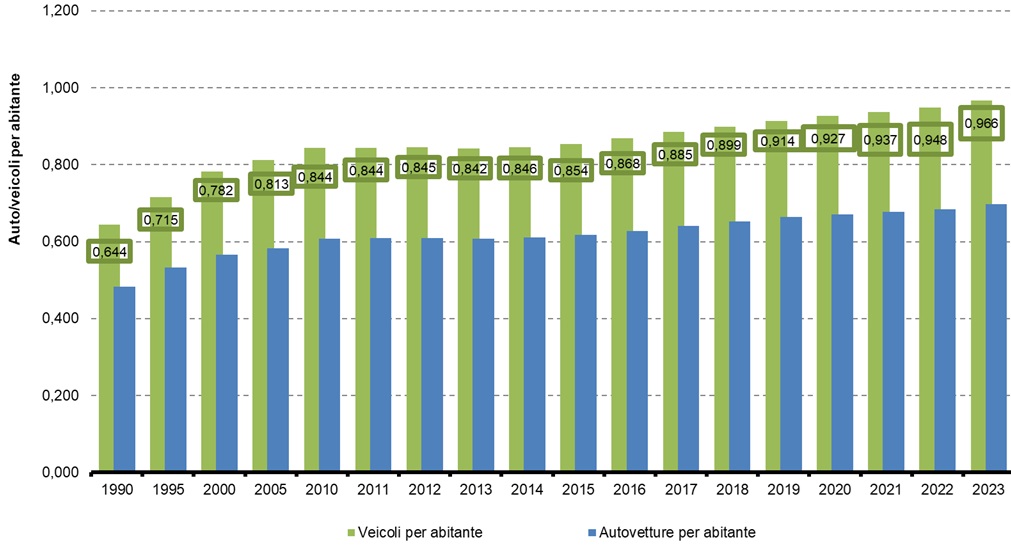
In Italy, the circulating vehicle fleet is very large, among the highest in the EU countries relative to the population. Eurostat data on the number of passenger cars per thousand inhabitants in 2022 (Table 2) show that Italy (682) is surpassed only by Liechtenstein and Iceland. Considering the total circulating fleet on the road, including two-wheeled vehicles, there were 948 vehicles per thousand inhabitants in 2022 (Table 1 and Figure 2).
Between 1990 and 2022, data on the circulating vehicle fleet show a growth trend (+53.2%), particularly concerning passenger cars, light commercial vehicles, and motorcycles (Table 1). Consequently, a negative evaluation is attributed to this trend, characterized by intermodal inadequacies and negative externalities associated with a high fleet size relative to the resident population, such as congestion, accidents, and pollution.
| Data |
|---|
Headline
Table 1: Road vehicle fleet size by category and density relative to population Data source
ISPRA processing based on data from the Ministry of Infrastructure and Transport (vehicle fleet) and ISTAT (resident population) Note
The vehicle fleet data reported in the table are the baseline data used for estimating road traffic emissions for the preparation of the National Emissions Inventory. The vehicle categories referenced are based on the COPERT classification (EMISIA SA, 2024). |
Headline
Table 2: Number of passenger cars per 1,000 inhabitants, by country Data source
Eurostat Note
The data on the passenger car fleet considered by Eurostat for Italy are sourced from ACI; therefore, there is a discrepancy compared to the data reported in Table 1. |
Thumbnail
Headline
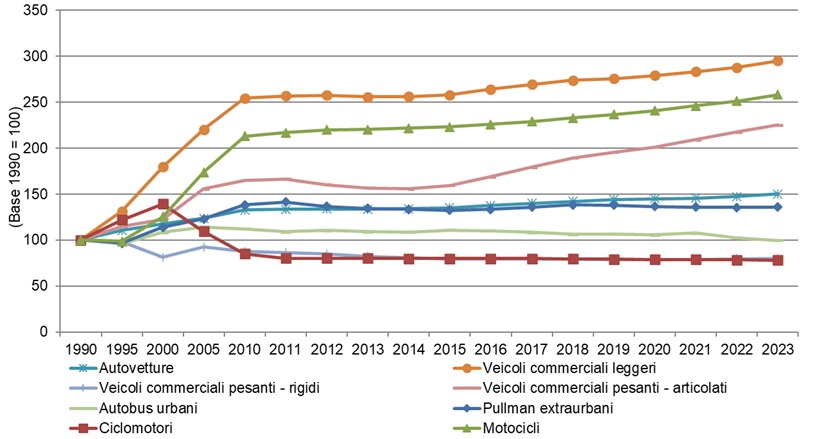
Figure 1: Trend of the on-road vehicle fleet by category (index numbers, base year 1990 = 100) Data source
ISPRA processing based on data from the Ministry of Infrastructure and Transport (vehicle fleet) Note
The vehicle fleet data reported in the table are the baseline data used for estimating road traffic emissions for the preparation of the National Atmospheric Emissions Inventory. The vehicle categories referenced are derived from the COPERT classification (EMISIA SA, 2024). |
Thumbnail
Headline
Figure 2: Evolution of the Number of Vehicles per Inhabitant in Italy Data source
ISPRA processing based on data from the Ministry of Infrastructure and Transport (vehicle fleet) and ISTAT (resident population) |
Between 1990 and 2022, the total vehicle fleet grew by 53.2%. The reductions recorded in mopeds are more than offset by the increase in motorcycles (+151.2%), while passenger cars increased by 47.3% (Table 1). The density of total vehicles relative to the population rose from 0.643 to 0.948 vehicles per capita (including two-wheelers, Table 1). Considering passenger cars only, the density increased from 0.483 to 0.682 (Eurostat, Table 2).
According to Eurostat data, in 2022 Italy had a very high car density relative to the resident population, amounting to 682 cars per 1,000 inhabitants, surpassed only by Liechtenstein and Iceland (Table 2). This higher density is a well-established figure, which can also be interpreted as an indicator of structural deficiencies in the public transportation system. It should be noted that the data reported in Table 1 and Table 2 come from different sources.
The higher density and use of vehicles results in a more than proportional increase in average costs borne by the population for travel, as well as a significant rise in the main negative externalities associated with road transport: pollution, congestion, and accidents.
As shown in Figure 1, the circulating fleet has grown. Vans, in particular, have increased considerably since the mid-1990s. A marked increase in the number of motorcycles since 2000 is also evident. More precise data on mopeds are available from 2012, sourced from the Ministry of Infrastructure and Transport (MIT). Especially in large urban areas, two-wheel vehicles have become widespread and are used for personal mobility, due to difficulties in using cars caused by congestion, parking challenges in central areas, and often a lack of viable public transport alternatives.