Antonella Bernetti, Antonio Caputo, Francesca Palomba
The indicator allows for the assessment of emissions of the main air pollutants produced by the transport sector. In Italy, harmful emissions from road transport have significantly decreased in recent years, thanks to the introduction of catalytic converters, particulate filters, and other technologies installed in vehicles. From 1990 to 2023, road emissions of non-methane volatile organic compounds decreased by 87.6%, nitrogen oxide emissions by 71.3%, and fine particulate emissions by 69.9%. Sulfur oxide emissions, now almost absent in road transport, remain significant in maritime transport. Air pollutant emissions are monitored at the national level to verify compliance with reduction commitments set by the European Union, with the goal of achieving air quality levels that do not cause significant negative impacts or pose serious risks to human health and the environment.
The indicator considers emissions of the main air pollutants, which are nitrogen oxides (NOx), non-methane volatile organic compounds (NMVOCs), particulate matter (PM), lead (Pb), benzene (C6H6), and sulfur oxides (SOx). Nitrogen oxides contribute to acid rain, eutrophication, and the formation of tropospheric ozone, and indirectly to global warming and changes in the ozone layer. Particulate matter currently represents the pollutant with the greatest impact on human health, especially the fine fraction (PM2.5), which can penetrate deep into the lungs. Particulate matter is harmful both as an irritant to mucous membranes and as a "carrier" that transports trace pollutants, potentially mutagenic or harmful, into the lungs and bloodstream. Secondary particulate matter also forms in the atmosphere, contributed to by emissions of nitrogen oxides, sulfur oxides, ammonia, and volatile organic compounds. Ozone is formed from the reaction between nitrogen oxides and non-methane volatile organic compounds in the presence of heat and sunlight, especially during the summer months. Benzene is a carcinogenic substance present in trace amounts in gasoline and in motor vehicle exhaust gases.
To assess the emissions of the main air pollutants produced by the transport sector, in order to verify the achievement of European targets for the reduction of total national emissions and the sector's contribution to environmental pressure in areas critical for air quality.
Based on the UNECE Convention on Long-range Transboundary Air Pollution (CLRTAP), Italy is required to annually update and report its national inventory of atmospheric pollutant emissions. EU Directive 2016/2284 on national emission ceilings defines reduction commitments for total emissions of air pollutants SO2, NOx, NMVOCs, NH3, and PM2.5, stipulating that emissions related to road transport be calculated and reported based on the quantities of fuel sold in Member States, which may also use fuel consumption or kilometers traveled within the Member State as a reference.
At the EU level, emissions from road vehicles are regulated separately for light-duty vehicles (passenger cars and light commercial vehicles) and heavy-duty vehicles (trucks and buses). Regulation (EC) No 715/2007 concerns the type approval of motor vehicles regarding emissions from passenger cars and light commercial vehicles (Euro 5 and Euro 6), while Regulation (EC) No 595/2009 concerns the type approval of motor vehicles and engines regarding emissions from heavy-duty vehicles (Euro VI).
For light vehicles, the Euro 5 and Euro 6 standards were adopted in 2007, becoming mandatory for the approval and registration of new vehicle types from January 2011 and September 2015 respectively; in particular, the Euro 6 standard reduces nitrogen oxide emissions per kilometer from diesel cars. Since September 2017, the standardized driving cycle used for vehicle type approval testing is the WLTP (Worldwide Harmonized Light vehicles Test Procedure), complemented by the RDE (Real Driving Emissions) test.
Between 2018 and 2021, the Euro 6 emissions standards were amended several times, introducing progressively stricter approval procedures with more stringent tests under the WLTP and RDE cycles. These regulations represent an evolution towards tighter limits on pollutant emissions from vehicles and are divided into several phases: Euro 6A mandatory for vehicles registered from January 2016, Euro 6B differing from 6A mainly by further reduced particulate emissions, Euro 6C mandatory for all new cars sold from September 2018 and type approved from September 2017, Euro 6 Temp mandatory for all new cars sold from September 2019 and approved from September 2018, and Euro 6D mandatory for all registrations from January 2021 and approvals from January 2020.
The most recent measures regarding pollutant emissions derive from Regulation (EU) 2017/1151, which amends Regulation (EC) No 715/2007 of the European Parliament and Council relating to the type approval of motor vehicles regarding emissions from passenger cars and light commercial vehicles (Euro 5 and Euro 6), and Regulation (EU) 2018/858, which establishes a new framework for type approval modifying Regulations (EC) No 715/2007 and (EC) No 595/2009 on emissions from heavy-duty vehicles (Euro VI).
Additional directives regulate emissions from "off-road" vehicles (railways and inland waterways). Emissions from ships and aircraft are regulated internationally (by IMO and ICAO), with potentially stricter regulations in certain areas. Since January 1, 2020, the new IMO (International Maritime Organization) regulation on ship fuel came into force, imposing a maximum sulfur content of 0.5%, compared to the previous limit of 3.5%. This limit is less strict than that imposed in SECA (Sulfur Emission Control Areas), where the sulfur content limit has been 0.1% since 2015.
EMEP/EEA Air Pollutant Emission Inventory Guidebook 2019, EEA Report No 13/2019
(https://www.eea.europa.eu/publications/emep-eea-guidebook-2019)
ISPRA, Italian Greenhouse Gas Inventory 1990-2023, National Inventory Report 2025, Report 411/2025
(https://emissioni.sina.isprambiente.it/inventario-nazionale/)
Emission estimates calculated at a national average level may not exactly reflect the situation observed at the local scale; in particular, regarding the spatialization methodology adopted for road transport, the effects of the higher prevalence of newer vehicles compliant with the latest anti-pollution regulations in Northern Italy are not taken into account.
-
ISPRA
ISPRA: https://emissioni.sina.isprambiente.it/inventario-nazionale/
National
1990 - 2023
The estimation of pollutant emissions from the transport sector is carried out based on the methodology outlined in the EMEP/EEA Air Pollutant Emission Inventory Guidebook, a technical guide adopted at the European level for the preparation of national emission inventories reported under the UNECE Convention on Long-range Transboundary Air Pollution (CLRTAP) and the EU NEC Directive. The estimates are produced using appropriate emission factors and applying sophisticated algorithms that, in turn, require the availability of numerous data, such as, for road transport: the number of vehicles, estimated annual mileage and average speeds, and detailed specifications related to technology, fuels used, and driving patterns broken down by vehicle type, engine capacity class or weight, Euro standard, and fuel type used (the COPERT model, promoted at the European level, is applied for estimating road transport emissions).
At present, a poor assessment is attributed due to the observed rebound in emissions following the pandemic crisis, mostly between 2021 and 2023. This is primarily attributable to the persistent critical issues characterizing the transport sector from an emissions standpoint, including the still significant contribution of transport to the total national emissions for many pollutants, the predominance of the road transport mode, the ongoing discrepancies between type-approval emission values and real-world on-road emissions, and the uncertainties associated with the emission estimates.
A positive evaluation is attributed to the trend due to the overall progress recorded over the years in the emissions of air pollutants. In Italy, emissions from transport for the analyzed pollutants are decreasing, particularly harmful emissions from road transport, which have significantly declined in recent years thanks to the introduction of catalytic converters, fine particulate filters, and other vehicle technologies such as canisters aimed at reducing evaporative emissions. The introduction of unleaded gasoline has led to a substantial reduction in lead emission levels. Sulfur oxide emissions, now almost absent in road transport, remain significant in maritime transport.
| Data |
|---|
Headline
Table 1: Benzene emissions from the transport sector, by mode of transport Data source
ISPRA Note
The data come from the National Inventory of Air Pollutant Emissions. The time series has been recalculated consistently with the annual update of the Inventory. |
Headline
Table 2: PM2.5 emissions from the transport sector, by mode of transport Chiedi a ChatGPT Data source
ISPRA Note
The data come from the National Inventory of Air Pollutant Emissions. The time series has been recalculated consistently with the annual update of the Inventory. Emissions from tire, brake, and road surface wear are considered separately. |
Headline
Table 3: Sulfur oxide emissions from the transport sector, by mode of transport Data source
ISPRA Note
The data come from the National Inventory of Air Pollutant Emissions. The time series has been recalculated consistently with the annual update of the Inventory. |
Headline
Table 4: Nitrogen oxide emissions from the transport sector, by mode of transport Data source
ISPRA Note
The data come from the National Inventory of Air Pollutant Emissions. The time series has been recalculated consistently with the annual update of the Inventory. |
Headline
Table 5: Non-methane volatile organic compound (NMVOC) emissions from the transport sector, by mode of transport Data source
ISPRA Note
The data come from the National Inventory of Air Pollutant Emissions. The time series has been recalculated consistently with the annual update of the Inventory. |
Headline
Table 6: Lead emissions from the transport sector, by mode of transport Data source
ISPRA Note
The data come from the National Inventory of Air Pollutant Emissions. The time series has been recalculated consistently with the annual update of the Inventory. |
Headline
Table 7: Percentage share of emissions of selected pollutants by type of traffic Data source
ISPRA Note
The time series has been recalculated consistently with the update of the National Inventory of Air Pollutant Emissions. |
Thumbnail
Headline
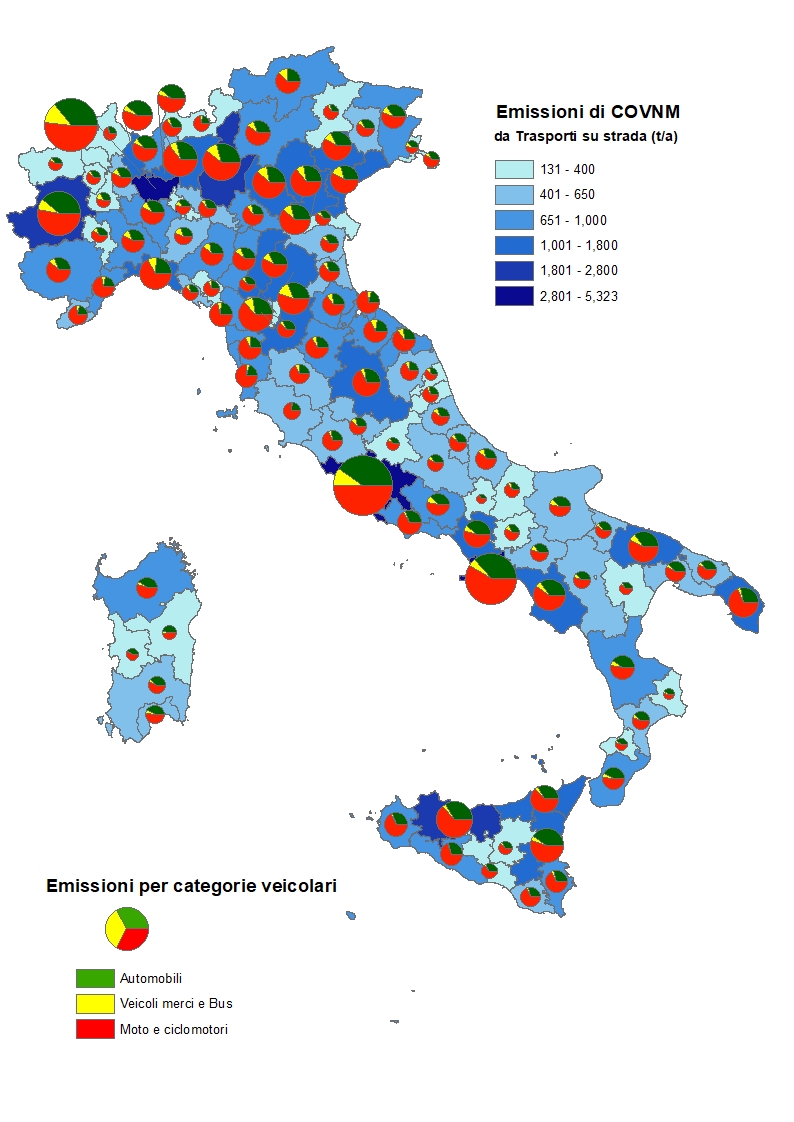
Figure 1: Non-methane volatile organic compound (NMVOC) emissions from road transport in 2023 Data source
ISPRA |
Thumbnail
Headline
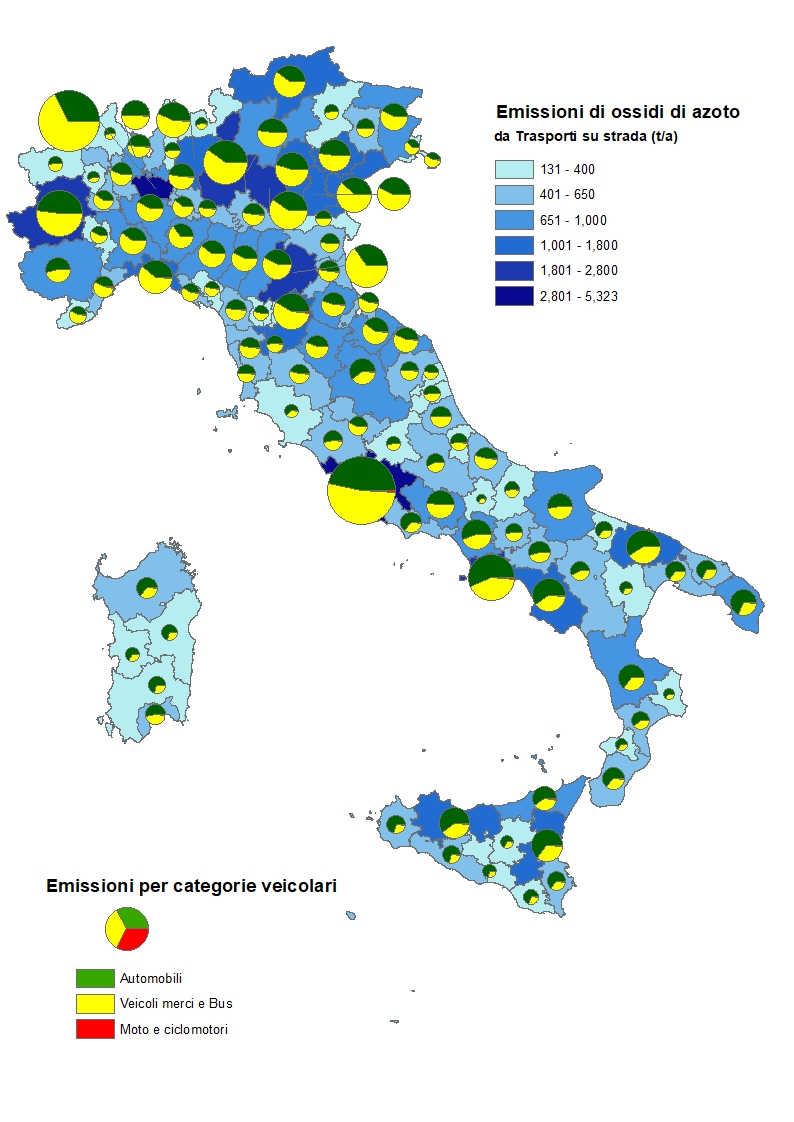
Figure 2: NOx emissions from road transport in 2023 Data source
ISPRA |
Thumbnail
Headline
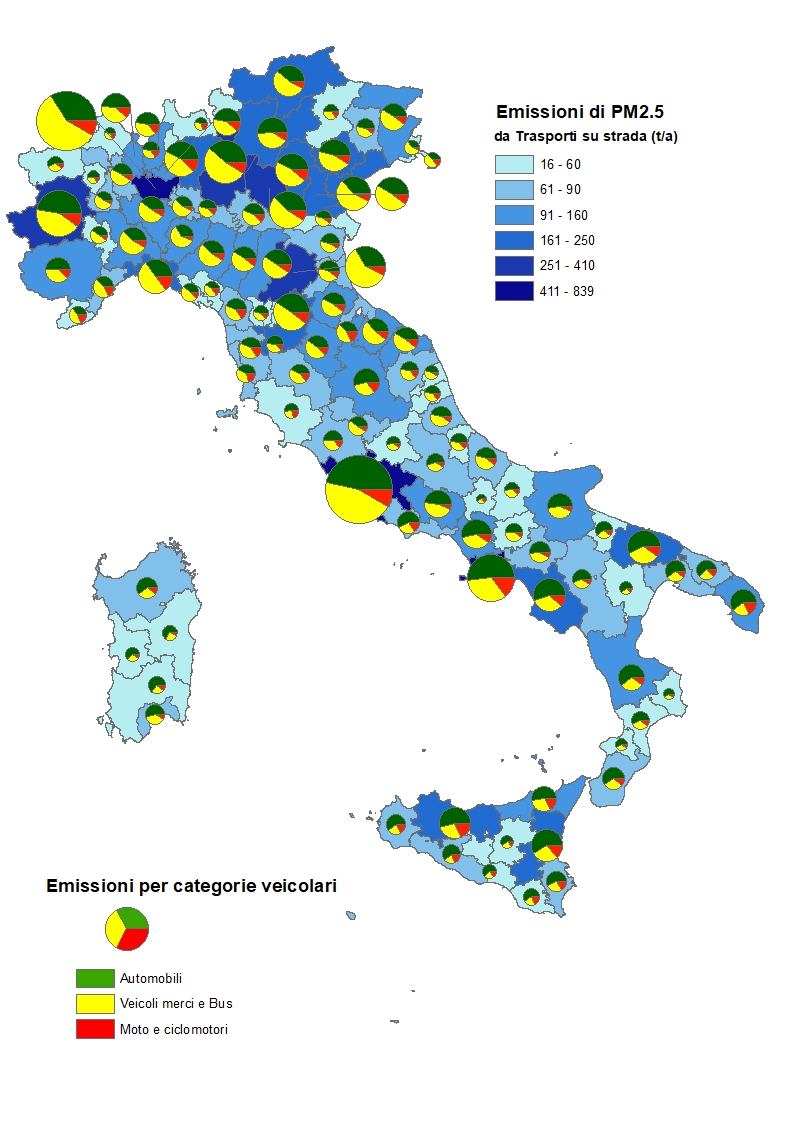
Figure 3: PM2.5 emissions from road transport in 2023 Data source
ISPRA |
The emission estimation methodology has been updated over the years; in particular, the emission contribution from road traffic has been revised multiple times based on results obtained from on-road vehicle testing. In most cases, from 2021 onwards, there has been a rebound in emissions compared to 2020, when the observed contraction—more pronounced for passenger transport than for freight—is primarily attributable to the pandemic crisis.
Observing the data reported in Tables 1 to 6 for each of the main pollutants, the following can be noted:
The most significant reduction in emissions of a pollutant was recorded for lead emissions (-99.0% from 1990 to 2023), which have practically been eliminated thanks to the market ban, since 2002, of leaded gasoline containing tetraethyl lead in road transport (Table 6). In 2023, lead emissions increased by 0.4% compared to the previous year. Analysis of lead emissions by vehicle type shows that the current main source is wear from tires and brakes (97.1%).
Benzene emissions decreased by 96.7% over the period 1990-2023, thanks to the reduction in benzene content in gasoline and the use of catalytic converters (Table 1). Nonetheless, current overall emissions of this carcinogenic substance remain significant and are mainly due to vehicles without catalytic converters or with very old converters, two-wheel vehicles, and maritime activities. In 2023, benzene emissions decreased by 4.0% compared to 2022. Analysis by source shows that the largest share comes from passenger cars (44.4%); mopeds and motorcycles contribute 22.5%, and maritime activities 12.8%.
Emissions of non-methane volatile organic compounds (NMVOCs) (Table 5 and Figure 1) decreased by 87.6% from 1990 to 2023; in 2023, an estimated 1.0% decrease occurred compared to the previous year (Table 5). Analysis of NMVOC emissions by vehicle type shows that the main contributions come from evaporative emissions from gasoline engines (49.6%), mopeds and motorcycles (24.0%), passenger cars (12.9%), and maritime activities (9.2%) (Table 5).
Fine particulate matter (PM2.5) emissions (Table 2 and Figure 3) decreased by 69.9% over the period considered, with a 4.4% decrease in the last year. In 2023, the largest PM2.5 contributions came from maritime activities (35.1%), tire, brake, and road surface wear (40.2%), and passenger cars (10.3%) (Table 2). Overall, transport contributes 14.2% (19.7 kt) to the national total primary PM2.5 emissions of 139.0 kt in 2023.
Nitrogen oxides (NOx) emissions from the transport sector (Table 4 and Figure 2) decreased by 71.3% from 1990 to 2023. Between 2022 and 2023, emissions declined by 5.8%. In 2023, emissions mainly derive from passenger cars (33.4%), maritime activities (27.2%), and heavy vehicles over 3.5 tons and buses (24.2%). Transport contributes the largest share (322.6 kt) of total national NOx emissions, which amount to 557.4 kt (57.9% in 2023).
Sulfur oxide (SOx) emissions have decreased over the years due to the reduction of sulfur content in fuels. Over the period considered, transport emissions (Table 4) decreased by 95.7%, with a 13.0% decrease in the last year. The main source is maritime activities, which account for 88.6% of transport-related SOx emissions in 2023. The sector contributes 12.6% (9.1 kt) to the national total SOx emissions, which amount to 71.9 kt.
Regarding the division of emissions between freight and passenger transport (Table 7), the data are not unequivocal and must be examined for each major pollutant. In 2023, for nitrogen oxides, the passenger traffic contribution is about 40.2%, while freight traffic, with 59.0%, is the main emission source. Passenger traffic was the main source until 1999; since 2000, freight traffic has taken over due to slower fleet renewal and less impactful emission reductions prescribed by regulations. For NMVOCs, passenger traffic remains the main source (87.3% in 2023), mainly due to passenger cars and motorcycles/mopeds (Table 5); freight transport contributes 12.2% of total transport emissions in 2023. Finally, for PM2.5, freight traffic accounts for 56.8% of emissions in 2023. Between 2013 and 2017, there was a slight reduction in freight traffic’s contribution, attributable to the spread of diesel passenger cars that increased the passenger transport share and significant emission reductions from Euro IV and later freight vehicles. From 2018 to 2020, the freight transport percentage contribution increased, while in the last two years lower percentage contributions are estimated. The new Euro 6 (passenger) and Euro VI (freight) standards further reduce overall diesel vehicle emissions for both freight and passenger transport.