UN - SDG Goals
Goal 15: Life on land
Proteggere, ripristinare e favorire un uso sostenibile dell’ecosistema terrestre, contrastare la desertificazione, arrestare il degrado del terreno, fermare la perdita della diversità biologica.
The wildfire phenomenon, analyzed on the basis of data collected from 1970 to 2024 by CUFA of the Carabinieri Corps (formerly the State Forestry Corps), shows a fluctuating trend, with peak years (1993, 2007, 2017, 2021) alternating with periods of decline (2013, 2014, 2018, 2024).
Wildfires occurring within Protected Areas (recorded since 2003), although showing annual fluctuations, remain at high levels, with an average of 11,000 hectares burned over the last three years.
The incidence of deliberately caused fires is very high, representing about half of all recorded events and exceeding 60% in some years.
Land fragmentation is the process that leads to a progressive reduction in the surface area of natural and semi-natural environments and to an increase in their isolation. This process, which transforms large territorial patches into smaller and more isolated units, is mainly driven by urban expansion—implemented through more or less sustainable development patterns—and by the growth of infrastructure networks aimed at improving connectivity between urbanized areas through linear works. In 2024, 42.41% of the national territory was classified as having high or very high fragmentation. The regions with the largest share of very highly fragmented land are Veneto (39.73%), Lombardy (33.73%), Emilia-Romagna (25.22%), Puglia (25.22%), and Campania (25.76%). These figures confirm the close relationship between fragmentation and urbanization density.
Both the number of protected areas and the extent of protected marine surface have steadily increased over time. At present, 30 Marine Protected Areas (MPAs) have been established in Italy, across 10 Italian regions, along with a further 10 areas protecting coastal marine stretches.
Sicily and Sardinia host the largest share of marine protected areas, both in terms of number and area of protected surface. Between 2012 and 2023, at the national level, the surface of Marine Protected Areas (MPAs) increased by 3.1%, following the establishment in 2018 of the two MPAs of Capo Testa–Punta Falcone in Sardinia and Capo Milazzo in Sicily, and in 2023 of the Capo Spartivento MPA in Sardinia.
The European Commission adopted the EU Biodiversity Strategy for 2030 (EBS 2030, COM(2020) 380 final), which calls on Member States to protect at least 30% of national land territory and 30% of marine areas, with at least one third of these areas under strict protection. These objectives have been incorporated into the Italian National Biodiversity Strategy for 2030 (NBS 2030).
This indicator integrates spatial data relating to the main biodiversity protection systems in Italy (protected areas and the Natura 2000 Network). It calculates the extent of Italian territory currently protected on land and at sea, assesses changes from 1991 to 2024, and shows the gap between the percentage of protected land and marine areas and the 30% target set by the EBS 2030.
After removing overlaps between protected areas and Natura 2000 sites, national protected coverage currently amounts to approximately 4,071,482 hectares at sea, corresponding to 11.6% of Italian territorial waters and the Ecological Protection Zone (EPZ), and about 6,532,887 hectares on land, corresponding to 21.7% of Italian territory. The extent of overlapping areas—those falling both within a protected area and a Natura 2000 site—has increased over time, reaching 893,839 hectares at sea and 2,447,065 hectares on land in 2024. Trends show that the national percentage of protected surface has stabilised since 2006 for marine areas and since 2011 for terrestrial areas. To achieve the 30% target set by the EBS 2030, an additional gap of about 18% of marine surface still needs to be protected (around 6,600,000 hectares), along with 8% of terrestrial surface (around 2,500,000 hectares).
The indicator quantifies soil consumed as a result of a change from a non-artificial soil cover to an artificial soil cover, according to the principle of net land take, i.e. net of transformations from consumed soil back to non-consumed soil (generally the restoration of construction sites and other areas that in the previous year fell under reversible soil consumption).
Gross soil consumption recorded in 2024 affected 8,370 hectares of territory, causing the often irreversible loss of natural, semi-natural, and agricultural areas and their related ecosystem services.
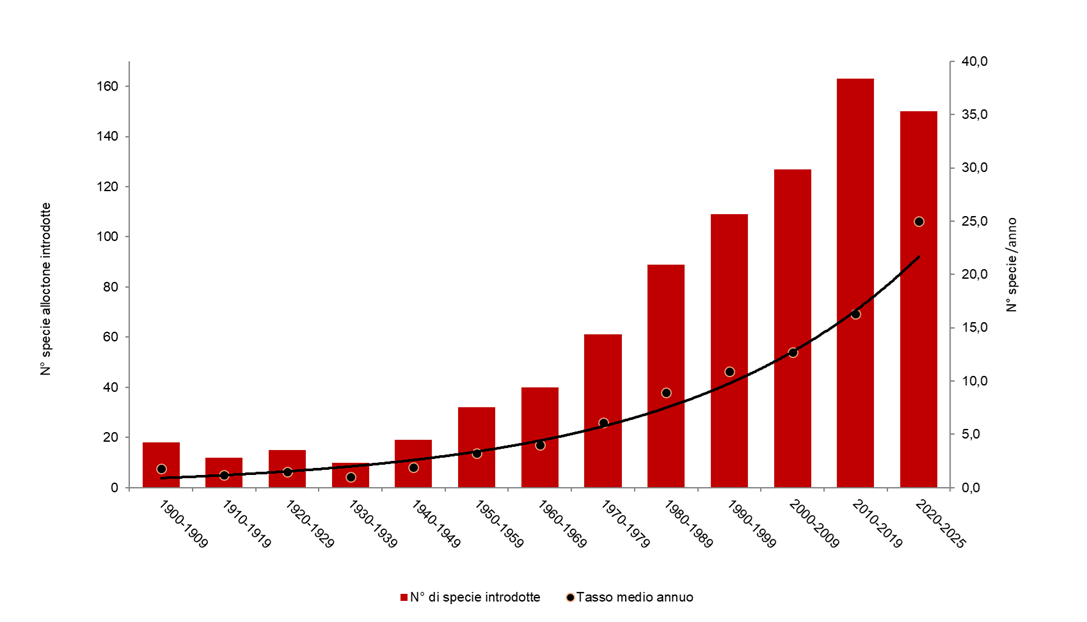
The indicator provides an overview of the current presence of alien animal and plant species in Italy, describing their numbers and trends in introductions over the past century. It reports the average annual introduction rate (the mean number of new alien species introduced each year), the main pathways of introduction (according to CBD categories), and the distribution of invasive alien species of Union concern.
The number of alien species in Italy is steadily and continuously increasing. Based on the data currently available, more than 3,800 alien species have been introduced into the country, of which 3,699 are currently established in the territory. The average number of species introduced per year has grown exponentially over time — from 6 species per year in the 1970s, to 16 per year in the previous decade, and reaching 25 per year in the current one. The cumulative number of alien species introduced in Italy since 1900 also confirms this exponential trend, showing an increase of over 500% in 120 years.
The anthropogenic pressure exerted on forest ecosystems in recent decades, driven in part by the increasing use of woody biomass for bioenergy, technical applications, and construction, has led to the degradation of many natural and semi-natural systems, particularly in tropical regions. These phenomena are frequently associated with the unsustainable and/or illegal exploitation of forest resources. The harvesting, processing, and transportation of wood and its derivatives can generate significant negative impacts on the environment, as well as at local and global economic and social levels. Over the last twenty years, focus has turned toward the sustainable use of forest biomass, stimulating concrete actions and effective tools aimed at preventing such impacts and mitigating their effects. These virtuous initiatives have involved political decision-makers, private companies, associations, and individual citizens. Forest certification emerged as a tool designed to prevent negative impacts and threats to national and international forest heritage through the adoption of appropriate practices based on the careful planning and monitoring of woody biomass management and use.
In Italy, as of 31 December 2024, the forest area certified under the Programme for the Endorsement of Forest Certification (PEFC™) scheme reached 1,061,059 hectares (representing an increase of nearly 8% compared to 2023). Meanwhile, the area certified under the Forest Stewardship Council® (FSC®) scheme totaled 115,118 hectares (a 35% increase over the previous year)
In Italy, a total of 843 terrestrial protected areas (including those with a coastal component) have been established to date, covering more than 3 million hectares, equivalent to about 10.5% of the country’s land surface. An analysis of the historical series (1922–2024) shows consistently positive trends—particularly from the mid-1970s—in both the number and the extent of terrestrial protected areas, while growth trends have tended to stabilize since 2008–2009.
Natura 2000 Network, established under the EU Habitats and Birds Directives (collectively known as the Nature Directives), comprises 2,649 sites in Italy. These cover a total terrestrial area of 5,845,489 hectares, representing 19.4% of the national territory, and a marine area of 2,338,693 hectares, corresponding to 6.5% of national jurisdictional waters (territorial waters and EEZs) (data updated to December 2024).
The Network is essential for implementing the Nature Directives, but it is also a key instrument for achieving the targets set by the European and National Biodiversity Strategies for 2030 (EBS2030 and NBS2030), which call for at least 30% of terrestrial and marine areas to be protected. In addition to the Natura 2000 sites, other protected areas—such as national and regional parks and other designated conservation zones—also contribute to these targets.
This report analyses the regional distribution of the Network both in absolute terms (hectares covered by sites within each region) and as a percentage of total regional area. Across Italian regions and autonomous provinces, the Network shows a heterogeneous distribution, with protected terrestrial and marine areas ranging from 12% (Emilia-Romagna) to 36% (Abruzzo) on land, and from less than 1% (Marche) to 31% (Apulia) at sea.
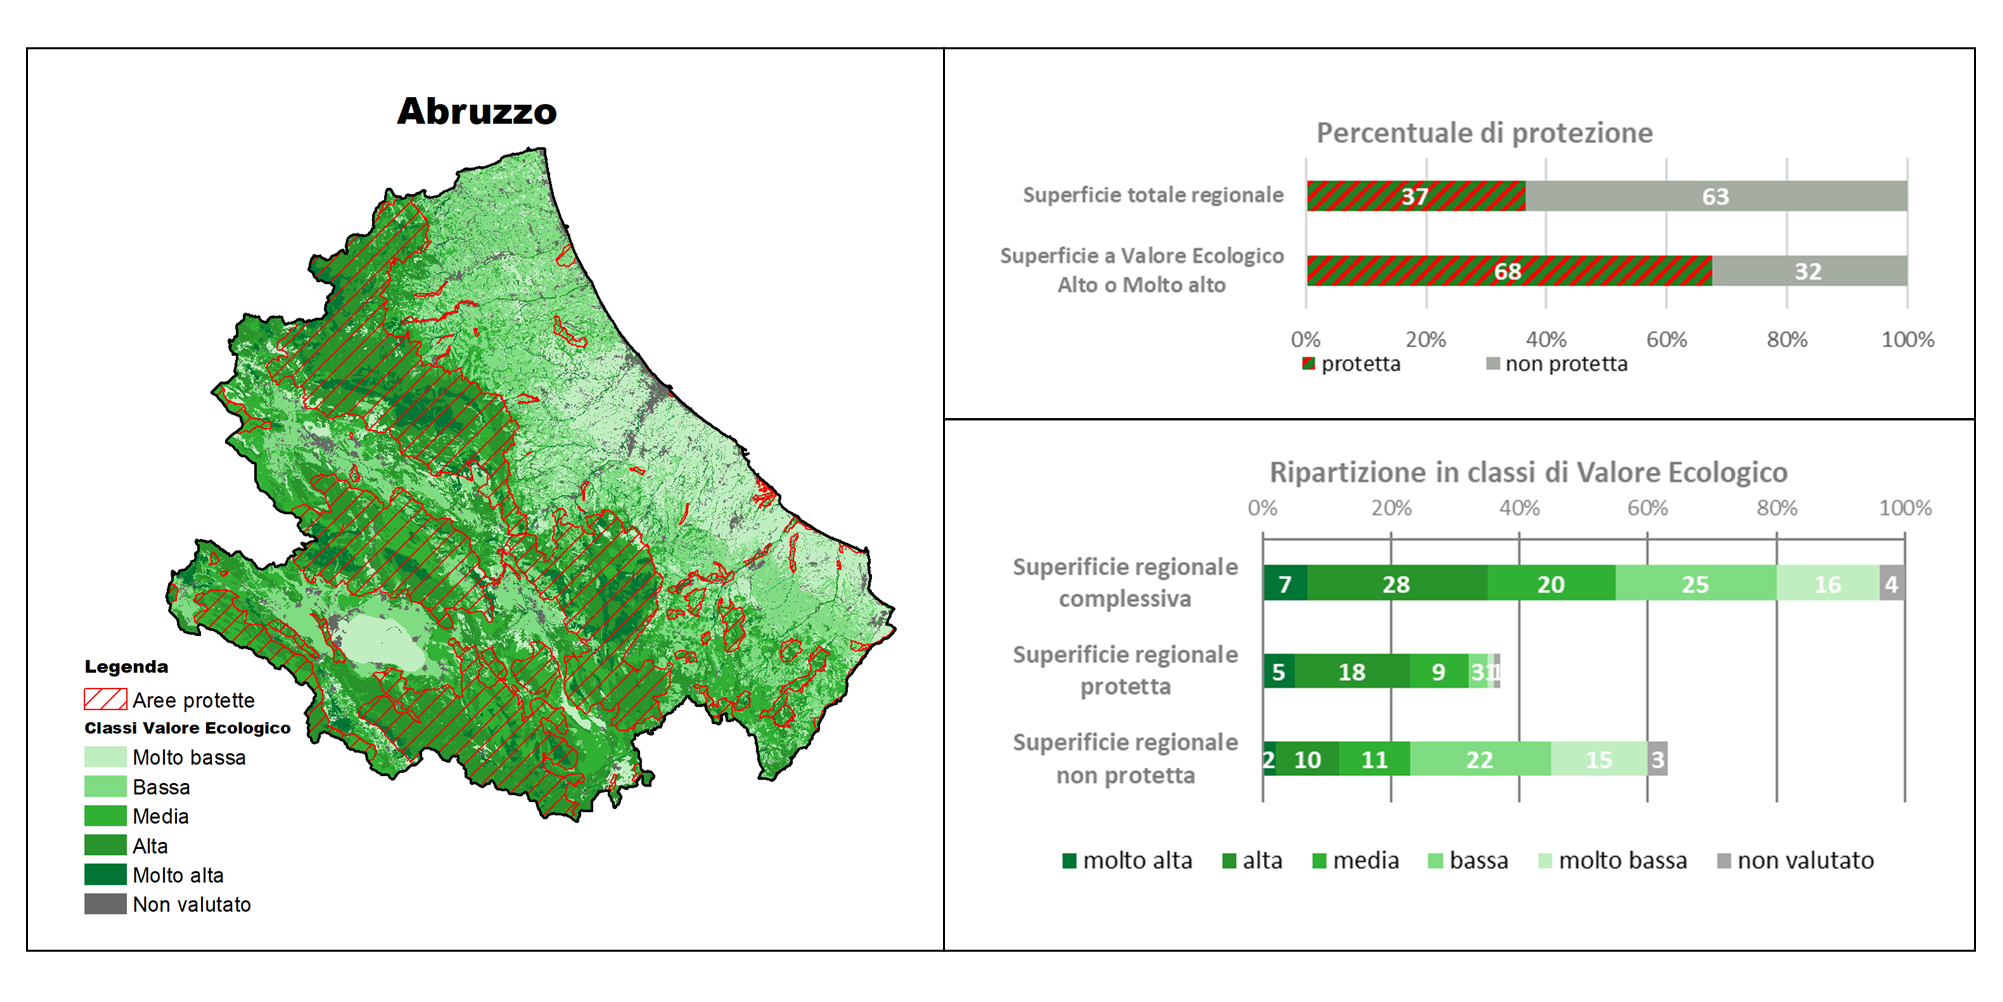
The indicator, based on data processed within the Carta della Natura project, shows the distribution of Ecological Value (VE) across 17 Italian regions, providing a representation categorized into different classes. Ecological Value is understood as a synonym for natural significance and is calculated—starting from the regional habitat maps—for each mapped polygon, excluding those referring to built environments and fully urbanized areas. This indicator offers an overview of the environmental mosaic within various regional contexts, highlighting high-value areas, including their protection status. The analysis presents the percentage of protected areas in each region and the composition of protected and unprotected zones in terms of Ecological Value. The protected areas system (EUAP areas, Natura 2000 sites, and Ramsar areas) covers territories characterized by the highest Ecological Value classes but still leaves significant portions outside protected areas.
The indicator examines the series of data relating to forest areas affected by large fires on a national, regional and protected area scale over the period 2018 to 2024.
The distribution and extent of forest areas affected by fires generally show significant interannual variability. In particular, 2024 was a year less severely affected by the extent of forest areas impacted by fires compared to previous years. The forest area burned was higher only than that burned in 2018 and 2019, but significantly lower than all the years from 2020 to 2023.
In 2024, the most affected regions were Sicily (2,588 ha), Calabria (2,494 ha) and Sardinia (1,734 ha), which together accounted for 66% of the total national forest area affected by fires.
The most affected forest classes are evergreen broadleaved forests (e.g., holm oak woods and Mediterranean scrub), followed by deciduous broadleaved forests (e.g., oak and beech forests), and much less by coniferous forests (e.g., pine, fir, and larch forests).
Linear regression analysis of the national forest cover series affected by fires does not show an increasing trend, although the size of the series does not allow for medium- and long-term evaluations. A weak but statistically significant increasing trend was instead observed for the regions of Apulia, Basilicata and Calabria.
This indicator provides a national overview of the conservation status of 268 breeding bird species assessed in the reporting under Article 12 of the Birds Directive 2009/147/EC. The assessment includes species of community interest listed in Annexes I and II of the Directive, as well as those that justify the designation of Special Protection Areas (SPAs).
At the national level, the percentage of species with a favourable conservation status increased from 51% (reporting period 2007-2012) to 56% (reporting period 2013-2018). However, this increase was insufficient to meet the target set by the EU Biodiversity Strategy 2020 (76%).
The short-term population trends, which reflect processes occurring in the last decade, indicate that 46% of species are increasing or stable, while nearly 25% of species are in decline (the population trend of the other 33% remains unknown). Regarding short-term trends in distribution range, the proportion of declining species is lower, as only the most severe declines result in range contractions: 21% of species show a contraction, while the remaining 79% have stable or expanding ranges.

The index evaluates the percentage of vegetation cover in mountain areas, defined according to the six altitude classes with elevations above 300 m above sea level proposed by FAO in 2015 (UNEP-WCMC). The data is expressed in terms of total mountain vegetation area and with reference to the distinction between natural and agricultural areas.
The analysis reveals a significant presence of vegetated areas, especially in classes 5 and 6, which are between 300 and 1,500 m above sea level. The changes observed are mostly associated with a reduction in vegetated areas, while increases are recorded in higher altitude bands, with a maximum of just over 1,800 hectares in Veneto and slightly more than 1,000 hectares in Lombardia. Significant increases in mountain vegetation cover are also found in Marche and Tuscany, which, together with Lombardia and Veneto, are the only regions showing an overall increase in mountain green areas, net of reductions.
Italy hosts a remarkable floristic heritage, both in terms of species and subspecies richness (2,815 lichens, 1,209 bryophytes, and 8,241 native vascular entities) and biogeographical value. Of the 8,241 Italian vascular plant,1,702 species (equal to 20.65%) are endemic, meaning they exist exclusively in the country. Among these, 1,128 species are regionally endemic, with their range restricted to a single Italian region (data updated to April 2024).
The indicator also highlights the IUCN risk status of 2,430 vascular plant entities (representing 29.5% of Italy’s vascular flora), identifying the main threats affecting them. Unfortunately, the overall conservation status cannot be considered satisfactory: 2.2% (54 species) of the 2,430 evaluated entities are extinct or likely extinct; 24.3% (590 species) are at risk of extinction.
Human-induced pressures related to land-use changes represent a major driver of plant species extinction risk. The Red List of vascular flora identifies the most critical pressures affecting species: Modification of natural systems (39% of the 2,430 assessed taxa are subject to this pressure);
Agricultural development (27%); Residential development (27%); Direct human disturbance in natural environments (20%).

The indicator illustrates the conservation status and trends of Italian species protected under Directive 92/43/EEC (Habitats Directive) and is based on the summary results of the 4th Italian report for the period 2013-2018, submitted to the European Commission in 2019. The report covers a total of 349 species (232 animal species and 117 plant species) of Community interest present in our territory and seas. In the 4th report, a total of 337 distribution maps and 619 reporting forms were produced (one for each species in every biogeographical region where it is present). The 2019 assessments show that over half of the terrestrial and inland water species, 54% of the flora, and 53% of the fauna, as well as 22% of the species evaluated in the marine context, have an unfavourable conservation status (inadequate or poor). A comparison between the two most recent reporting periods (2007-2012 and 2013-2018) reveals no improvements in the conservation status of the species. The only positive signal is the increase in knowledge, with a decrease in cases where the conservation status was unknown. The indicator highlights the urgent need for greater commitment to the conservation of species protected by the Habitats Directive, in relation to the target of the European Biodiversity Strategy to 2030, which sets out that at least 30% of species and habitats in unfavourable conservation status should improve their status by 2030 or show at least a trend of improvement.
In order to assess whether protected areas have been designated based on scientific criteria, including ecologically representative areas (Margules & Pressey, 2000; Maxwell et al., 2020), the overlap between terrestrial protected areas in our country and Key Biodiversity Areas (KBA, IUCN, 2016) has been calculated. The protected areas considered include those in the data bank of the Common Database on Designated Areas (CDDA) (now Nationally designated areas of Europe - NatDA), and the Natura 2000 Network. KBAs identify key areas for biodiversity conservation and, according to the European Commission’s guidance document on achieving the 30% target ("Criteria and guidance for protected areas designations," Brussels, 28/1/2022), are among those to be considered for designation as protected areas. The indicator used corresponds to the one adopted internationally to evaluate progress toward the Sustainable Development Goals (SDGs) for 2030 (SO4-3.T1: National estimates of the average proportion of Terrestrial KBAs covered by protected areas in %).
The results indicate that, after accounting for overlaps between CDDA protected areas and Natura 2000 sites, 75.20% of the national terrestrial protected area overlaps with KBAs identified at the national level, demonstrating a fair inclusion of important biodiversity areas.
The Italian fauna is estimated to include over 58,000 species, with the total number reaching approximately 60,000 taxa when considering subspecies. However, this biodiversity is under threat, as indicated by IUCN assessments and population trends. Among the 672 species of Italian vertebrates (576 terrestrial and 96 marine), 6 are extinct in Italy, and 161 are threatened with extinction (accounting for 28% of the assessed species). Different vertebrate groups show varying percentages of risk: 2% for marine bony fish, 19% for reptiles, 21% for cartilaginous fish, 23% for mammals, 36% for amphibians, and up to 48% for freshwater bony fish (considering the CR+EN+VU IUCN categories). Additionally, terrestrial and marine vertebrate populations are generally declining by 27% and 22%, respectively.
Breeding birds are the only group for which two IUCN assessments have been conducted, seven years apart. Of the 278 species assessed in the latest 2019 evaluation, 5 are extinct, and 67 are threatened (compared to 76 in 2013), representing 26% of the evaluated species. Half of Italy's breeding bird species are not at immediate risk of extinction.
Among invertebrates, 9% of corals, 11% of dragonflies, 21% of saproxylic beetles, 6% of butterflies, and 11% of assessed bees are threatened with extinction. Invertebrates also show negative trends; for example, 16% of dragonfly populations are in decline, five times higher than those increasing.

Soil degradation refers to the reduction in the biological productivity of soil resources. This process is often intrinsically linked to biodiversity loss and the impacts of climate change. Assessing soil degradation requires considering multiple interdependent factors, each contributing differently to the phenomenon.
In recent years, Italy has participated in the pilot project on Land Degradation Neutrality (LDN), promoted by the United Nations Convention to Combat Desertification (UNCCD), and in the LDN Target Setting Programme, which supports countries in identifying voluntary LDN targets and defining associated measures to achieve Sustainable Development Goal (SDG) 15.3. This goal is monitored through the "Proportion of degraded land over total land area" (SDG Indicator 15.3.1).
For the assessment of this indicator in Italy, three sub-indicators proposed by UNCCD under the LDN framework have been adopted:
- Land cover change
- Soil productivity index
- Soil organic carbon content
Additionally, further indices and parameters relevant to the Italian context and available at the national level have been considered. The results show that in 2019, the proportion of degraded land in Italy, excluding water bodies, was 17.4%, according to the UNCCD methodology. Furthermore, nearly 56,000 km² (approximately 18.5% of the national territory) experienced increased degradation between 2006 and 2019.

The Italian wetlands currently included in the official list of sites under the Ramsar Convention are 57, covering a total of 72,288 hectares. Additionally, three Ministerial Decrees were issued in 2011, 2013, and 2016 for the establishment of nine more areas. In total, the 66 Italian Ramsar sites (57 designated and 9 in the process of designation) are distributed across 15 regions, covering 79,826 hectares. The regions with the largest and most numerous areas are Emilia-Romagna (10 areas, 23,112 ha), Tuscany (11 areas, 19,306 ha), and Sardinia (9 areas, 13,308 ha).
The level of implementation of protection and management measures for these areas is not sufficiently known, despite being essential to ensure the conservation of habitats, flora, and fauna.