HYDROLOGICAL DROUGHT
Data aggiornamento scheda:
The maps of Standardized Precipitation Index (SPI) at 12 months provide a national and large-scale assessment of hydrological drought conditions, obtained using rainfall data collected and published by the regional hydro-meteorological services and those of the autonomous provinces and those of the abolished National Hydrographic and Mareographic Service (SIMN, now merged into ISPRA) of the Department for National Technical Services. The 12-month aggregation time step chosen for the SPI evaluation is the one that best describes the effects of drought (precipitation deficit) on river flow, reservoir recharge and the availability of water in aquifers.
In 2025, the 12-month SPI maps (SPI12) continued to highlight drought conditions for the Central-Southern territories and the major islands, even if these conditions, on an annual scale, were less severe than in previous years and very localized. In terms of SPI12, the months of January, September and October 2025 were those most characterized by drought conditions, from extreme to moderate, although the percentage of Italian territory affected by such conditions was just over 10%. Northern Italy was, however, characterized by situations of mostly severe (1.5 ≤ SPI < 2.0) and locally extreme humidity (SPI12 ≥ 2.0).
Central, Southern Italy and the major islands, due to the rainfall deficits and high temperatures also recorded in 2025, as well as the drought conditions already reported starting from the second half of 2023 and then in 2024, continued to have problems related to the use of water resources (water stress) with environmental and socio-economic impacts.
INTERNAL FLOW
Data aggiornamento scheda:
The indicator Internal flow provides the annual estimate, expressed in mm, of the quantity of renewable water resource that is naturally produced in a given area as a result of rainfall. The indicator is calculated for each year from 1951 to 2025.
In 2025 the value of the indicator at national level is 423.8 mm, corresponding to 128 billion cubic metres. The average value of the indicator compared to the national territory of the last thirty climatological years 1991–2020 is 442.6 mm, corresponding to 133.7 billion cubic meters, while the long-term average 1951–2025 (so-called LTAA‒ Long-Term Annual Average ) is 457.2 mm, corresponding to 138.1 billion cubic meters.
2025 was characterized by a negative anomaly of the renewable water resource both compared to the long-term average (–7.4%) and compared to the last thirty climatological years (–4.3%). The gap increases if the data is compared with the value of the indicator estimated in 2024, equal to 524.2 mm (–19.2%). At a national level, the availability of renewable water resources continues to show a statistically significant negative trend from 1951 to today.
PERCENTAGE OF ITALIAN TERRITORY SUBJECT TO PRECIPITATION DEFICIT AND SURPLUS
Data aggiornamento scheda:
The indicator provides an evaluation of humidity conditions ( precipitation surplus compared to climatology ) and drought ( precipitation deficit compared to climatology ) to which the national territory is subject, in terms of status and trends. For each month from 1952 to 2025, the percentage of Italian territory subject to deficit and/or surplus precipitation conditions is expressed using the Standardized Precipitation Index (SPI) relating to the aggregate precipitation on the 3 and 12 month time scale.
Overall on a national scale, 2025 was characterized by substantially average precipitation, where however Northern Italy recorded a surplus while Central Italy, the South and the major islands continued to be characterized by a precipitation deficit, although less burdensome than the previous year.
This determined maximum percentage values of the national territory characterized by "extreme drought" (SPI ≤ –2.0) equal to 0.86% and 0.5%, respectively for the cumulative precipitation over 3 months and that cumulative over 12 months. The maximum percentage of national territory characterized by "severe or moderate drought" (–2.0 < SPI ≤ –1.0) was, however, 31.6% on a time scale of 3 months and 12.2% on a time scale of 12 months. On the other hand, on the 3-month time scale, maximum values in the year of the percentage of the national territory characterized by "extreme humidity" (SPI ≥ 2.0) were 3.0%, while the maximum value relating to "severe or moderate humidity" (1.0 ≤ SPI < 2.0) was equal to 28.6%. On a 12-month time scale, the percentage of the country affected by “extreme humidity” reached a high of 10.4%, while the percentage with “severe or moderate humidity” reached a high of 30.6%.
REAL EVAPOTRANSPIRATION
Data aggiornamento scheda:
The indicator provides, for each month and for the entire year, the evaluation of the cumulative monthly and annual water height, expressed in mm, compared to the surface of the national territory which actually transfers into the atmosphere due to the phenomena of evaporation from liquid mirrors and from the ground and transpiration of vegetation and, therefore, does not contribute to the formation of the renewable water resource.
In 2025, the estimated value of the total annual real evapotranspiration was equal to 537.5 mm, with an anomaly of +8.9% compared to the average value of the period 1951–2025 estimated at 493.6 mm.
RUNOFF INDEX
Data aggiornamento scheda:
The indicator provides on an annual basis the evaluation, expressed as a percentage, of the relationship between the annual volume of runoff (surface runoff) and the annual volume of precipitation. This indicator aims to provide an evaluation of the quantity of water that is directly transformed into surface runoff compared to the total rainfall and to evaluate the long-term trend, also in relation to the possible impact due to climate change. The annual values of the indicator are also compared with the corresponding average value calculated over the entire period 1951–2025.
The analysis of the data for 2025 highlights an indicator value of 24.4%, remaining below the long-term historical average (25.2%). This finding marks a change in trend compared to 2024, the year in which an above-average value was recorded (26.2%). Despite this decline, the data still remains above the critical level of 2022, when the historical series had reached its second absolute minimum (18.5%).
STANDARDIZED HYDRO-CLIMATE BALANCE
Data aggiornamento scheda:
The maps of Standardized Precipitation-Evapotranspiration Index (SPEI) at 12 months provide a national and large-scale assessment of drought conditions and are obtained by analyzing the deviation of the hydrological variable hydro-climatic balance , consisting of the difference between precipitation and potential evapotranspiration, and its reference climatology.
In 2025, the 12-month SPEI maps (SPEI12) show drought conditions, from extreme to moderate, for the territories of central Italy and for the South and the major islands, but with a more limited extension compared to the previous year. The months from January to March 2025 were those most characterized by extreme drought conditions on the 12-month time scale (SPEI12 ≤ –2.0), due to the precipitation deficit found in the second half of 2024, in particular on southern Italy on the Adriatic side. The maximum extension of the hydro-climatic balance deficit was reached in January, with 8.4% of the Italian territory affected by extreme drought, which continued to reduce over the course of the year. The maximum extent of areas characterized by severe or moderate drought on the 12-month time scale (–2.0 < SPEI12 ≤ –1.0) was detected in October with 34.7% while the minimum value was recorded in November with 21.3%.
The intensity and persistence of these conditions in 2025 had effects on the availability of water resources in different areas of Italy, consequently causing environmental and socio-economic impacts linked to the use of water.
POTENTIAL EVAPOTRANSPIRATION
Data aggiornamento scheda:
The indicator provides, for each month of the year, the evaluation, using the Thornthwaite method, of the cumulative monthly potential evapotranspiration water height on natural soil, expressed in mm, compared to the surface of the national territory.
In 2025, the estimated value of total annual potential evapotranspiration on natural soil was equal to 775.8 mm, deviating by +11% from the average value for the period 1951–2025, estimated at 695.9 mm.
GROUNDWATER RECHARGE
Data aggiornamento scheda:
The indicator evaluates the cumulative monthly and annual height of water (expressed in mm) that infiltrates deep into the ground following rainfall, compared to the surface of the national territory.
In 2025, total annual infiltration was estimated at 184.9 mm, corresponding to 55.8 billion cubic meters. This value was significantly lower than the average for the period 1951–2025, estimated at 215.7 mm (corresponding to 65.2 billion cubic meters), marking a negative anomaly of approximately –14.3%.
PRECIPITATIONS
Data aggiornamento scheda:
The indicator provides the evaluation, expressed in mm, of the height of water, compared to the surface of the national territory, which falls to the ground (both in liquid and solid form) for each month and for the entire year.
The indicator relating to 2025 is compared, for each month of the year, with the corresponding average values for the period 1951–2025 obtained using the same methodology. In 2025, the value of total annual precipitation in Italy was 962.9 mm (290.9 billion cubic metres), 1% greater than the corresponding long-term average value (LTAA- Long-Term Annual Average ) and 2% compared to the annual average over the last thirty climatological years 1991–2020.
Going down to the regional and district level, the situation is very diversified, with Northern Italy being affected in 2025 by quantities of precipitation higher than the long-term averages. On the other hand, the precipitation anomaly compared to the LTAA was negative in the Center and South and the major islands.
WATER ABSTRACTION FOR CIVIL USE
Data aggiornamento scheda:
The indicator refers to 2022 and is drawn up on the basis of Istat data relating to the last “Nable Review for Civil Use” carried out in 2023 and published in 2024. The information is provided on a national, regional and by hydrographic district, divided in turn into removal from the surface and underground body water. The levy values are compared with those detected in the previous "Nail census for civil use" of 2020. Also in 2022, compared to the previous 2020 census, the water withdrawal for civil use in Italy has decreased slightly.
FLOWS
Data aggiornamento scheda:
The indicator provides an assessment of the trend of water volumes measured in bedside sections of some of the main Italian watercourses compared to the year and the previous decade. For 2021 it was possible to represent the data of scope for 6 sections of closure of as many waterways of national importance (Po, Arno, Adige, Bacchiglione, Serchio and Tiber). In 2021, the annual volumes drained in the measurement sections showed significant increases compared to 2020, with increases of between 6% and 25%, with the exception of the sections on the Adige and the Po.
AIR TEMPERATURE
Data aggiornamento scheda:
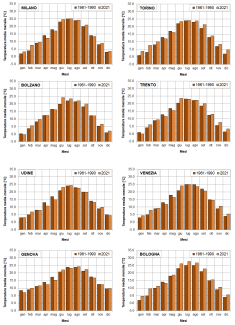
The indicator provides a representation of the trend of the average monthly temperatures recorded in the provincial capital city / region during 2021, compared with that of the average monthly temperatures calculated for the same locations over the thirty-year period 1961-1990. During 2021 there was a general increase in average monthly temperatures compared to the reference period, with exceedances of the reference values on average for 8 months and in particular in the summer and winter months. It is mainly the cities of the North where the temperature increases assume significant values in species in the months of February and December. It should be noted that in the months of April and October the temperature values, in most of the capitals, were on average lower than in the reference period.