Giovanni Braca, Stefano Mariani
The indicator provides an assessment of the humidity conditions (surplus of precipitation compared to climatology) and drought (deficit of precipitation with respect to climatology) to which the national territory is subject, in terms of state and trend. For each month from 1952 to 2024, the percentage of Italian territory subject to a deficit and/or precipitation surplus is expressed through the Standardized Precipitation Index (SPI) relating to aggregate precipitation on the time scale of 3 and 12 months.
The 2024 was characterized, overall on a national scale, by a surplus of precipitation, to which the high volume of precipitation that poured into northern Italy contributed. Central Italy, South and the major islands have, on the other hand, continued to be characterized by a precipitation deficit.
This resulted in the highest percentage values of the national territory characterized by "extreme drought" (SPI -2.0) equal to 0.5% and 16.1%, respectively for cumulative precipitation over 3 months and the cumulative one over 12 months. The maximum percentage of national territory characterized by "severe or moderate drought" (?2.0 ? SPI ?1.0) was, instead, 24.1% on a time scale of 3 months and 28.5% on a 12-month time scale. On the other hand, on the 3-month time scale, the maximum values in the year of the percentage of the national territory characterized by "extreme humidity" (SPI ? 2.0) were 14.1%, while the maximum value relative to "severe or moderate humidity" (1.0 ? SPI ? 2.0) was equal to 42.1%. On a 12-month time scale, the percentage of the country affected by "extreme humidity" reached a maximum value of 20.8%, while the percentage with "severe or moderate humidity" reached a maximum of 28.4%.
The indicator is based on the Standardized Precipitation Index (SPI) and assesses for each month the percentages of territory subject to moderate or severe drought conditions (–2.0 SPI – 1.0) or extreme drought (SPI –2.0) and the percentages of territory with moderate or severe humidity conditions (4.0 SPI 2.0 or extreme humidity (SPI 2.0) or extreme humidity (SPI ? 2.0). SPI values between –1.0 and 1.0 correspond to normal situations.
The application of the SPI on different time scales reflects the way drought impacts the availability of water resources: calculated over short periods (3 months) it provides indications on soil moisture, while on medium or long periods (12 months) provides indications on the reduction of river flows, on the availability of water in the aquifers and on the storage of water volumes in natural and artificial reservoirs.
The indicator was included at national level in the list of indicators for the assessment of the impacts of climate change on water resources (https://climadat.isprambiente.it/).
The indicator at different time scales is correlated with the deficit and/or surplus conditions of the water resources of a territory, thus allowing to evaluate the frequency, extension and severity and to highlight any trends, also in relation to the impact of climate change.
No normative reference.
However, in the context of the Permanent District Observatories on Water Uses, the SPI, used for the calculation of this indicator, is included in the common set of indicators for the assessment of drought and water scarcity conditions. It should be noted that the Observatories, established in 2016 for each river basin district as a measure of the Water Management Plan, pursuant to the Acque Framework Directive 2000/60/EC, are currently also the body of the relevant District Basin Authority, pursuant to:
- Legislative Decree no. 152/2006, on "EU standards" (G.U. General Series No. 88 of 14-04-2006 - Suppl. Ordinary no. 96).
- D.L. n. 39/2023, on “Urgent provisions for the fight against water scarcity and for the enhancement and adaptation of water infrastructure” (OJ L.U. General Series No. 88 of 14-04-2023), converted with modifications from L. n. 68/2023 (G.U. General Series No. 136 of 13-06-2023), in which the establishment of the permanent district observatories on water uses with the District Basin Authorities was ordered by a primary standard.
- European Water Resilience Strategy, adopted by the European Commission on 4 June 2025.
- Braca, G., Mariani, S., Lastoria, B., Tropeano, R., Casaioli, M., Piva, F., Marchetti, G., e Bussettini, M., 2024: Bilancio idrologico nazionale: stime BIGBANG e indicatori sulla risorsa idrica. Aggiornamento al 2023. Rapporti n. 401/2024, ISPRA, Roma https://www.isprambiente.gov.it/it/pubblicazioni/rapporti/bilancio-idrologico-nazionale-stime-bigbang-e-indicatori-sulla-risorsa-idrica-aggiornamento-al-2023.
- Braca, G., Mariani, S., Lastoria, B., Piva, F., Archi, F., Botto, A., Casaioli, M., Forte, T., Marchetti, G., Peruzzi, C., Tropeano, R., Vendetti, C., e Bussettini, M., 2023: Bilancio idrologico nazionale: focus su siccità e disponibilità naturale della risorsa idrica rinnovabile. Aggiornamento al 2022. Rapporti n. 388/2023, Roma https://www.isprambiente.gov.it/it/pubblicazioni/rapporti/bilancio-idrologico-nazionale-focus-su-siccita-e-disponibilita-naturale-della-risorsa-idrica-rinnovabile-aggiornamento-al-2022.
- Braca, G., Bussettini, M., Lastoria, B., Mariani, S., e Piva F., 2021: Il Bilancio Idrologico Gis BAsed a scala Nazionale su Griglia regolare – BIGBANG: metodologia e stime. Rapporto sulla disponibilità naturale della risorsa idrica. Rapporti n. 339/21, Roma. Disponibile online all’indirizzo: https://www.isprambiente.gov.it/it/pubblicazioni/rapporti/il-bilancio-idrologico-gis-based-a-scala-nazionale-su-griglia-regolare-bigbang.
- Mariani, S., Braca, G., Lastoria, B., Tropeano, R., Casaioli, M., Piva, F., Bussettini, M., 2024: “Il bilancio idrologico, la disponibilità di risorsa idrica e il bilancio idrico”, in Siccità, scarsità e crisi idriche, Emanuele Romano, Ivan Portoghese (a cura di), Habitat signa 1, 29-46. Roma: Cnr Edizioni. Disponibile online all’indirizzo: https://www.cnr.it/sites/default/files/public/media/attivita/editoria/SiccitaInterattivo_ver2.pdf.
- Mariani, S., e AA.VV., 2020: Note tecniche su crisi idriche, siccità e servizio idrico integrato – Manuale UTILITALIA. ISBN: 978 88 998 7903 7.
- Mariani, S., Braca, G., Romano, E., Lastoria, B. e Bussettini, M., 2018: Linee Guida sugli Indicatori di Siccità e Scarsità Idrica da utilizzare nelle Attività degli Osservatori Permanenti per gli Utilizzi Idrici, Pubblicazione progetto CReIAMO PA, 66 pp. Disponibile online all’indirizzo: http://www.isprambiente.gov.it/pre_meteo/idro/Osservatori/Linee%20Guida%20Pubblicazione%20Finale%20L6WP1_con%20copertina_ec.pdf.
- McKee, T. B., Doesken, N. J., and Kleist, J., 1993: The relationship of drought frequency and duration of time scales. Eighth Conference on Applied Climatology, American Meteorological Society, Jan 17–23, 1993, Anaheim CA, pp. 179–186.
- WMO, 2012: Standardized Precipitation Index User Guide, WMO-No. 1090, Ginevra.
Ulteriori riferimenti:
- Banca dati dei file ASCII grid dello SPI-Standardized Precipitation Index e dello SPEI-Standardized Precipitation Evapotranspiration Index, calcolati sull'Italia mesi dal 1952 al 2024. Disponibile online all'indirizzo: https://groupware.sinanet.isprambiente.it/bigbang-data/library/bigbang_90/ascii_grid.
- Immagini dello SPI-Standardized Precipitation Index e dello SPEI-Standardized Precipitation Evapotranspiration Index, calcolati sull'Italia dal 1952 al 2024. Disponibili online all'indirizzo: https://groupware.sinanet.isprambiente.it/bigbang-data/library/bigbang_90/figures.
- Portale de "Lo stato di severità idrica nazionale", con link ai portali degli Osservatori distrettuali permanenti per gli utilizzi idrici. Disponibile online all'indirizzo: https://www.isprambiente.gov.it/pre_meteo/idro/SeverIdrica.html.
- Banca dati “Indicatori di impatto dei cambiamenti climatici”. Disponibile online sul portale: https://climadat.isprambiente.it/.
- News sull'utilizzo dei dati satellitari Sentinel-2 del Programma europeo Copernicus per quantificare l'impatto della siccità 2022 sulle componenti costitutive (macro-unità morfologiche "acqua", "vegetazione" e sedimenti") del Fiume Po. Disponibile online all'indirizzo: https://www.isprambiente.gov.it/it/archivio/notizie-e-novita-normative/notizie-ispra/2022/08/monitoraggio-siccita-copernicus.
-
-
The precipitation data used are mostly those collected and published by the regional and provincial structures to which, according to Article 92 of Legislative Decree no. 112 of 31 March 1998, the functions and tasks of the peripheral offices of the National Hydrographic and Tire Service (SIMN, now merged into ISPRA) of the Department for National Technical Services, were transferred. The precipitation data used in the processing of the indicator shall be accessible by consulting the websites of the institutions or by appropriate request. The data are aggregated to the monthly scale on the regular grid of the 1 km resolution BIGBANG, which covers the entire national territory, and are available on the Groupware portal of ISPRA (https://groupware.sinanet.isprambiente.it/bigbang-data/library/bigbang-90).
national
1952–2024
The SPI index is calculated on the basis of the monthly precipitation grids produced by the BIGBANG model, version 9.0, and aggregates on the 3 and 12-month intervals. The percentage of the national territory characterized by SPI values – – – –0 (improved by means of GIS instruments, are determined by the percentage of the national territory characterized by SPI values – 2.0 (extreme drought), –2.0 (moderate or severe drought), –1.0 – –1.0 degrees SPI ? 1.0 (normal situation), 1.0 SPI 2.0 (moderate or severe humidity) and SPI 2.0 (moderate or severe humidity).
Since the evaluation of the SPI dependent on the length of the historical series of precipitation used and since the historical series are increased every year, it follows that for the same time moment from year to year the value of SPI can slightly change as well as the consequent evaluations on the percentage of national territory falling within the 5 categories indicated above.
For each time aggregation considered (3 months and 12 months) and for each class of SPI, the state assessment is carried out considering the average of the twelve monthly values of 2024 (hereinafter referred to as the "media percentage") compared with the average of the 1951–2024 historical series.
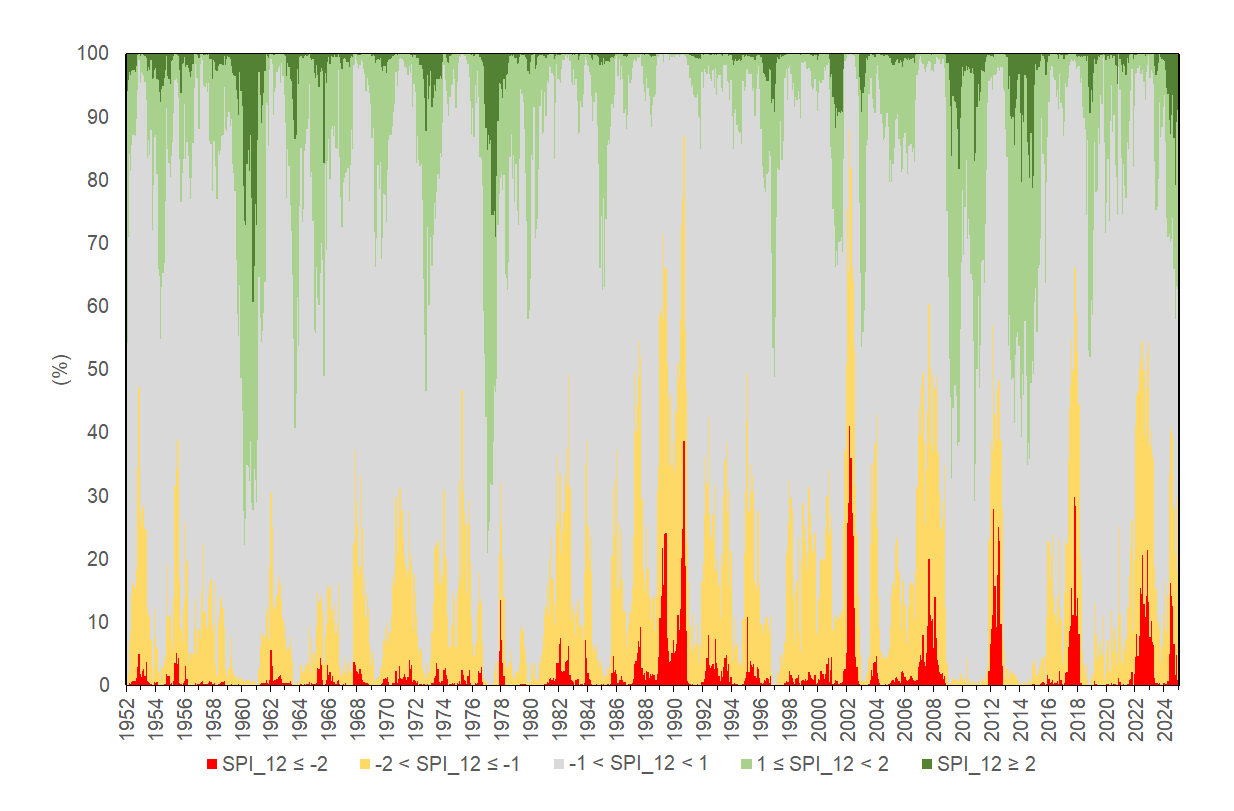
In 2024, the average percentage of the territory falling within the normal situation (–1.0 SPI at 12 months ? 1.0) was equal to 46.8%, lower than the average of the series (68.0%). The average percentage of the territory characterized by values of SPIs below or equal to – 1.0 (all drought classes) was higher than the corresponding long-term average, so also the average percentage of the territory characterized by values of SPI above or equal to 1.0 (all humidity classes).
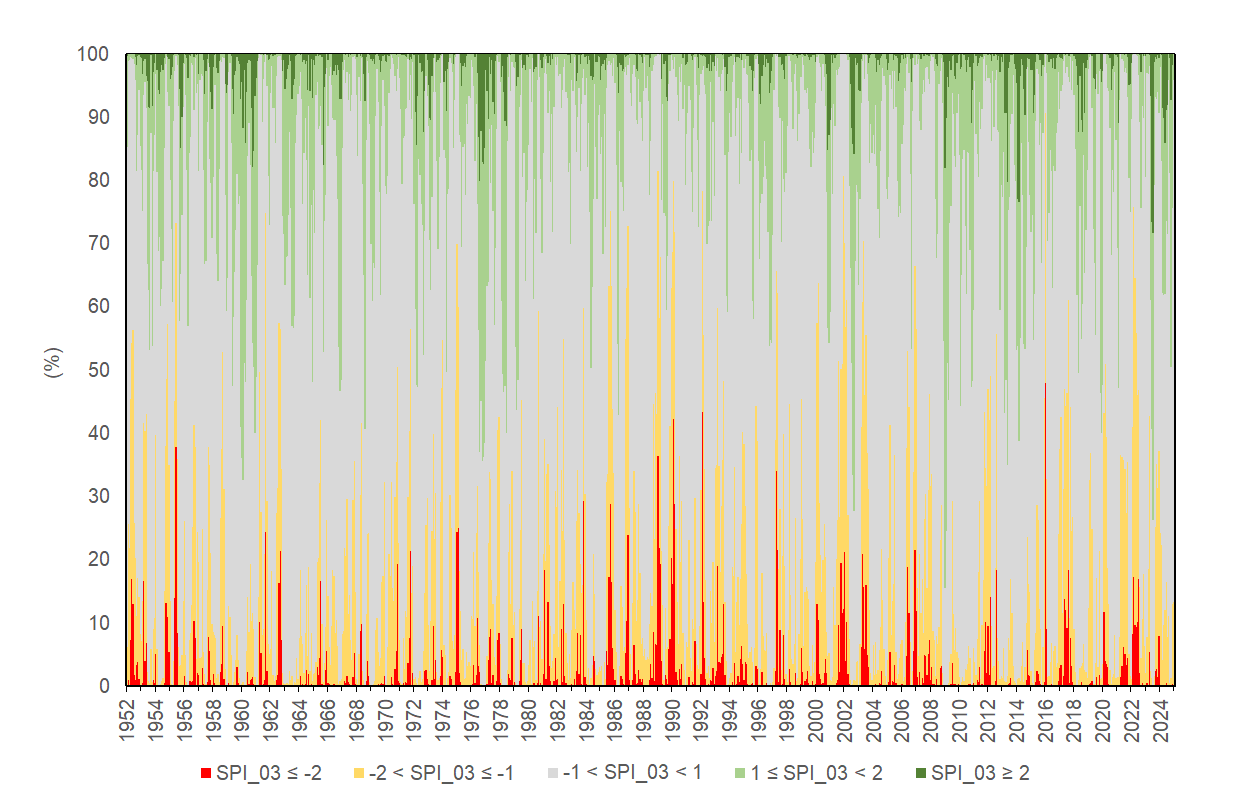
The average percentage of the territory characterized by 3-month SPI values falling within the normal situation (–1.0 SPI - 1.0) is equal to 64.6%, slightly lower than the average of the series (68.0%). The average percentage of territory with 3-month PPI values indicating extreme droughts (SPI ? ?2.0) was lower than the long-term average, as well as those indicating moderate or severe drought (?2.0 ? SPI ? ?1.0). On the other hand, the average percentage of the territory with SPI values above or equal to 1.0 (all moisture classes) was higher than the long-term average.
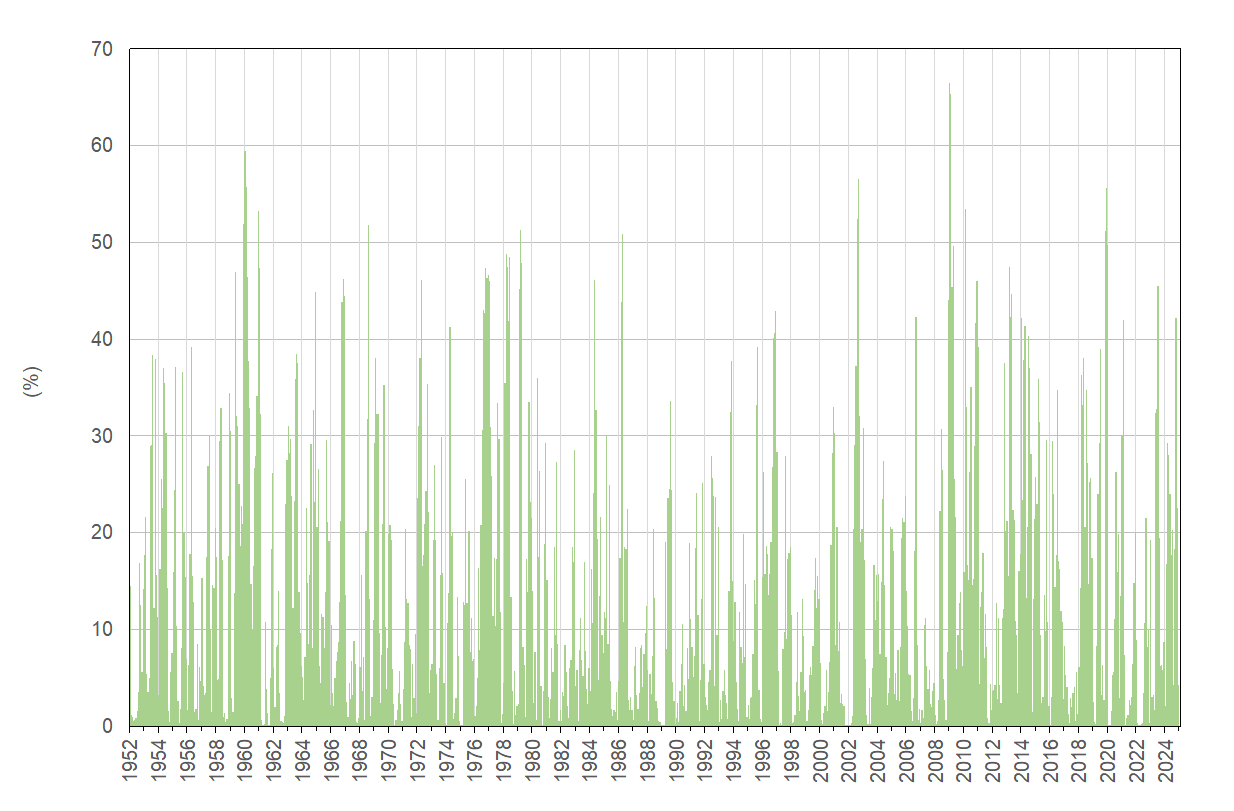
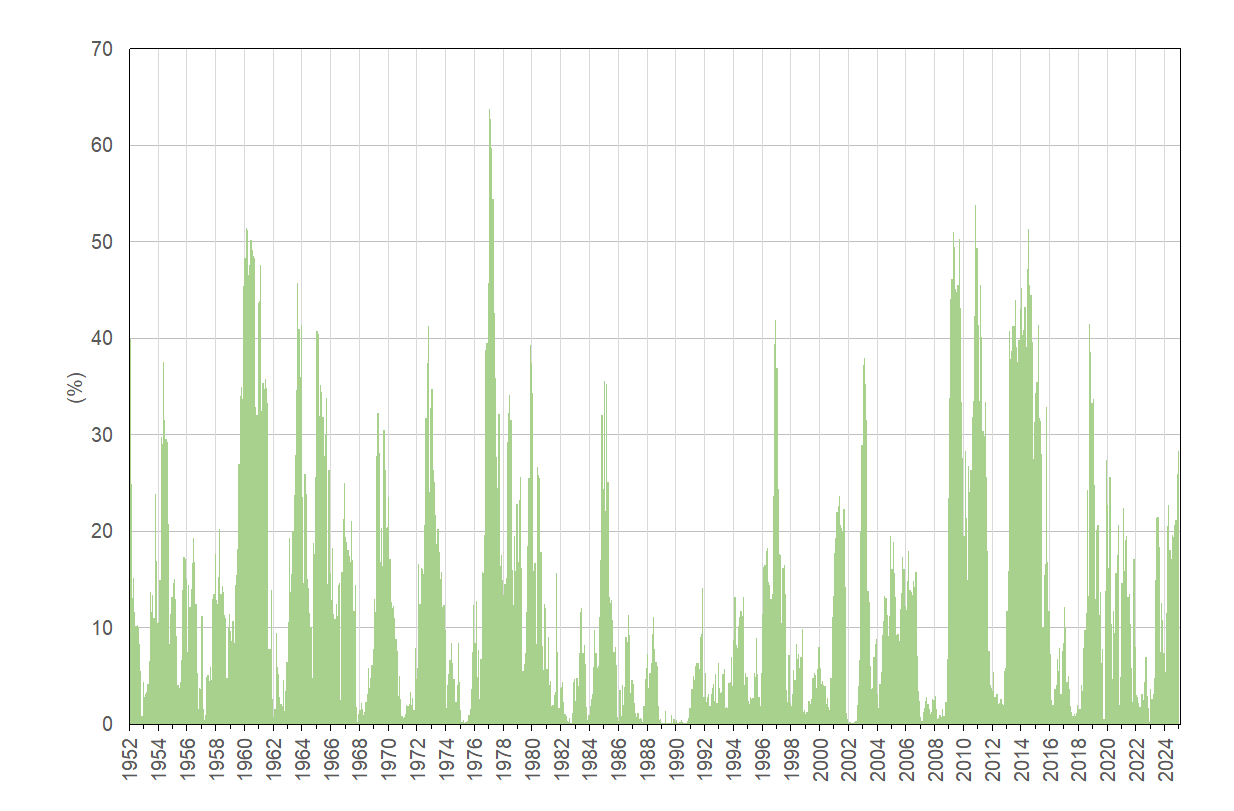
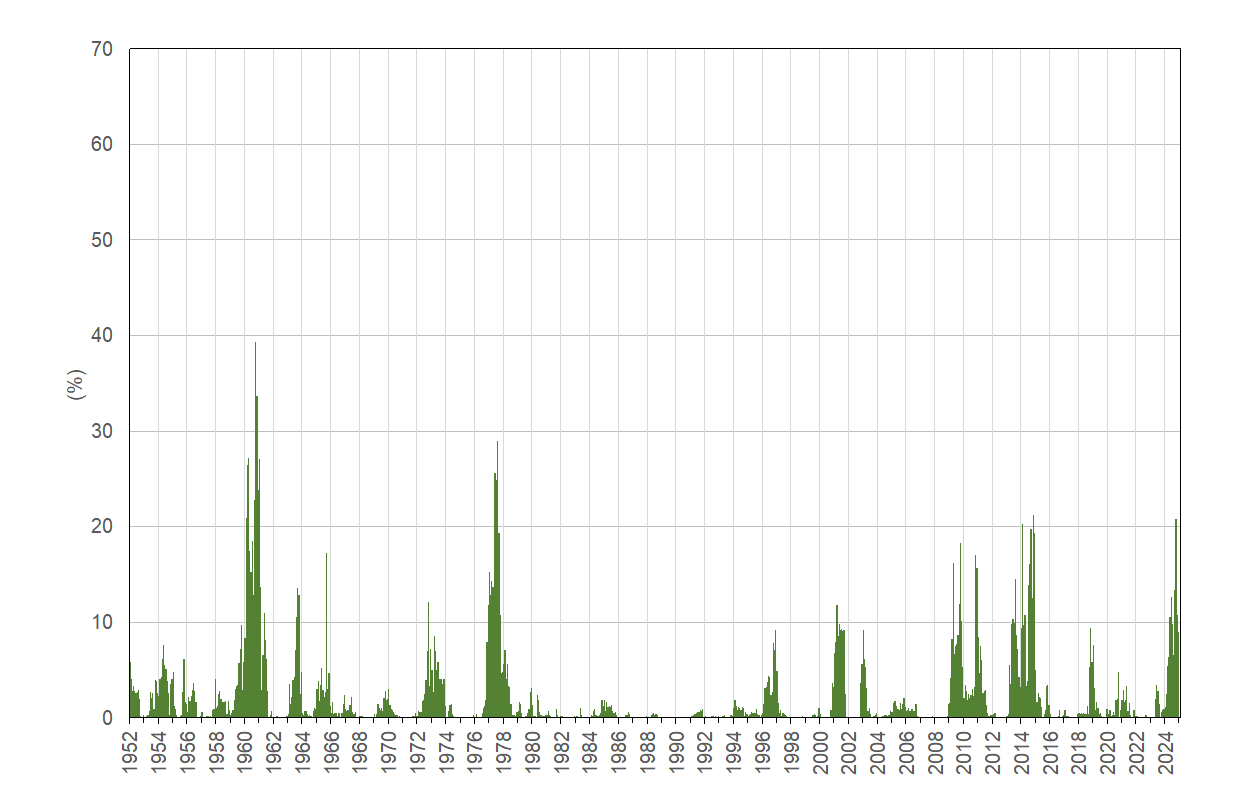
The analysis of the data highlighted statistically significant increasing trends for areas subject to precipitation deficit (drought) assessed with the 12-month SPI (Figure 2, 4) and, consequently, decreasing trends for areas subject to normal and/or precipitation surplus values (Figure 6, 8). This shows an increase in the percentage of the Italian territory subject to extreme drought on an annual basis, starting from the beginning of the 1950s, in line with what was also found at European level, strictly dependent on the already ongoing impact of climate change. There are no statistically significant trends in the percentages of areas characterized by the 3-month SPI (Figure 1, 3, 5, 7).
| Data |
|---|
Thumbnail
Headline
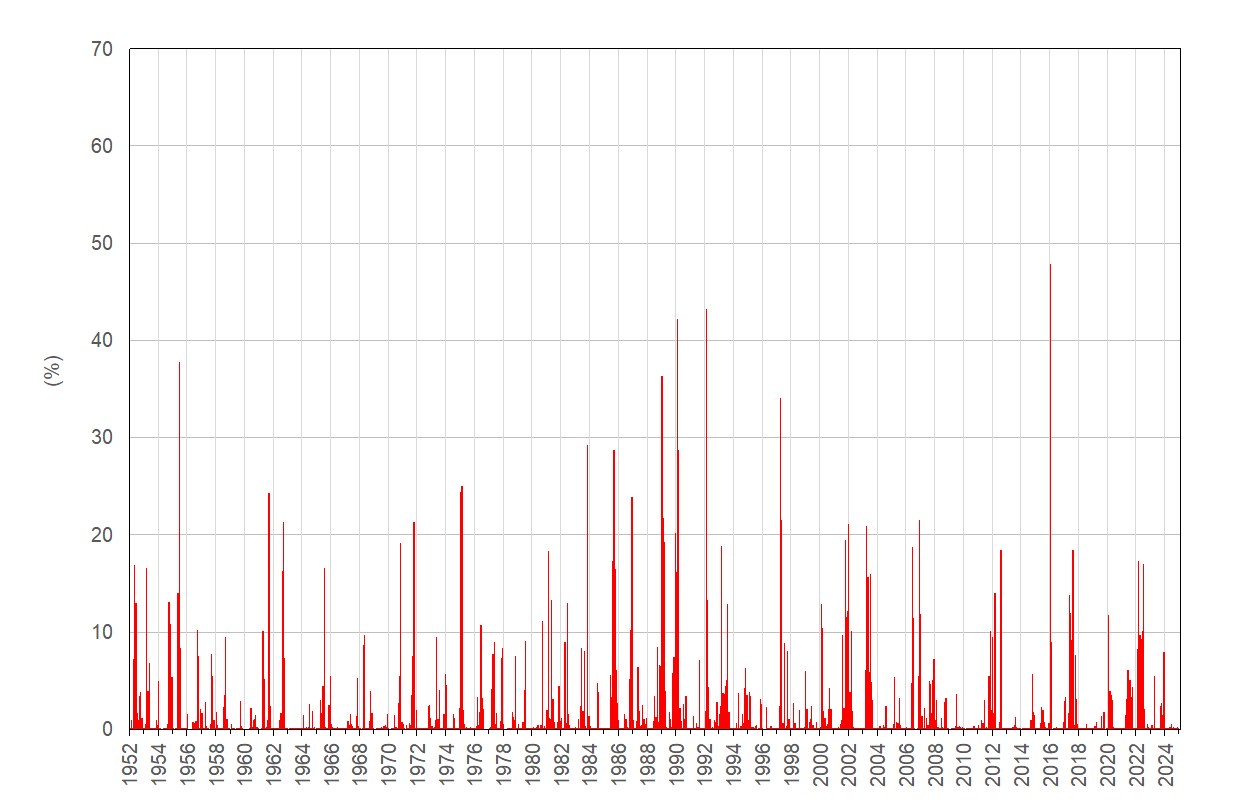
Figure 1: Percentage of the national territory subject to precipitation deficit with a value of SPI at 3 months less than or equal to ?2.0 (extreme rate). Period 1952-2024 Data source
ISPRA elaboration on data from regional hydro-meteorological offices and autonomous provinces and on historical data of the Suppressed SIMN |
Thumbnail
Headline
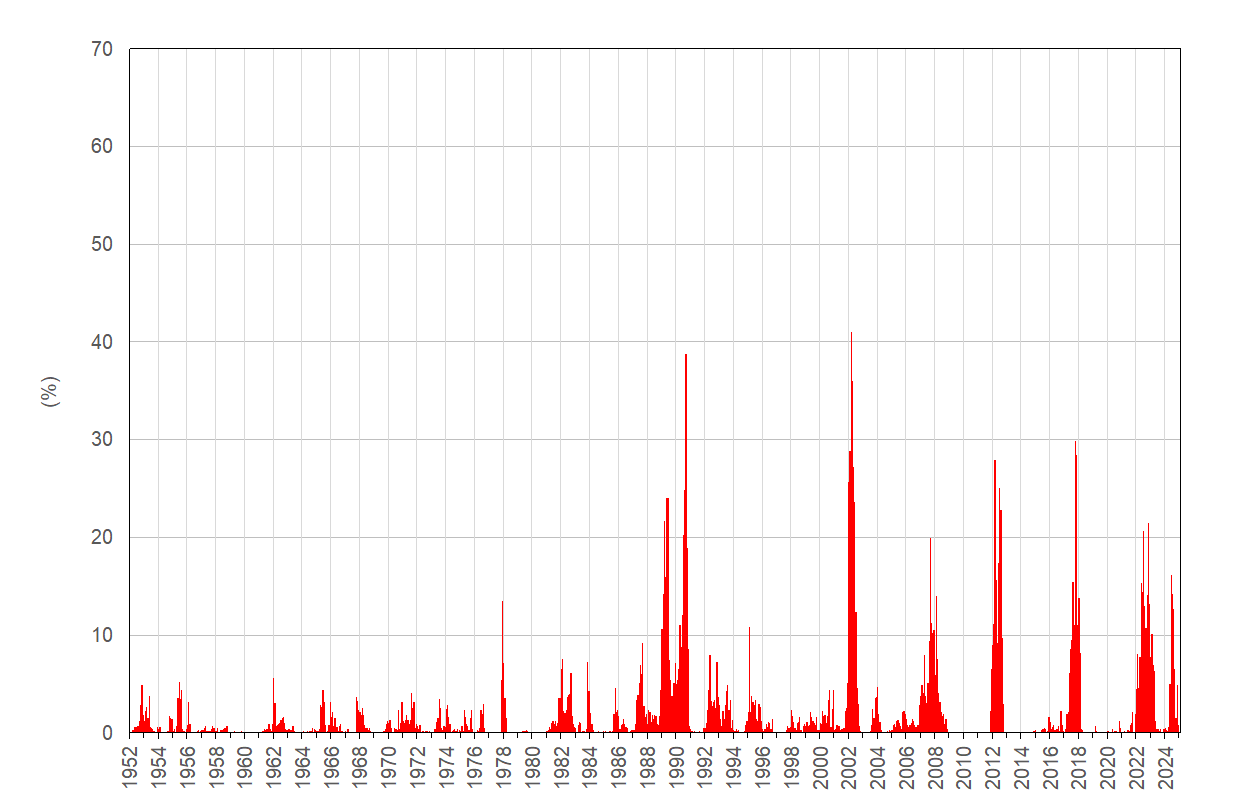
Figure 2: Percentage of the national territory subject to precipitation deficit with a value of SPI at 12 months less than or equal to -2.0 (extreme rate). Period 1952-2024 Data source
ISPRA elaboration on data from regional hydro-meteorological offices and autonomous provinces and on historical data of the Suppressed SIMN |
Thumbnail
Headline
Figure 3: Percentage of the national territory subject to precipitation deficit with a value of SPI at 3 months greater than ?2.0 and less than or equal to 1.0 (strict or moderate drought). Period 1952-2024 Data source
ISPRA elaboration on data from regional hydro-meteorological offices and autonomous provinces and on historical data of the Suppressed SIMN |
Thumbnail
Headline
Figure 4: Percentage of the national territory subject to precipitation deficit with a value of SPI at 12 months greater than –2.0 and less than or equal to –1.0 (severe or moderate drought). Period 1952-2024 Data source
ISPRA elaboration on data from regional hydro-meteorological offices and autonomous provinces and on historical data of the Suppressed SIMN |
Thumbnail
Headline
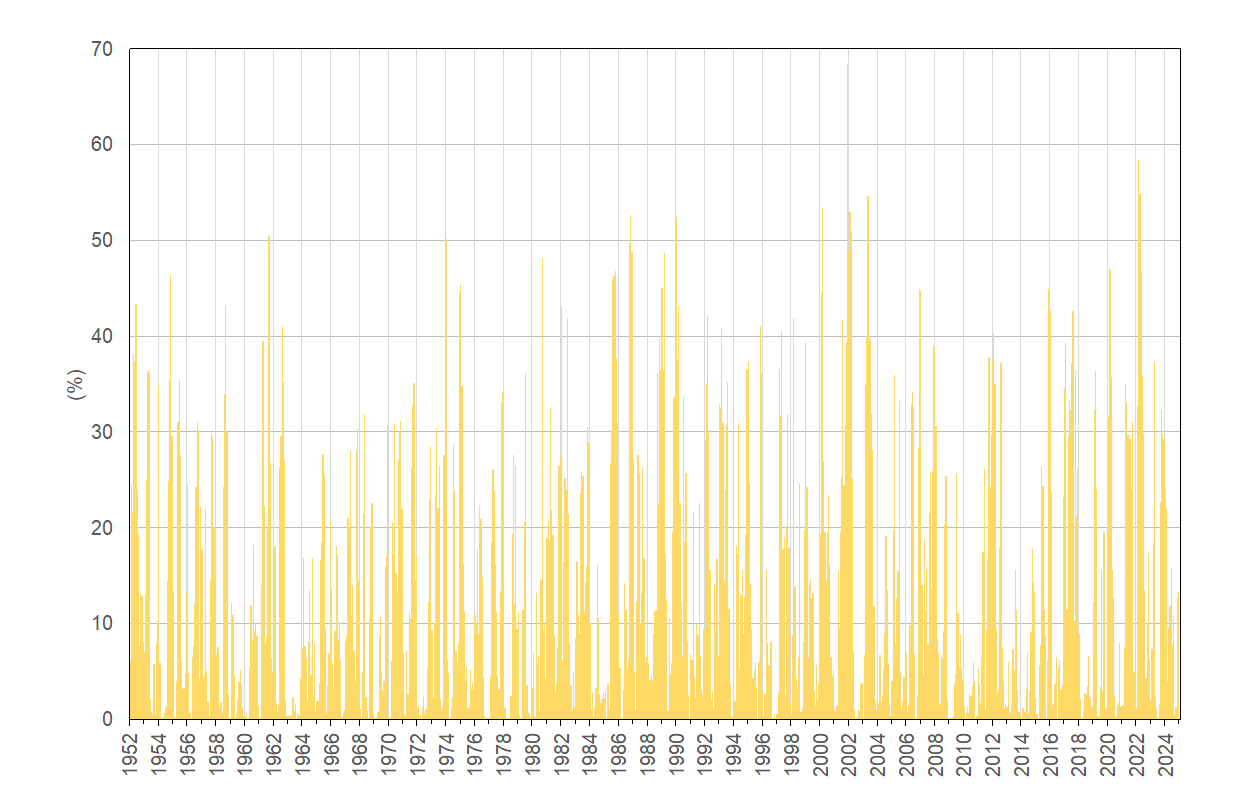
Figure 5: Percentage of the national territory subject to precipitation surplus with SPI at 3 months greater than or equal to 1.0 and less than 2.0 (severe or moderate humidity). Period 1952-2024 Data source
ISPRA elaboration on data from regional hydro-meteorological offices and autonomous provinces and on historical data of the Suppressed SIMN |
Thumbnail
Headline
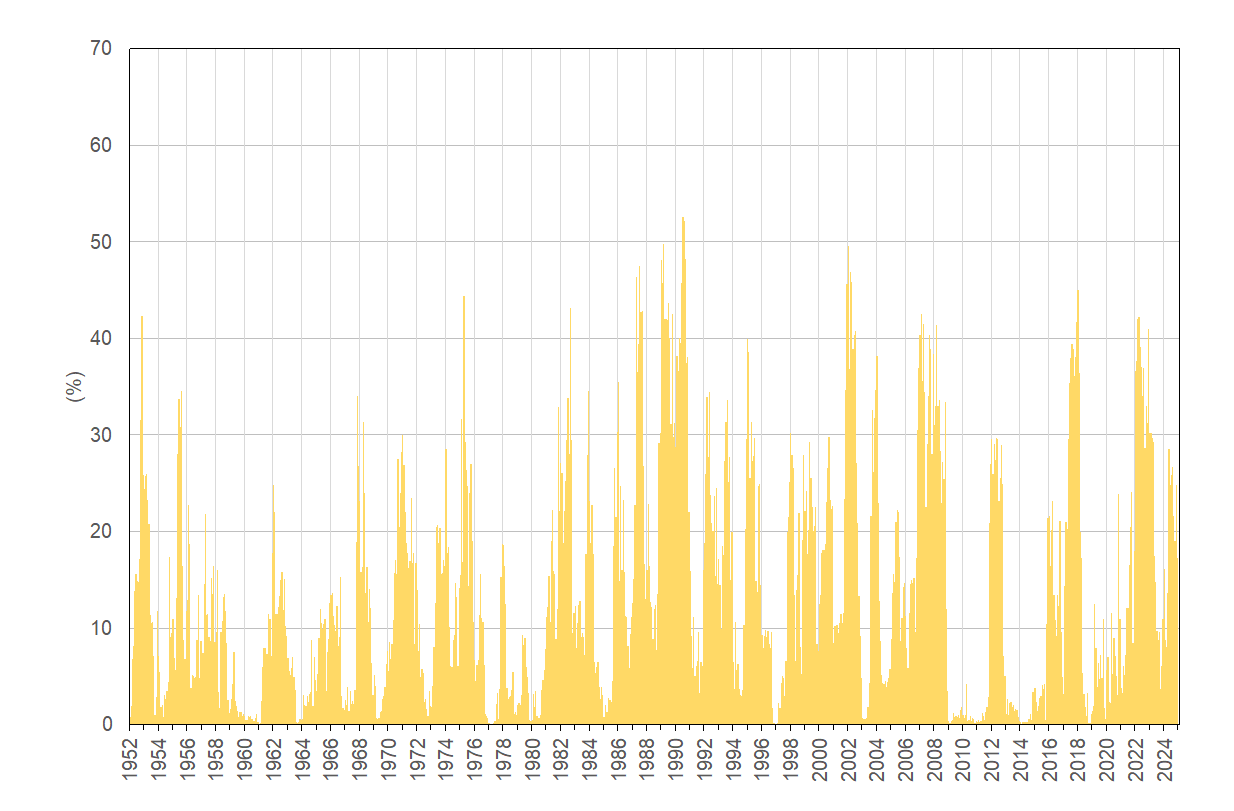
Figure 6: Proportion of the national territory subject to precipitation surplus with a value of SPI at 12 months greater than or equal to 1.0 and less than 2.0 (strict or moderate humidity). Period 1952-2024 Data source
ISPRA elaboration on data from regional hydro-meteorological offices and autonomous provinces and on historical data of the Suppressed SIMN |
Thumbnail

Headline
Figure 7: Percentage of the national territory subject to precipitation surplus with SPI value at 3 months greater than or equal to 2.0 (extreme humidity). Period 1952-2024 Data source
ISPRA elaboration on data from regional hydro-meteorological offices and autonomous provinces and on historical data of the Suppressed SIMN |
Thumbnail
Headline
Figure 8: Percentage of the national territory subject to precipitation surplus with a value of SPI at 12 months greater than or equal to 2.0 (extreme humidity). Period 1952-2024 Data source
ISPRA elaboration on data from regional hydro-meteorological offices and autonomous provinces and on historical data of the Suppressed SIMN |
Thumbnail
Headline
Figure 9: Percentage of the national territory in the different classes of SPI at 3 months. Period 1952-2024 Data source
ISPRA elaboration on data from regional hydro-meteorological offices and autonomous provinces and on historical data of the Suppressed SIMN |
Thumbnail
Headline
Figure 10: Percentage of the national territory in the different classes of SPI at 12 months. Period 1952-2024 Data source
ISPRA elaboration on data from regional hydro-meteorological offices and autonomous provinces and on historical data of the Suppressed SIMN |
Headline
Dati per Figura 1 Data source
Elaborazione ISPRA su dati degli uffici idro-meteorologici regionali e delle province autonome e su dati storici del soppresso SIMN |
Headline
Dati per Figura 2 Data source
Elaborazione ISPRA su dati degli uffici idro-meteorologici regionali e delle province autonome e su dati storici del soppresso SIMN |
Headline
Dati per Figura 3 Data source
Elaborazione ISPRA su dati degli uffici idro-meteorologici regionali e delle province autonome e su dati storici del soppresso SIMN |
Headline
Dati per Figura 4 Data source
Elaborazione ISPRA su dati degli uffici idro-meteorologici regionali e delle province autonome e su dati storici del soppresso SIMN |
Headline
Dati per Figura 5 Data source
Elaborazione ISPRA su dati degli uffici idro-meteorologici regionali e delle province autonome e su dati storici del soppresso SIMN |
Headline
Dati per Figura 6 Data source
Elaborazione ISPRA su dati degli uffici idro-meteorologici regionali e delle province autonome e su dati storici del soppresso SIMN |
Headline
Dati per Figura 7 Data source
Elaborazione ISPRA su dati degli uffici idro-meteorologici regionali e delle province autonome e su dati storici del soppresso SIMN |
Headline
Dati per Figura 8 Data source
Elaborazione ISPRA su dati degli uffici idro-meteorologici regionali e delle province autonome e su dati storici del soppresso SIMN |
Headline
Dati per Figura 9 Data source
Elaborazione ISPRA su dati degli uffici idro-meteorologici regionali e delle province autonome e su dati storici del soppresso SIMN |
Headline
Dati per Figura 10 Data source
Elaborazione ISPRA su dati degli uffici idro-meteorologici regionali e delle province autonome e su dati storici del soppresso SIMN |
In 2024 the average value (of the twelve monthly values) of the percentage of Italian territory subject to extreme drought conditions, characterized by an SPI, relating to the aggregate precipitation at 3 months, less than or equal to –2.0, was equal to 0.1%, considerably lower than the corresponding average value of the period 1952–2024 equal to 2.5%, reaching the maximum value of 0.5% in June. At the same time, the average value of the percentage of national territory subject to SPI at 12 months less than or equal to –2.0 in 2024 was equal to 5.3%, higher than the average value of the period 1952–2024 equal to 2.1%. On the 12-month time scale, the maximum value was reached in June, at 16.1%.
In 2024 also the percentage of Italian territory subject to extreme humidity conditions, i.e. characterized by an SPI greater than or equal to 2.0. As regards the 3-month aggregation, the average value was 5.0%, well above the corresponding average value for the period 1952–2024 of 1.9%. The maximum percentage of territory subject to extreme humidity occurred in May (14.1%).
On the 12-month time scale, the average value was 9.1%, higher than the corresponding average value for the period 1952–2024 equal to 2.3%. The maximum percentage of territory subject to extreme humidity occurred in October (20.8%).
If overall 2024 was characterized by a precipitation surplus compared to the long-term average, very different were the deviations of monthly rainfall compared to the corresponding average values of the period 1951–2024 and very different was the spatial distribution of annual rainfall with high values in the North of the country and scarce quantities in the Center, in the South and in the Islands (see the indicator "Precipitations" present in the Environmental Theme "water source and balance".
Figure 1 and Figure 2 are reported the percentages, from 1952 to 2024, of the areas of the national territory subject to extreme drought, i.e. characterized by values of SPI, respectively at 3 months and 12 months, less than or equal to –2.0. In the 12-month historical series of aggregation there is an increasing trend, however statistically significant, of the percentage of the territory subject to situations of extreme drought. For areas of the national territory subject to severe or moderate droughts, i.e. characterized by SPI values, respectively at 3 months and 12 months, greater than –2.0 and less than or equal to –1.0, there is no significant trend in the series relating to the SPI at 3 months (Figure 3), while there is an increasing trend, also this statistically significant trend, of the percentage of the territory subject to severe or moderate drought events over the 12-month period.
With regard to the percentage of areas of the national territory subject to severe or moderate humidity, i.e. characterized by SPI values, respectively at 3 months and 12 months, greater or equal to 1.0 and less than 2.0, there is no trend in the series relating to the 3-month SPI (Figure 5), while a decreasing trend is reported, statistically significant, on the 12-month period (Figure 6). For areas of the national territory subject to extreme humidity, i.e. characterized by values of SPI, respectively at 3 months (Figure 7) and 12 months (Figure 8), greater or equal to 2.0, a decreasing trend, statistically significant, is observed over the 12-month period.