Giovanni Braca, Robertino Tropeano
The indicator evaluates the cumulative monthly and annual height of water (expressed in mm) that infiltrates deep into the ground following rainfall, compared to the surface of the national territory.
In 2025, total annual infiltration was estimated at 184.9 mm, corresponding to 55.8 billion cubic meters. This value was significantly lower than the average for the period 1951–2025, estimated at 215.7 mm (corresponding to 65.2 billion cubic meters), marking a negative anomaly of approximately –14.3%.
Deep infiltration constitutes the amount of precipitation which, crossing the surface layer of the soil, feeds the groundwater ( aquifer recharge or groundwater recharge ). A portion of the precipitation water that infiltrates, through underground circulation, returns to the surface as the base runoff of the watercourses while the other portion discharges directly into the sea at depth. The supply of groundwater is regulated by multiple factors such as topographic exposure, vegetation, nature of the soil, lithology, intensity and frequency of rainfall.
The infiltration assessment is carried out using the ISPRA BIGBANG hydrological balance model on the basis of the potential infiltration coefficient (CIP) associated with the hydrogeological complexes. This assessment is transmitted to the European Environment Agency ( European Environmental Agency ) as part of the WISE-SoE data flow ( Water Information System for Europe-State of Environment ).
Provide, as part of the estimate of the available or potential water resource, an evaluation of the quantity of water that infiltrates into the subsoil and which constitutes an important share of the renewable water resource.
Current legislation does not set specific environmental objectives.
- Braca, G., Mariani, S., Lastoria, B., Piva, F., Archi, F., Botto, A., Casaioli, M., Forte, T., Marchetti, G., Peruzzi, C., Tropeano, R., Vendetti, C., and Bussettini, M., 2023: National hydrological balance: focus on drought and natural availability of renewable water resources. Update to 2022. Reports no. 388/2023, Rome https://www. isprambiente. gov. it/it/pubblicazioni/rapporti/bilancio-idrologico-nazionale-focus-su-siccita-e-disponibilita-naturale-della-risorsa-idrica-rinnovabile-formazione-al-2022.
- Braca, G., Bussettini, M., Gafà, R. M., Monti, G. M., Martarelli, L., Silvi, A., and La Vigna, F., 2022: The Nationwide Water Budget Estimation in the light of the New Permeability Map of Italy. Acque Sotterranee–Italian Journal of Groundwater , 11(3), 31–39. https://doi. org/10.7343/as-2022-575.
- Braca, G., Bussettini, M., Lastoria, B., Mariani, S., and Piva, F., 2021: The Gis BAsed Hydrological Balance at National Scale on Regular Grid – BIGBANG: methodology and estimates. Report on the natural availability of water resources. Reports no. 339/21, Rome. Available online at: https://www. isprambiente. gov. it/it/pubblicazioni/rapporti/il-bilancio-idrologico-gis-based-a-scala-nazionale-su-griglia-regolare-bigbang .
- Celico, P., 1988: Hydrogeological prospecting, Liguori, Naples.
- Mariani, S., Braca, G., Lastoria, B., Tropeano, R., Casaioli, M., Piva, F., and Bussettini, M., 2024: “The hydrological balance, the availability of water resources and the water balance”, in Drought, scarcity and water crises, Emanuele Romano, Ivan Portoghese (ed.), Habitat signa 1, 29-46. Rome: Cnr Editions. Available online at: https://www. cnr. it/sites/default/files/public/media/attivita/editoria/SiccitaInterattiva_ver2. pdf .
- SNPA, 2026: The climate in Italy in 2025, forthcoming .
The indicator is estimated on the basis of a mathematical model and, as such, can therefore only be compared with indicators obtained with the same model. Furthermore, it is estimated on the basis of rainfall, which in turn is estimated on the basis of a set of rain gauge stations which may not be evenly distributed across the territory and whose number may differ from one year to the next. These circumstances, together with the different hydraulic characterization of the hydrogeological complexes and the soil, suggest particular attention and caution when comparing the indicator in space and time. Furthermore, previously published estimates referring to previous versions of the BIGBANG model may present slight deviations compared to the estimates of the latest available version since some data or schematizations underlying the model may have changed. Correct comparisons between the indicator values must therefore be made using the same version of the BIGBANG model.
None
ISPRA
Regional hydro-meteorological services and those of the autonomous provinces
The precipitation and temperature data used are mostly those collected and published by the regional and provincial structures to which according to art. 92 of Legislative Decree no. 112 of 31 March 1998, the functions and tasks of the peripheral offices of the National Hydrographic and Mareographic Service (SIMN, now merged into ISPRA) of the Department for National Technical Services were transferred. The precipitation data are collected directly by the regional structures and the autonomous provinces, while the temperature data used in the development of the indicator are accessible by consulting the websites of the institutions, or via the ISPRA SCIA portal ( https://scia. isprambiente. it ). The precipitation data aggregated at the monthly scale and the infiltration data, both on the regular BIGBANG grid of 1 km resolution, which covers the entire national territory, are available on the ISPRA Groupware portal ( https://groupware. sinanet. isprambiente. it/bigbang-data/library/bigbang100).
National
1951–2025
The calculation method uses the potential infiltration coefficient (CIP), between 0 and 1, associated with the hydrogeological complexes as implemented in the BIGBANG-Gis BAsed Hydrological Balance model at a national scale on a regular grid, version 10.0, developed and implemented in a GIS environment by ISPRA. In particular, infiltration THE is given by the expression:
THE = CIP * ( A – E – Δ WS ) Where TO is the liquid influx (rain + snowmelt), AND is the actual evapotranspiration and Δ WS it is the volume of water stored in the surface layer of the soil. The calculation of the indicator is carried out starting from the evaluation of the infiltration on a regular grid of 1 km resolution which covers the entire national territory.
In 2025, the value of the total annual infiltration was significantly lower than the average for the period 1951–2025. This leads to a lower availability of underground renewable water resources for this year.
In the period 1951–2025, a decreasing and statistically significant trend is detected in the total annual value of infiltration (Mann-Kendall test with a significance level of 5%). This negative trend leads, in the future, to a reduction in the availability of renewable underground water resources.
| Allegati |
|---|
Thumbnail
Titolo
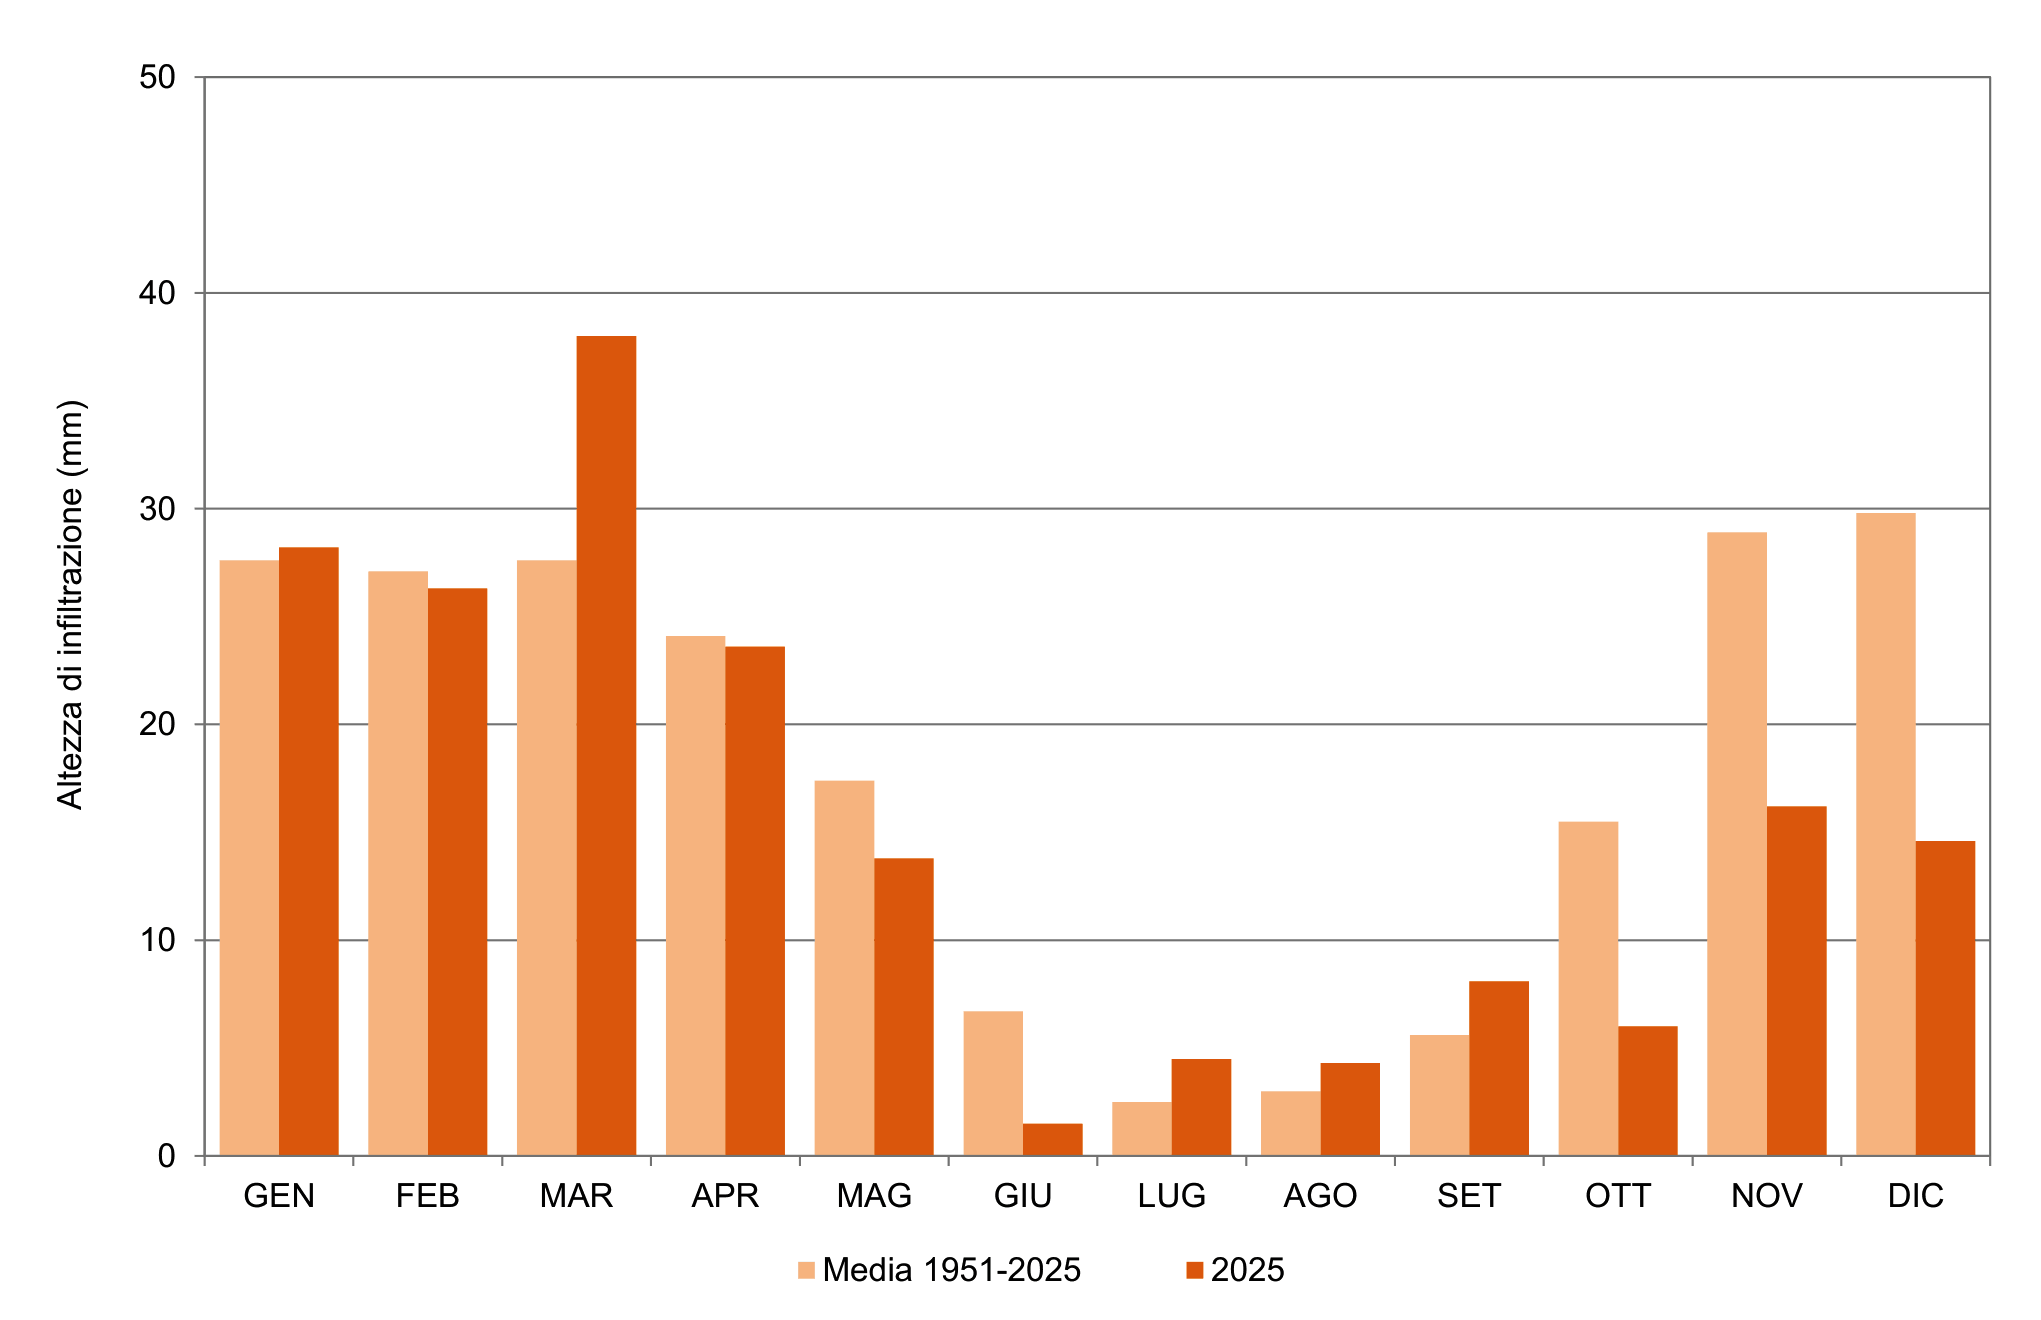
Figure 1: Monthly infiltration height relative to the national territory for 2025 and average for the period 1951‒2025 Fonte
SPRA processing on data from regional hydro-meteorological offices and autonomous provinces and historical data from the suppressed SIMN |
In 2025, the total annual infiltration was estimated at 184.9 mm, with a deviation of –14.3% compared to the average for the period 1951–2025 (215.7 mm). Over the course of the year, the monthly trend was highly variable: the maximum negative deviation was recorded in June (–78.6%), while the positive one reached its peak in July (+80.0%). The other months that showed a surplus compared to the norm were January, March, August and September, while the remaining months showed more or less marked deficits (Figure 1).
The negative infiltration anomaly on a national scale can be attributed to the high evapotranspiration, caused by the high temperatures recorded during the year ( in Italy, 2025 was the fourth warmest year since 1961). The share of evapotranspiration has in fact reached 55.8% of precipitation, exceeding the long-term annual average (which amounts to approximately 52%) and consequently reducing the overall availability of resources useful for infiltration.