Giovanni Braca, Barbara Lastoria
The indicator provides the evaluation, expressed in mm, of the height of water, compared to the surface of the national territory, which falls to the ground (both in liquid and solid form) for each month and for the entire year.
The indicator relating to 2025 is compared, for each month of the year, with the corresponding average values for the period 1951–2025 obtained using the same methodology. In 2025, the value of total annual precipitation in Italy was 962.9 mm (290.9 billion cubic metres), 1% greater than the corresponding long-term average value (LTAA- Long-Term Annual Average ) and 2% compared to the annual average over the last thirty climatological years 1991–2020.
Going down to the regional and district level, the situation is very diversified, with Northern Italy being affected in 2025 by quantities of precipitation higher than the long-term averages. On the other hand, the precipitation anomaly compared to the LTAA was negative in the Center and South and the major islands.
it is a state indicator that measures the volumes of water flowing into the national territory through the spatial interpolation of the rainfall measured by rain gauges. The measurement of rainfall is mainly carried out by the regional structures taking over from the peripheral offices of the National Hydrographic and Mareographic Service (SIMN), according to standards and procedures regulated by the World Meteorological Organization (WMO), implemented by SIMN in the notebook "Technical standards for the collection and processing of hydrometeorological data - part I". Precipitation measurements are also carried out by the Air Force, by other regional structures and by the managers of agrometeorological networks.
The evaluation of precipitation on the regular grid was carried out by spatial interpolation of the monthly precipitation values recorded by approximately 3,000 pluviometric stations, not uniformly distributed across the national territory.
Knowledge of meteoric inflows on a monthly scale is necessary to carry out the hydrological balance aimed at managing water resources and for the study and prevention of extreme hydrological drought events. It is also necessary, more generally, for the climatic characterization of a territory.
Current legislation does not set specific environmental objectives.
The reference standards for carrying out monitoring are:
- Law 267/98, containing "Conversion into law, with amendments, of the decree-law of 11 June 1998, n. 180, containing urgent measures for the prevention of hydrogeological risk and in favor of the areas affected by landslide disasters in the Campania region" (Official Journal General Series n. 183 of 7 August 1998);
- Legislative Decree 152/06, containing “Regulations on environmental matters (OJ General Series n. 88 of 14-04-2006 - Ordinary Supplement n. 96), which implements the Water Framework Directive 2000/60/EC;
- Legislative Decree 49/2010, containing "Implementation of Directive 2007/60/EC relating to the assessment and management of flood risks" (Official Journal General Series no. 77 of 02.04.2010);
- European Water Resilience Strategy, adopted by the European Commission on 4 June 2025.
- Braca, G., Mariani, S., Lastoria, B., Piva, F., Archi, F., Botto, A., Casaioli, M., Forte, T., Marchetti, G., Peruzzi, C., Tropeano, R., Vendetti, C., and Bussettini, M., 2023: National hydrological balance: focus on drought and natural availability of renewable water resources. Update to 2022. Reports no. 388/2023, Rome. Available online at: https://www. isprambiente. gov. it/it/pubblicazioni/rapporti/bilancio-idrologico-nazionale-focus-su-siccita-e-disponibilita-naturale-della-risorsa-idrica-rinnovabile-formazione-al-2022.
- Braca, G., Bussettini, M., Lastoria, B., Mariani, S., and Piva, F., 2021: The Gis BAsed Hydrological Balance at National Scale on Regular Grid – BIGBANG: methodology and estimates. Report on the natural availability of water resources. Reports no. 339/21, Rome. Available online at: https://www. isprambiente. gov. it/it/pubblicazioni/rapporti/il-bilancio-idrologico-gis-based-a-scala-nazionale-su-griglia-regolare-bigbang .
- Mariani, S., Braca, G., Lastoria, B., Tropeano, R., Casaioli, M., Piva, F., Bussettini, M., 2024: “The hydrological balance, the availability of water resources and the water balance”, in Drought, scarcity and water crises, Emanuele Romano, Ivan Portoghese (ed.), Habitat signa 1, 29-46. Rome: Cnr Editions. Available online at: https://www. cnr. it/sites/default/files/public/media/attivita/editoria/SiccitaInterattiva_ver2. pdf .
- National Hydrographic and Mareographic Service, 1997: Technical standards for the collection and processing of hydrometeorological data, Rome.
- National Hydrographic and Mareographic Service, 1970: Publication no. 17, Rome.
- National Hydrographic and Mareographic Service - Hydrological Annals.
- SNPA, 2026: The climate in Italy in 2025. forthcoming .
- WMO, 2008: Guide to Hydrological Practices, Volume I. Hydrology – From Measurement to Hydrological Information, WMO-No. 168, Geneva.
The indicator is estimated on the basis of a set of rain gauge stations which may not be evenly distributed across the territory and whose number may differ from one year to the next. These circumstances, together with the different spatial estimation method used, suggest particular attention and caution when comparing the indicator in space and time.
No further action.
ISPRA
Regional hydro-meteorological services and those of the autonomous provinces
The precipitation data used are mostly those collected and published by the regional and provincial structures to which, based on art. 92 of Legislative Decree no. 112 of 31 March 1998, the functions and tasks of the peripheral offices of the National Hydrographic and Mareographic Service (SIMN, now merged into ISPRA) of the Department for National Technical Services were transferred. The precipitation data used in the development of the indicator can be accessed by consulting the institutions' websites or by making an appropriate request. The data are aggregated at the monthly scale on the regular BIGBANG grid of 1 km resolution, which covers the entire national territory, and are available on the ISPRA Groupware portal at the address: https://groupware. sinanet. isprambiente. it/bigbang-data/library/bigbang100.
National
1951–2025
The calculation of the indicator is developed starting from the evaluation of precipitation on a regular grid of 1 km resolution, which covers the entire national territory, carried out on the basis of the values detected by the pluviometric monitoring stations.
The spatial interpolation method used is the Natural Neighbor , as implemented in the BIGBANG-Gis BASed Hydrological Balance model at national scale on a regular grid, version 10.0, developed and implemented in a GIS environment by ISPRA.
At a national level, the value of the total annual rainfall in 2025 was slightly higher than the average for the period. This circumstance leads to a greater availability of renewable water resources.
The percentage anomaly of precipitation over the entire national territory for the year 2025 was approximately +1%, compared to the long-term average 1951–2025. The slightly higher than average value is attributable to the surplus of precipitation recorded in the North.
Using the Mann-Kendall test, no trend, statistically significant at 5%, is detected in the total annual precipitation value in the period 1951–2025.
| Allegati |
|---|
Thumbnail
Headline
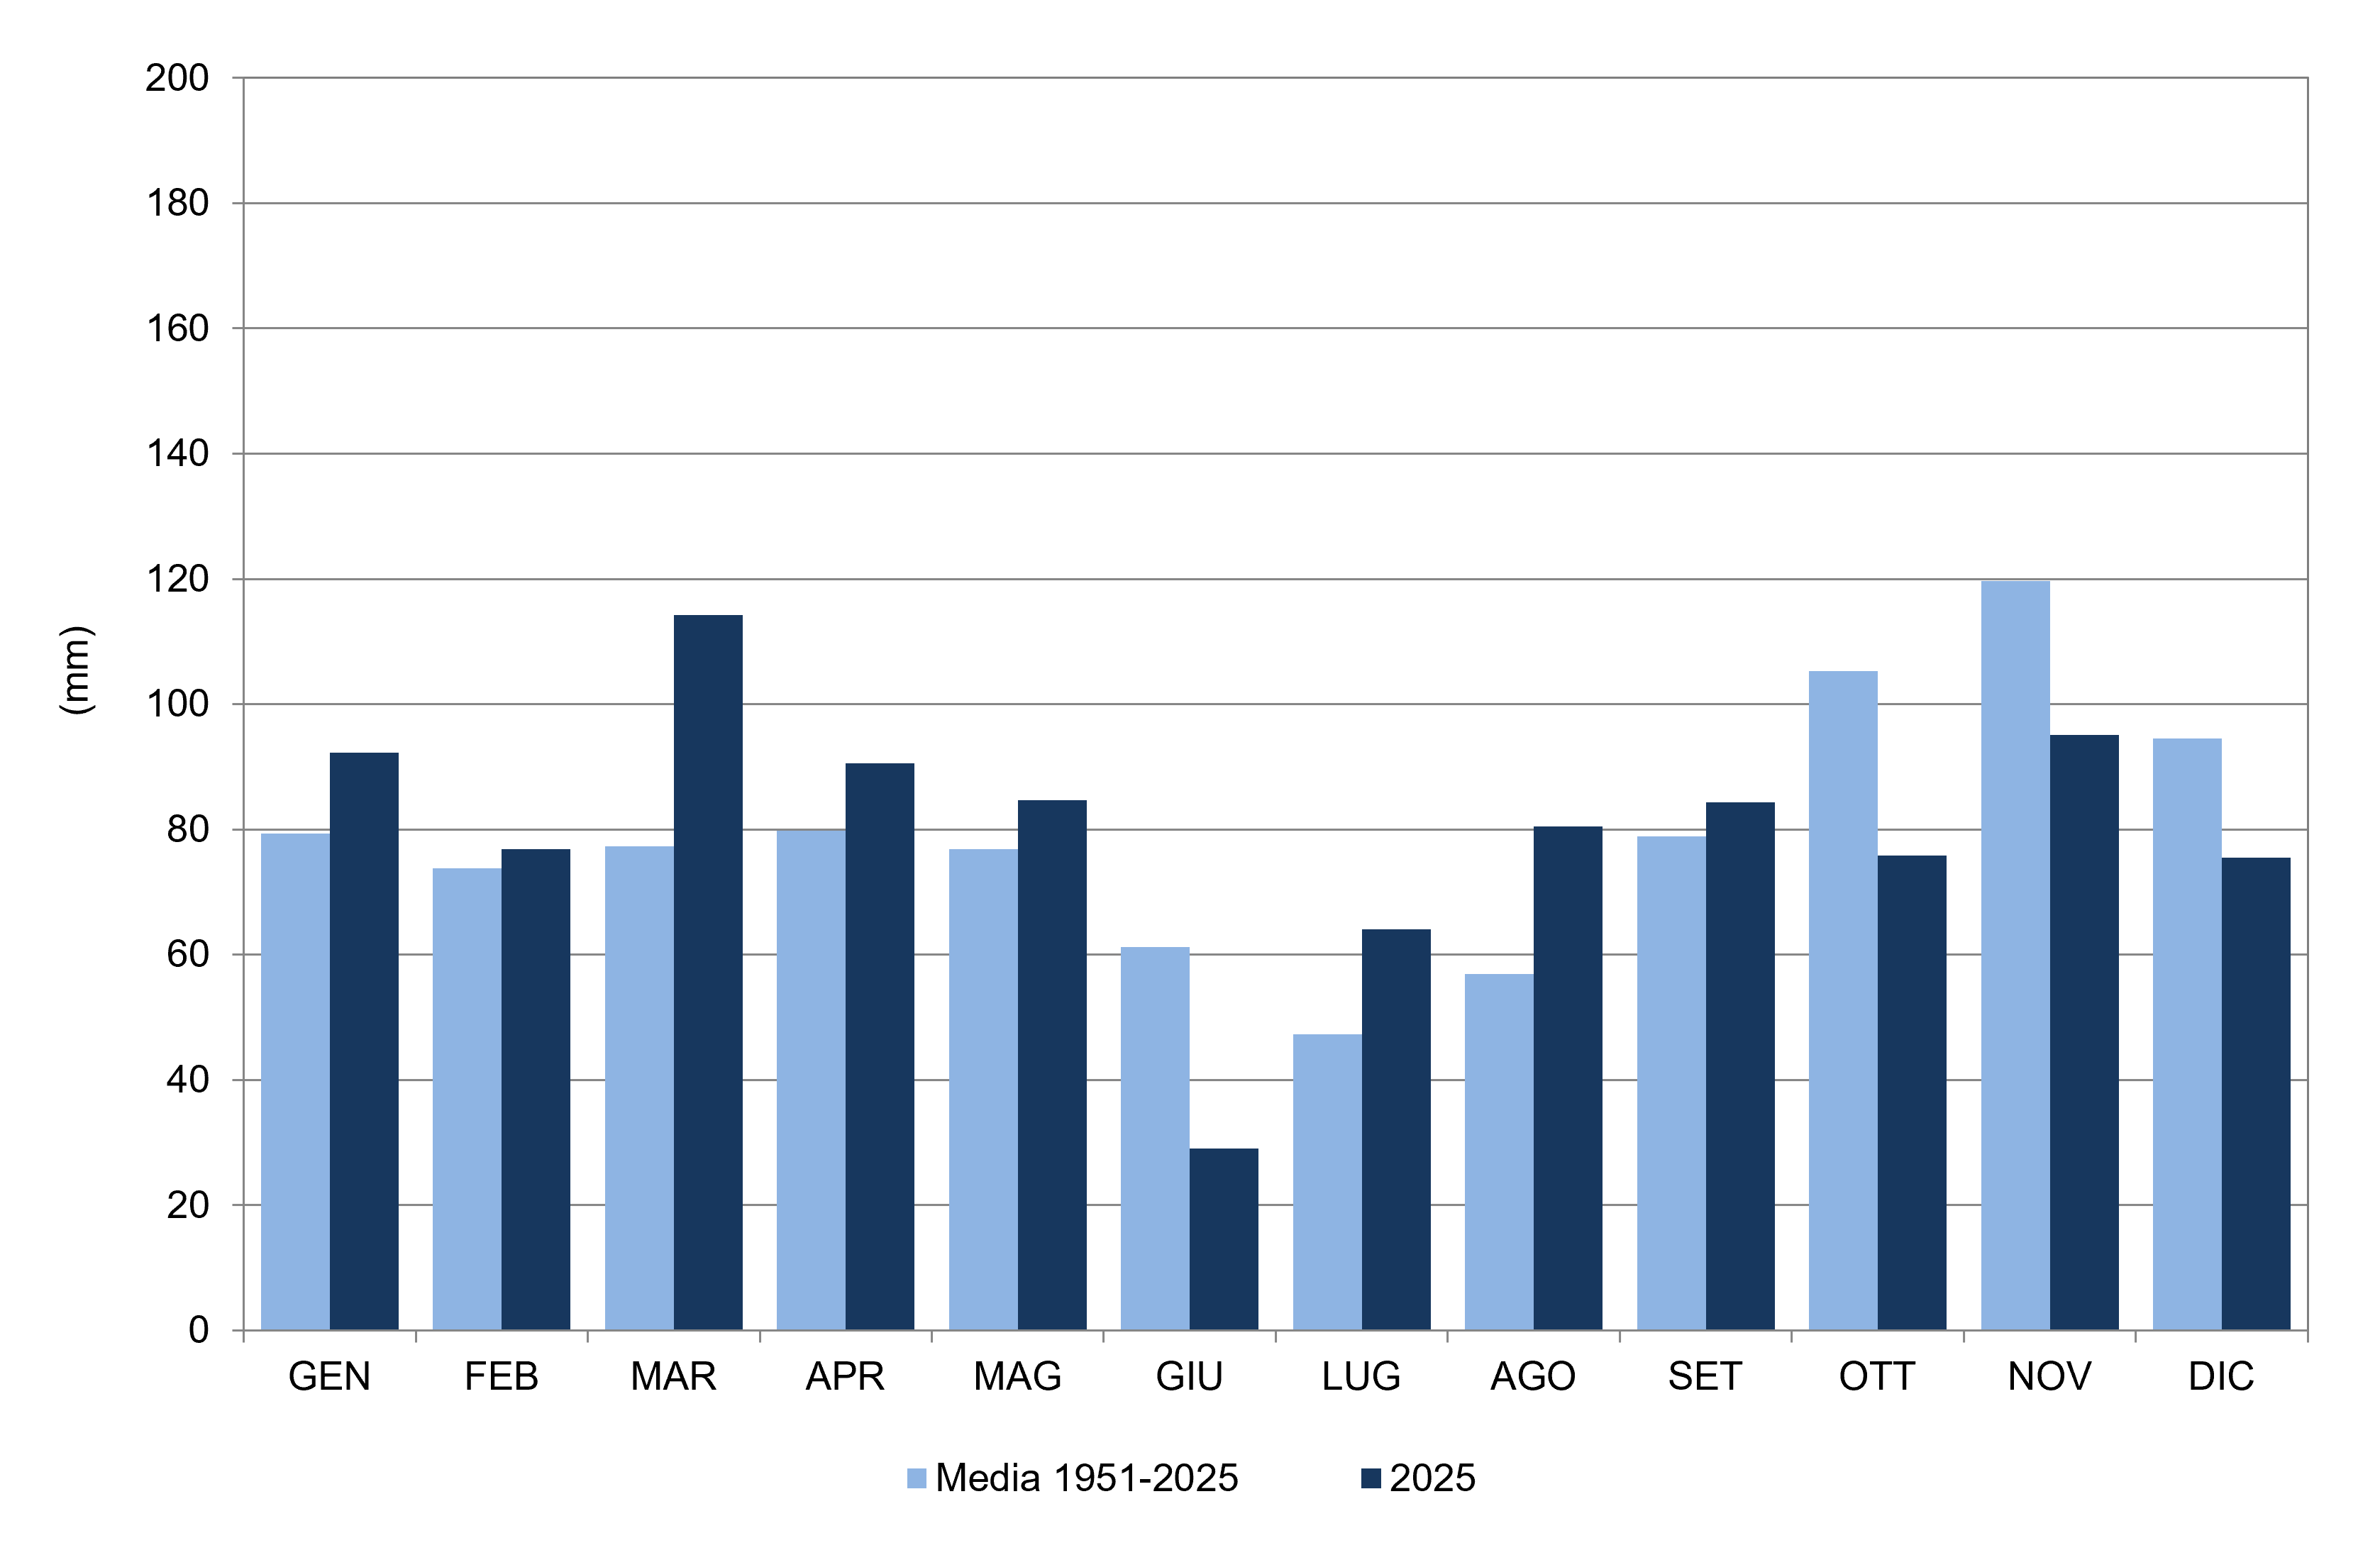
Figure 1: Monthly precipitation height, adjusted to the national territory for 2025 and average for the period 1951–2025 Data source
ISPRA processing on data from regional hydro-meteorological offices and autonomous provinces and historical data from the SIMN suppressed |
Thumbnail
Headline
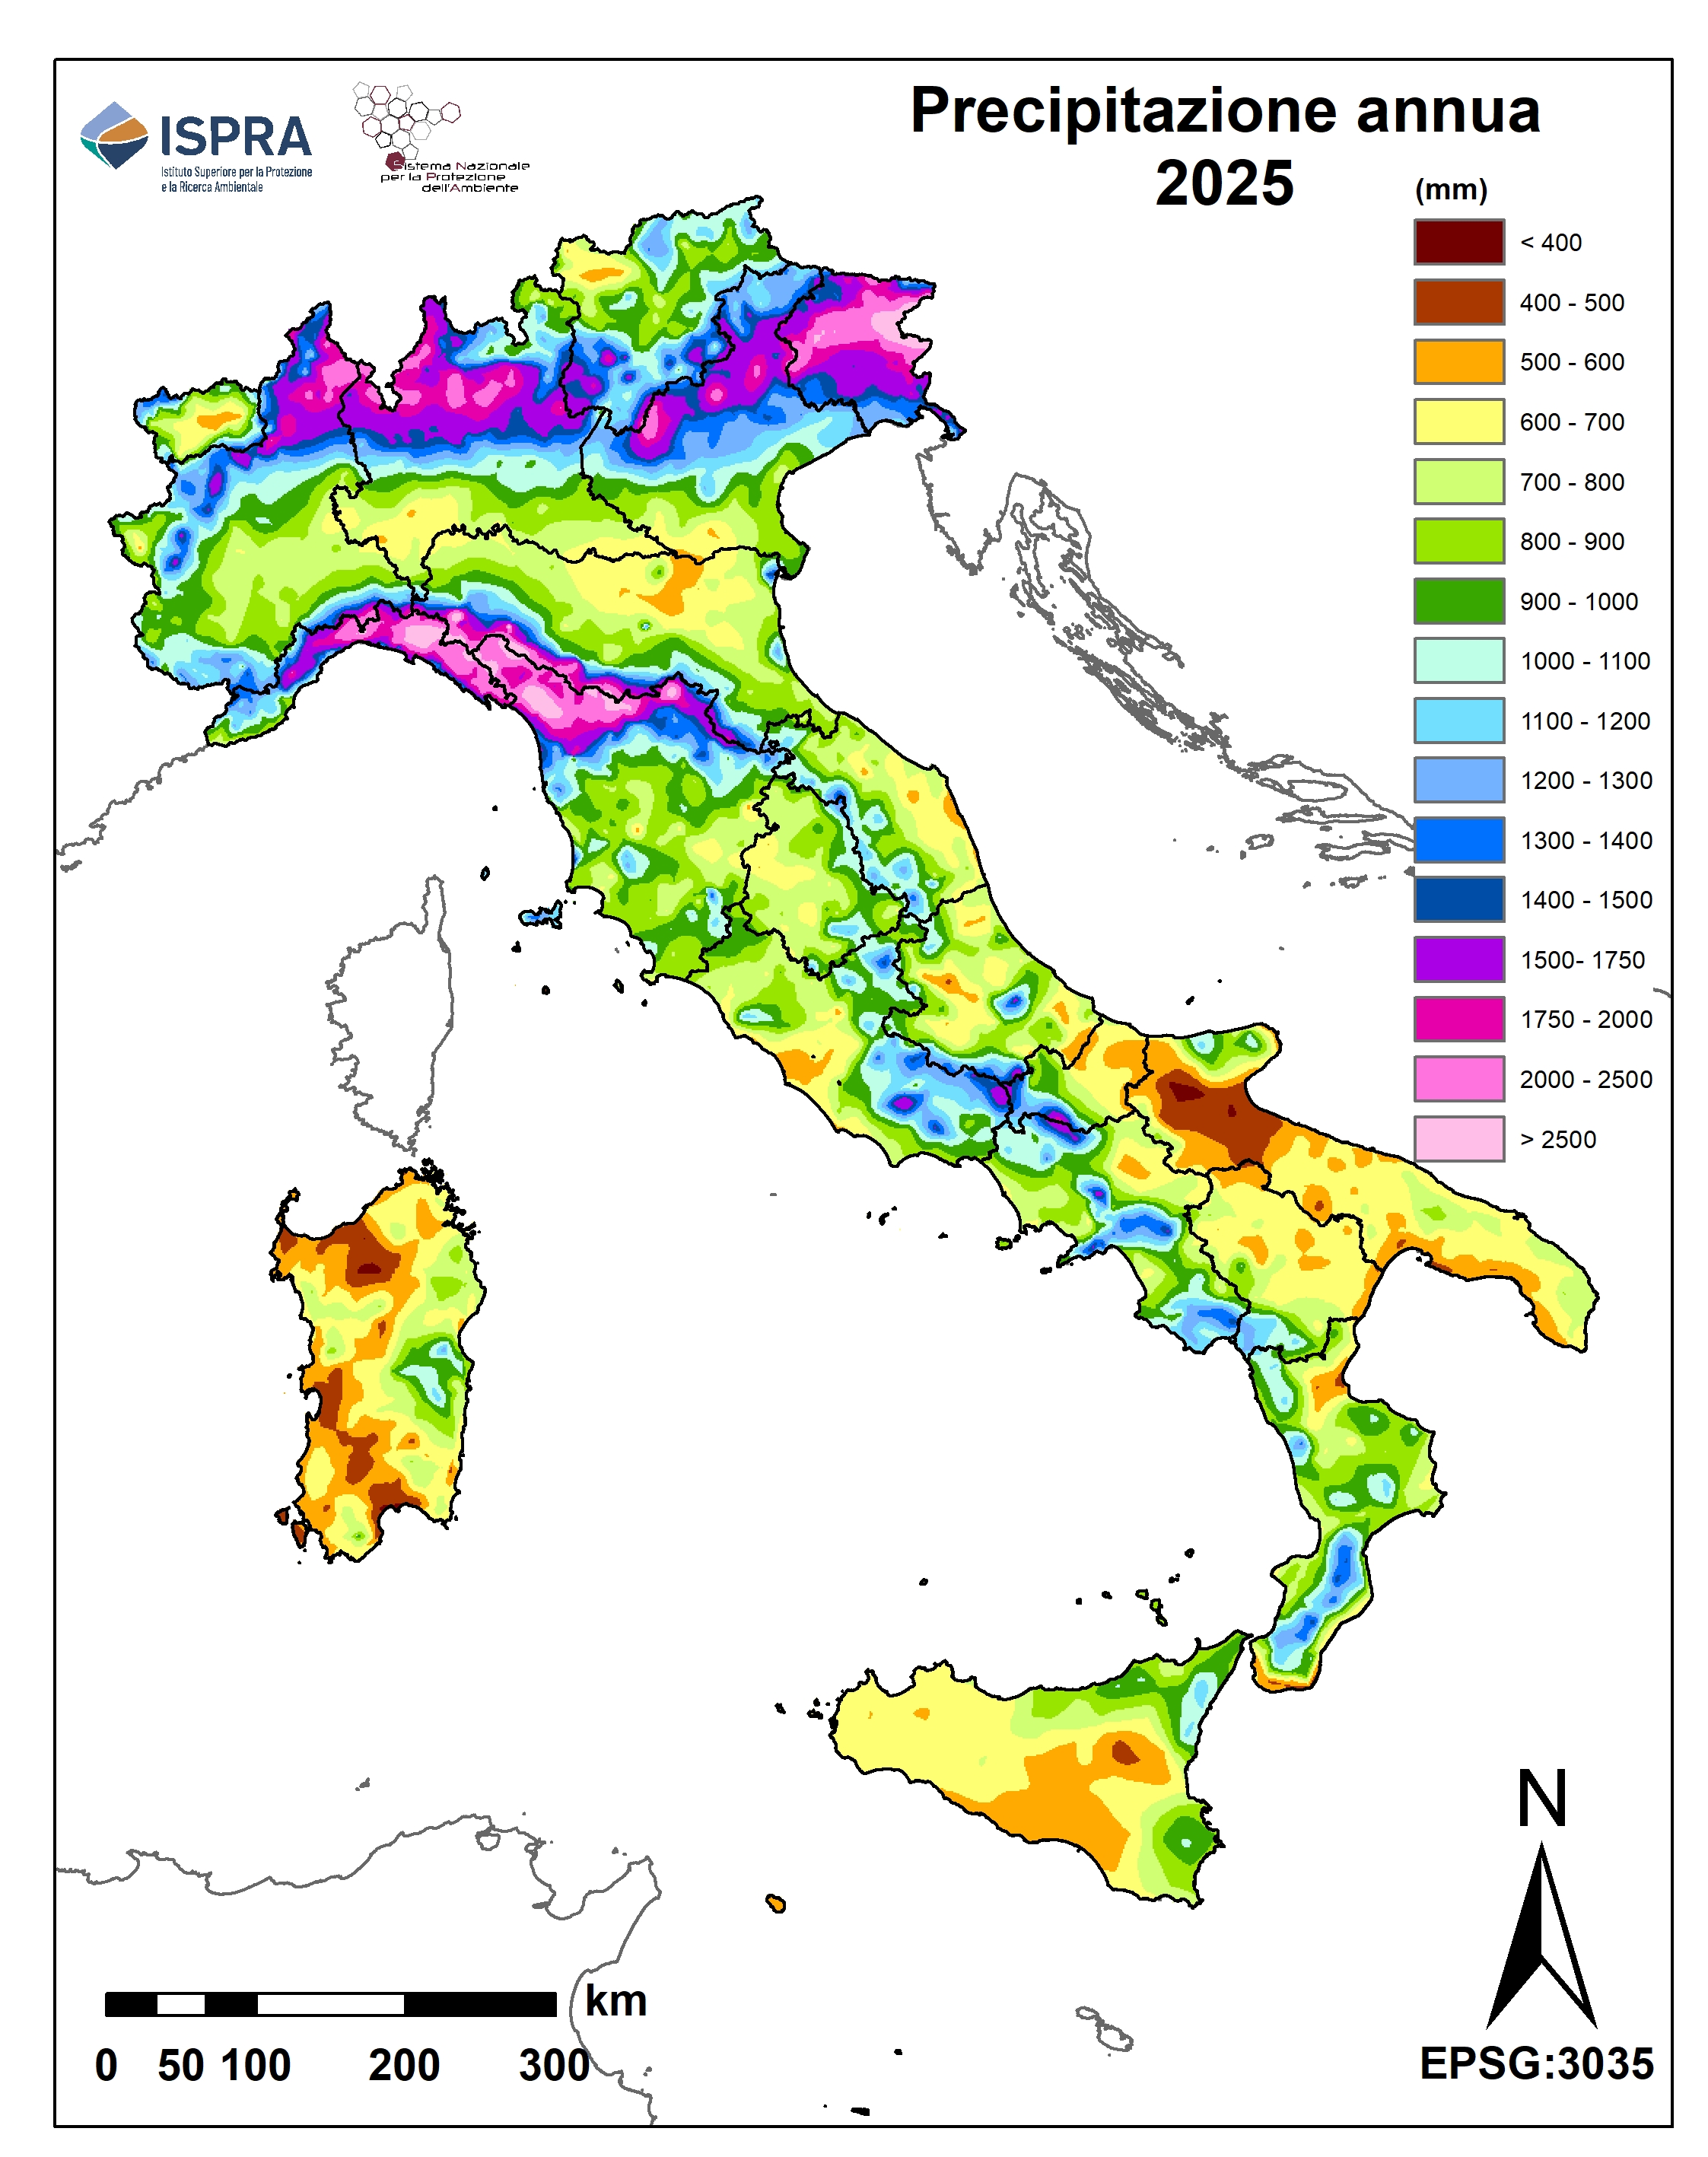
Figure 2: Spatial distribution of the annual precipitation height for 2025 Data source
ISPRA processing on data from regional hydro-meteorological offices and autonomous provinces and historical data from the SIMN suppressed |
Thumbnail
Headline
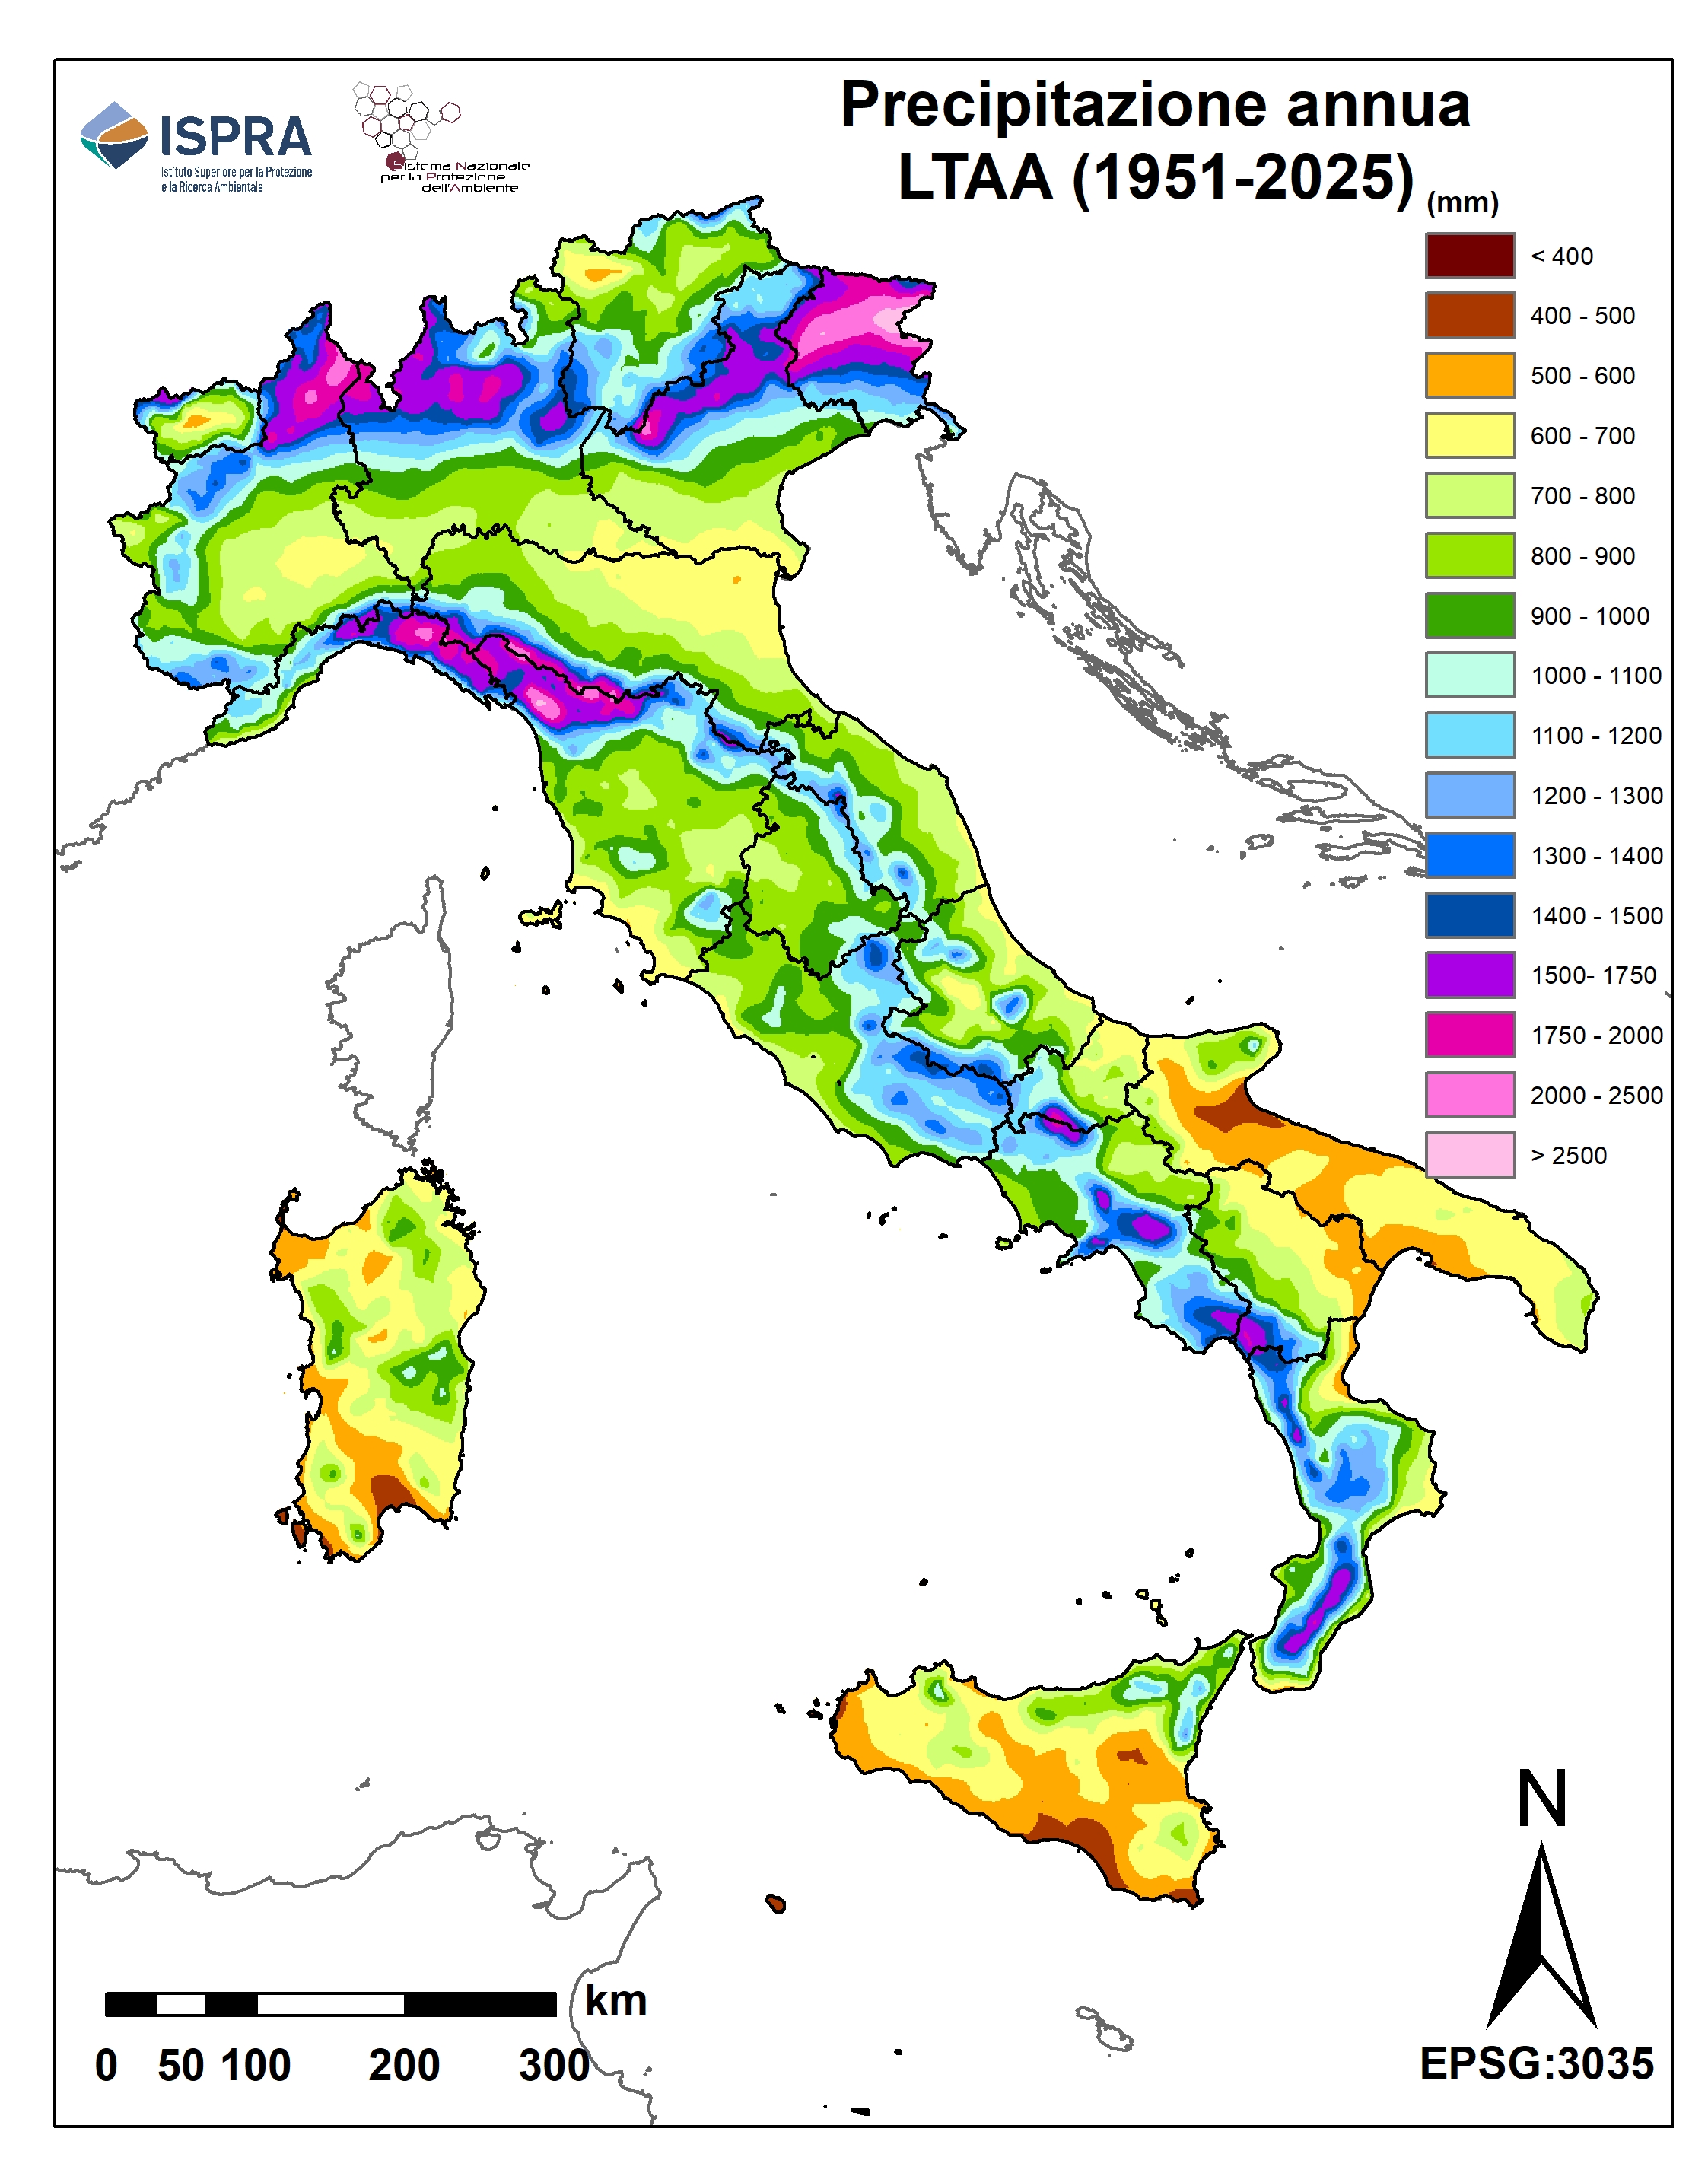
Figure 3: Spatial distribution of long-term average annual precipitation height (LTAA, 1951–2025) Data source
ISPRA processing on data from regional hydro-meteorological offices and autonomous provinces and historical data from the SIMN suppressed |
Thumbnail
Headline
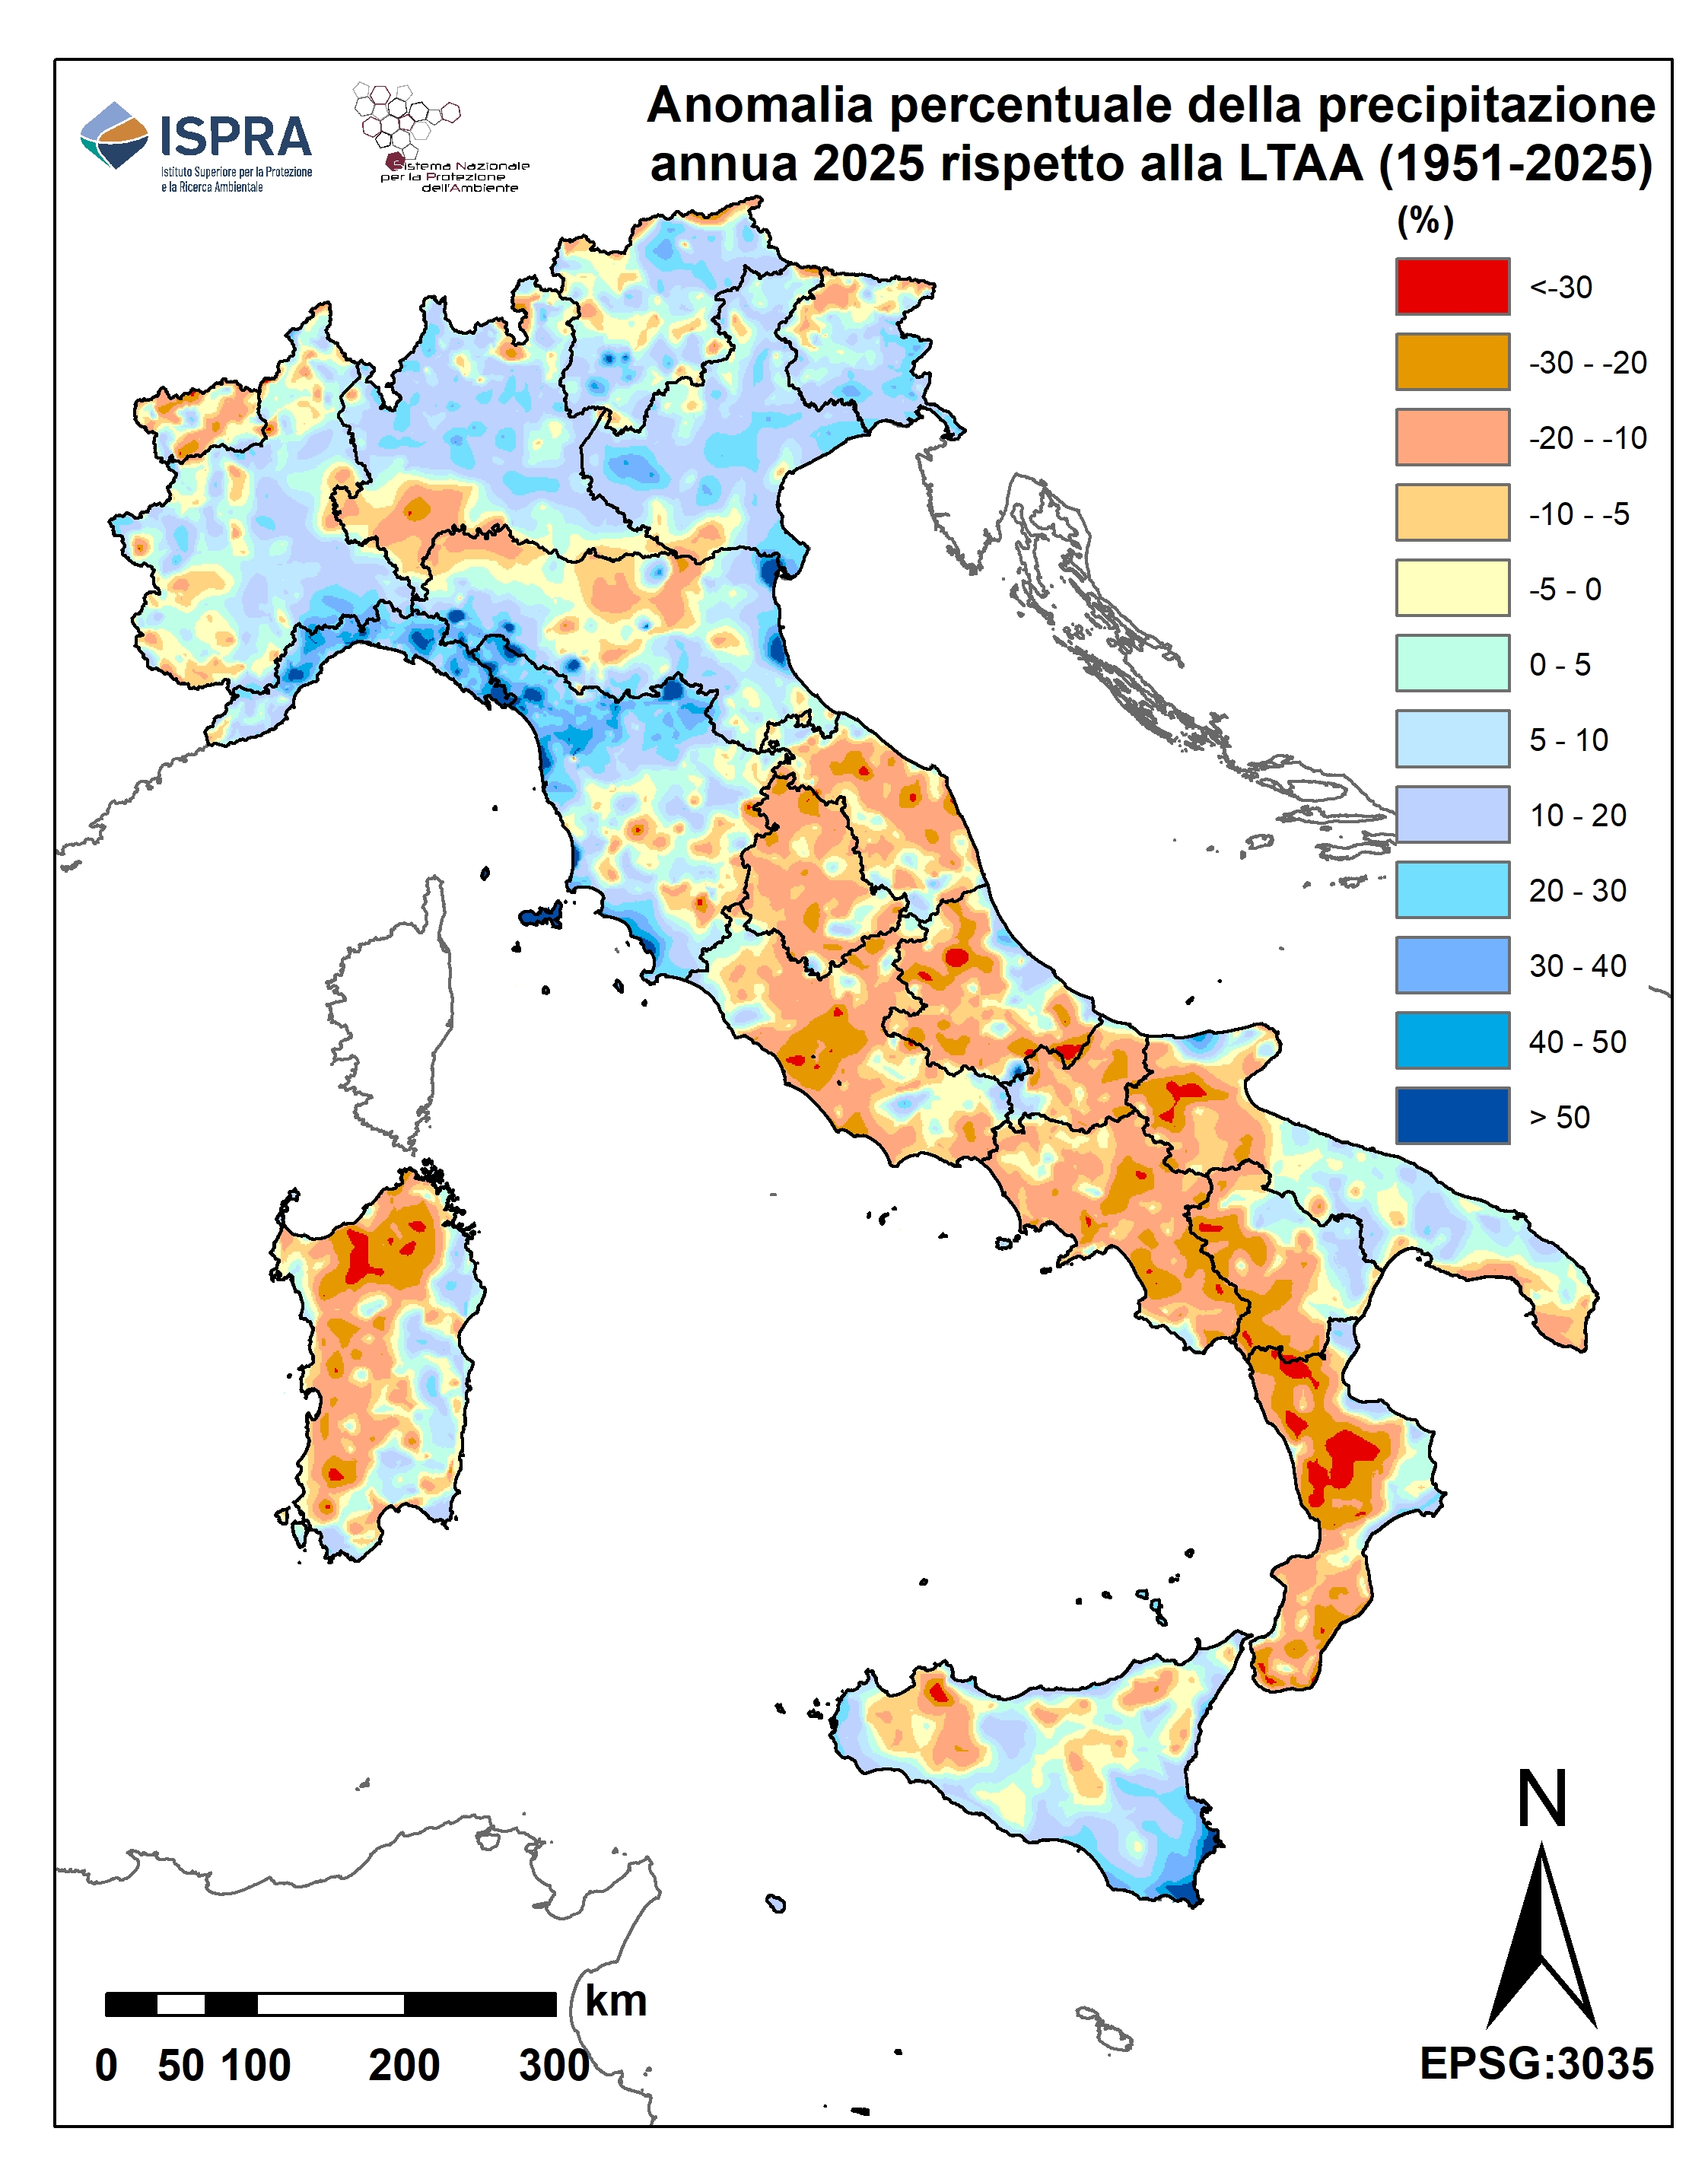
Figure 4: Anomaly percentage of the annual precipitation height of 2025 compared to the average for the period 1951-2025 Data source
ISPRA processing on data from regional hydro-meteorological offices and autonomous provinces and historical data from the SIMN suppressed |
Headline
Dati per Figura 1 Data source
Elaborazione ISPRA su dati degli uffici idro-meteorologici regionali e delle province autonome e su dati storici del soppresso SIMN |
The monthly and annual precipitation estimates for 2025 are compared with their respective long-term average values (LTAA- Long-Term Annual Average ) processed with the same methodology.
Overall at a national level, 2025 was characterized by a slight surplus of precipitation. However, the positive anomaly value was determined by the access of precipitation that affected northern Italy, while the Centre, the South and the major islands suffered, although to a lesser extent than in 2024, a precipitation deficit, with localized conditions of severe and extreme drought and consequent problems of availability of water resources (see the
indicators "Hydrological drought", "Standardized hydro-climatic balance" and "Percentage of Italian territory subject to precipitation deficit and surplus" present in the environmental theme "Water resources and balance" of the environmental indicators database).
The total annual precipitation for the national territory for 2025 was estimated at 962.9 mm (290.9 billion cubic meters), compared to an average (1951–2025) estimated at 950.9 mm (287.2 billion cubic meters). The percentage anomaly compared to the LTAA average over the period 1951–2025, recorded across the entire national territory, was therefore +1%.
If the annual total precipitation in 2025 differed by only +1% compared to the long-term average, the deviations of monthly precipitation in the same year were very different compared to the corresponding average values for the period 1951–2025. As can be seen from Figure 1, in the months of June, October, November and December the monthly precipitation was lower than the monthly reference average, calculated over the long term, with a minimum in June of –53%. The month of March, however, recorded precipitation that was +48% higher than the average. The spatial distribution of annual precipitation on the national territory in 2025 (Figure 2) was also different from the long-term average (Figure 3).
The percentage anomaly of precipitation in 2025 compared to the long-term average highlights, in 2025, a country divided in half with a precipitation surplus which affected Northern Italy with values even higher than 30-40% while a precipitation deficit affected the Center and the South with values locally even lower than -30%. The larger islands, however, present a varied situation, with areas with negative anomaly values and areas with positive anomaly values (Figure 4).
The indicator is transmitted to the European Environment Agency ( European Environmental Agency ) as part of the WISE-SoE data flow ( Water Information System for Europe-State of Environment ).