Data aggiornamento scheda:

Graph

The pressure indicator reports the number, scale, and characteristics of authorized field trials of genetically modified plants (GMPs) in Italy—pursuant to Directive 2001/18/EC—since 1999. The indicator is populated using data obtained from the Ministry of the Environment.

Field trials experienced a sharp decline by 2000, and no new trials were authorized from 2001 onward. The last ongoing trials, initially granted multi-year authorizations, concluded in 2010.

Following the introduction of Law No 68 of 13 June 2023, two new field trials involving genome-edited rice and grapevine—designed for pathogen resistance—were authorized in 2024.


Data aggiornamento scheda:

Graph

The information on the population of the main livestock species, extracted from the National Livestock Register (BDN) managed by the Ministry of Health through the National Service Centre (CSN) at the "G. Caporale" Institute in Teramo — which compiles data on livestock operators, holdings and individual animals, as reported by Veterinary Services and Breeders’ Associations — has been converted into LSU (Livestock Units) to allow for consistent assessment.
The recorded data indicate that in 2024 — the latest full year available for the main livestock species considered — there was an overall decrease in livestock numbers (expressed in Livestock Units - LSU) of 3.3% over the 2019–2024 period, and a 1.9% decline compared to 2023.
In detail, the largest percentage reduction in LSUs was observed in sheep and goat breeds, with a 16.7% decrease over the five-year period and a 6.4% drop in the most recent year.
The gradual decline in cattle numbers also continues (-3.9% over five years and -1.5% between 2023 and 2024), while buffalo numbers show a consistent increase (+9.1% over five years and +0.9% in the last year), confirming the trend toward replacement in livestock farming practices.

This trend appears to be driven by both the greater hardiness of the buffalo and recent European policy developments (such as the Common Agricultural Policy, the European Green Deal, and Regulation (EU) 2024/1991 – the so-called Nature Restoration Law), which support pasture-based livestock systems and the restoration of wetlands — environments particularly well-suited to buffalo farming. The current absence of production restrictions (e.g. “milk quotas”) on buffalo also contributes to this shift.


Data aggiornamento scheda:

Graph

The indicator considers fertilisers used in agriculture, i.e. inputs primarily employed to support crop growth. It analyses their spatial and temporal distribution to provide an overall representation of environmental impact, based on the quantities and types of fertilisers placed on the market.

In 2023, more than 4.5 million tonnes of fertilisers were placed on the market.

Mineral fertilisers (including simple, compound, and those based on meso- and micronutrients) accounted for 40.7% of the total. This category has historically been the most sold, with the only exception in 2022, despite a long-term decline (2000–2023).

Organic fertilisers (including soil improvers and organic fertilisers) followed closely, representing 39.8% of total sales, with a long-term upward trend (2000–2023). The most sold subcategory was soil improvers, with over 1.2 million tonnes. Their sales volume has remained relatively stable in recent years and, for the second consecutive year, exceeded that of simple mineral fertilisers, which remain the dominant subcategory within mineral fertilisers (64.7%).


Data aggiornamento scheda:

Graph

In 2022, approximately 103 thousand tonnes of plant protection products (PPPs) were placed on the market, containing around 44.5 thousand tonnes of active substances.

Compared to the previous year (2021), sales of PPPs declined by 11.6%. A similar decrease was recorded in the volume of active substances, which fell from approximately 50 million kilograms in 2021 to 45 million in 2022 (-11.5%). Consequently, the quantity of active substances distributed per hectare also decreased: from 4.0 kilograms per hectare of Utilised Agricultural Area (UAA) in 2021 to 3.6 kilograms in 2022.

Over the broader period from 2014 to 2022, the PPP market experienced a contraction of -20.8%. Active substances declined by 25.0% relative to 2014, the year the previous National Action Plan (PAN) for the sustainable use of PPPs entered into force—currently undergoing advanced revision. Trends vary by product category: active substances in fungicides declined by -21%, insecticides and acaricides by -32.3%, herbicides by -40.8%, and miscellaneous products by -26.5%. In contrast, biological products showed a notable increase of approximately 59% since 2014; however, they still represent only a minor market share of 1.1% of the total.


Data aggiornamento scheda:

Graph

n 2023, organic farming in Italy covered 2,456,020 hectares, involving approximately 94,400 organic operators. Organic agriculture accounted for 7.4% of all farms and 19.8% of the utilised agricultural area (UAA), according to the 2021 ISTAT Census, falling 5.2 percentage points short of the 25% UAA target for organic farming. 

Over the past 33 years, the trend has been upward in both the number of operators and cultivated area, countering the long-standing decline in utilised agricultural area in Italy.

 At the European level, Italy ranks among the most virtuous Member States.


Data aggiornamento scheda:

Graph

Systemic food wastage in the Italian food system amounts to 66% of the total food energy produced. There has been a 17% increase in food wastage compared to 2015, measured in kilocalories per person per day. This situation remains far from institutional targets of halving or significantly reducing food wastage by 2030.


Data aggiornamento scheda:

Graph

The indicator describes ammonia (NH₃) emissions into the atmosphere produced by the agricultural sector, mainly due to livestock management and fertilizer use. It enables the assessment of the sector's contribution to total national emissions and the achievement of reduction targets.

In 2022, the agricultural sector was responsible for emitting 317.25 kt of NH₃ into the atmosphere, accounting for 90.4% of total national emissions.

The trend in NH₃ emissions is consistent with the targets set by the Gothenburg Protocol and the National Emission Ceiling Directive (NEC Directive). The national reduction target for 2022 has been achieved.


Data aggiornamento scheda:

Graph

Bees, pollen, and other beekeeping matrices provide important information about the state of the environment, particularly in relation to chemical contamination from plant protection products (pesticides). Laboratory analyses can detect active substances from these products on the bees' bodies and in the pollen they collect during their flights in treated areas.

ISPRA has long been involved in research and monitoring activities aimed at identifying the possible factors and causes of honey bee colony mortality, including those related to agricultural practices involving the use of pesticides, especially in natural and agriculturally intensive areas.

The data collected suggest a fluctuating trend around an annual average of several dozen bee mortality cases, often with the detection of active pesticide ingredients on the bees or in other beekeeping matrices.


Data aggiornamento scheda:

Graph

The indicator analyses the capacity of the national agricultural sector to stimulate economic growth while simultaneously reducing environmental pressures and impacts. The purpose of the indicator is to measure the eco-efficiency of agriculture, that is, its ability to decouple economic growth factors from increasing environmental pressures and impacts.

The evolution of the variables shows a positive trend in the eco-efficiency of Italian agriculture over the analysis period (2000–2022). This is evident when comparing the performance of the economic variable (represented by the value added at basic prices) with the trend of environmental pressures, which have all decreased compared to the base year (2000) — with the exception of irrigated areas — although not all reductions have been substantial (e.g. energy use).


Data aggiornamento scheda:

Graph

The indicator describes greenhouse gas (GHG) emissions (CH₄, N₂O, CO₂) released into the atmosphere by the agricultural sector, mainly due to livestock management and fertilizer use. It allows for the assessment of the sector’s contribution to total national emissions and the achievement of emission reduction targets.

Since 1990, greenhouse gas emissions from the agricultural sector have shown a decreasing trend; however, further mitigation measures will be necessary to meet the targets established under the United Nations Framework Convention on Climate Change (UNFCCC), the Kyoto Protocol, and relevant European directives.

Specifically, Italy’s target for 2030 under the Effort Sharing Regulation (Regulation (EU) 2023/857) is a -43.7% reduction in total GHG emissions from agriculture, buildings, transport, waste, and industrial installations not covered by the EU Emissions Trading System (EU-ETS), compared to 2005 levels.

In 2022, GHG emissions from agriculture accounted for a relatively small share (11.2%) of total emissions from sectors covered by the Effort Sharing Regulation, while emissions from agriculture decreased by 12.2% compared to 2005.


Data aggiornamento scheda:

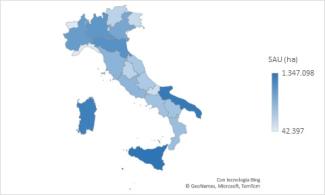
The indicator estimates the scale of the agricultural sector and its potential environmental impact through the number of agricultural and livestock holdings and the Utilised Agricultural Area (UAA). A comparison of data from the last two Agricultural Censuses (2010 and 2020) reveals a nationwide reduction of 488,000 holdings (-30.1%) and a decline of 424,000 hectares in Utilised Agricultural Area (-3.3%). Moreover, analysis of the change in the average size of holdings shows that the UAA per holding increased from 8 to 11 hectares, highlighting a significant trend toward the concentration of agricultural enterprises.