Valter BELLUCCI, Sonia ROSSI (Istat), Giovanni SERI (Istat)
In 2024, approximately 93.6 thousand tonnes of plant protection products were placed on the market, containing a total of 40.4 thousand tonnes of active substances. When related to the treatable utilised agricultural area (UAA), the amount of active substances distributed was 4.53 kg/ha.
Compared with the previous year, sales of plant protection products increased slightly (+0.8%). A similarly modest increase was recorded in the quantity of active substances contained in these products, rising from 40.0 million kilograms in 2023 to approximately 40.4 million kilograms in 2024 (+0.9%).
Over the longer period 2014–2024, the market for plant protection products contracted by 28.0%. The quantity of active substances decreased by 32.1% compared with 2014, the year in which the previous National Action Plan (NAP) for the sustainable use of plant protection products entered into force. Trends differed across product categories. Active substances in fungicides declined by 35.6%, insecticides and acaricides by 23.8%, herbicides by 26.8%, and other plant protection products by 33.1%. In contrast, biological plant protection products increased by approximately 150% between 2014 and 2024; however, they still account for only a small share of the market, representing about 2% of the total.
The indicator allows us to evaluate the quantities of plant protection products released annually for consumption for agricultural use, as well as to compare distribution orientations over time and on a territorial basis. The data used to construct the indicator are provided by Istat and come from the census survey carried out every year among companies that distribute, in Italy, plant protection products under their own brand or with foreign brands (survey included in the National Statistical Plan (IST-00168)). Istat data consider products useful for protecting plants or plant products from harmful organisms (fungi, insects, mites, bacteria and viruses) and weeds and those suitable for promoting or regulating the vital processes of plants, with the exclusion of fertilizers. The data is analyzed in relation to the different types of distribution (fungicides, insecticides and acaricides, herbicides, various, biological and traps) and to the active substances contained in them, which carry out direct action against the adversities for which the product is used. Furthermore, they are expressed in relation to the treatable surface area, which includes arable land (excluding fallow land), family vegetable gardens and woody agricultural crops.
Represent the quantity of plant protection products distributed for agricultural use and evaluate their distribution dynamics on a national and regional basis. The indicator is useful for an overall representation of the environmental problems associated with distribution.
The legislation on plant protection products in Italy is in line with European directives:
- Directive 2009/128/EC establishes a framework for community action for the sustainable use of plant protection products.
- Directive 2009/127/EC relating to machines for the application of pesticides and Regulation (EC) no. 1185/2009 relating to statistics on pesticides.
- Presidential Decree 290/2001, article 42, paragraph 3) buyers and users are obliged to compile and keep a field diary (treatment register or "field notebook") in the company, where they note down all the treatments carried out during the cultivation season.
- Implementing Regulation (EU) 2022/1252 list of active substances candidate for substitution published in the Official Journal n.191/41 of 07/20/2022.
Istat, 2025, Noi Italia 2025 ( https://noi-italia. istat. it/pagina. php? id=3&categoria=11&action=show&L=0)
Istat, 2019, The distribution of plant protection products for agricultural use. Agricultural reference year 2017. Report statistics (https://www. istat. it/it/archivio/216611) https://esploradati. istat. it/
Istat, 2015, The distribution of plant protection products for agricultural use. Agricultural reference year 2013 Report statistics (https://www. istat. it/it/files//2015/01/Fitosanitari-e-fertilizzanti. pdf)
Istat, 2012, The distribution of fertilizers for agricultural use. Agricultural reference year 2010. Report statistics. (http://www. istat. it/it/archivio/108926)
Istat, 2011, The distribution of plant protection products for agricultural use. Agricultural reference year 2010. Report statistics.
Istat, 2011, Use of plant protection products in vine cultivation - Agricultural reference year 2009-2010. Statistics in brief, agriculture ISTAT, 2012, 6th General Agricultural Census. www. istat. it
Istat, 2010, The distribution of plant protection products for agricultural use. Agricultural reference year 2009. Statistics in brief, agriculture
Since the data does not refer to use by agricultural operators, it is not possible to quantify their use in different agricultural crops, consider the environmental factors that influence their use in agriculture and analyze their impact on the environment and human health. Furthermore, the data is collected from the distributor (who can also be a producer) and this distributed quantity is considered variable proxy of the sold and therefore of the used.
Support the information provided by this indicator with reliable data on the quantities actually used for agricultural purposes on a territorial, crop, etc. Basis.
Istat (National Institute of Statistics)
Istat, Plant protection products ( https://esploradati. istat. it/databrowser/#/it/dw/categories/IT1, Z1000AGR,1.0/AGR_MEANS/DCSP_FITOSANITARI )
National; Regional
2003 - 2024
The data used to construct the indicator are provided by Istat and come from the census survey carried out every year among companies that distribute plant protection products under their own brand or with foreign brands. Companies are asked to indicate, in kilograms, the quantity distributed for agricultural use, both nationally produced and imported, of plant protection products released for consumption annually in the individual provinces.
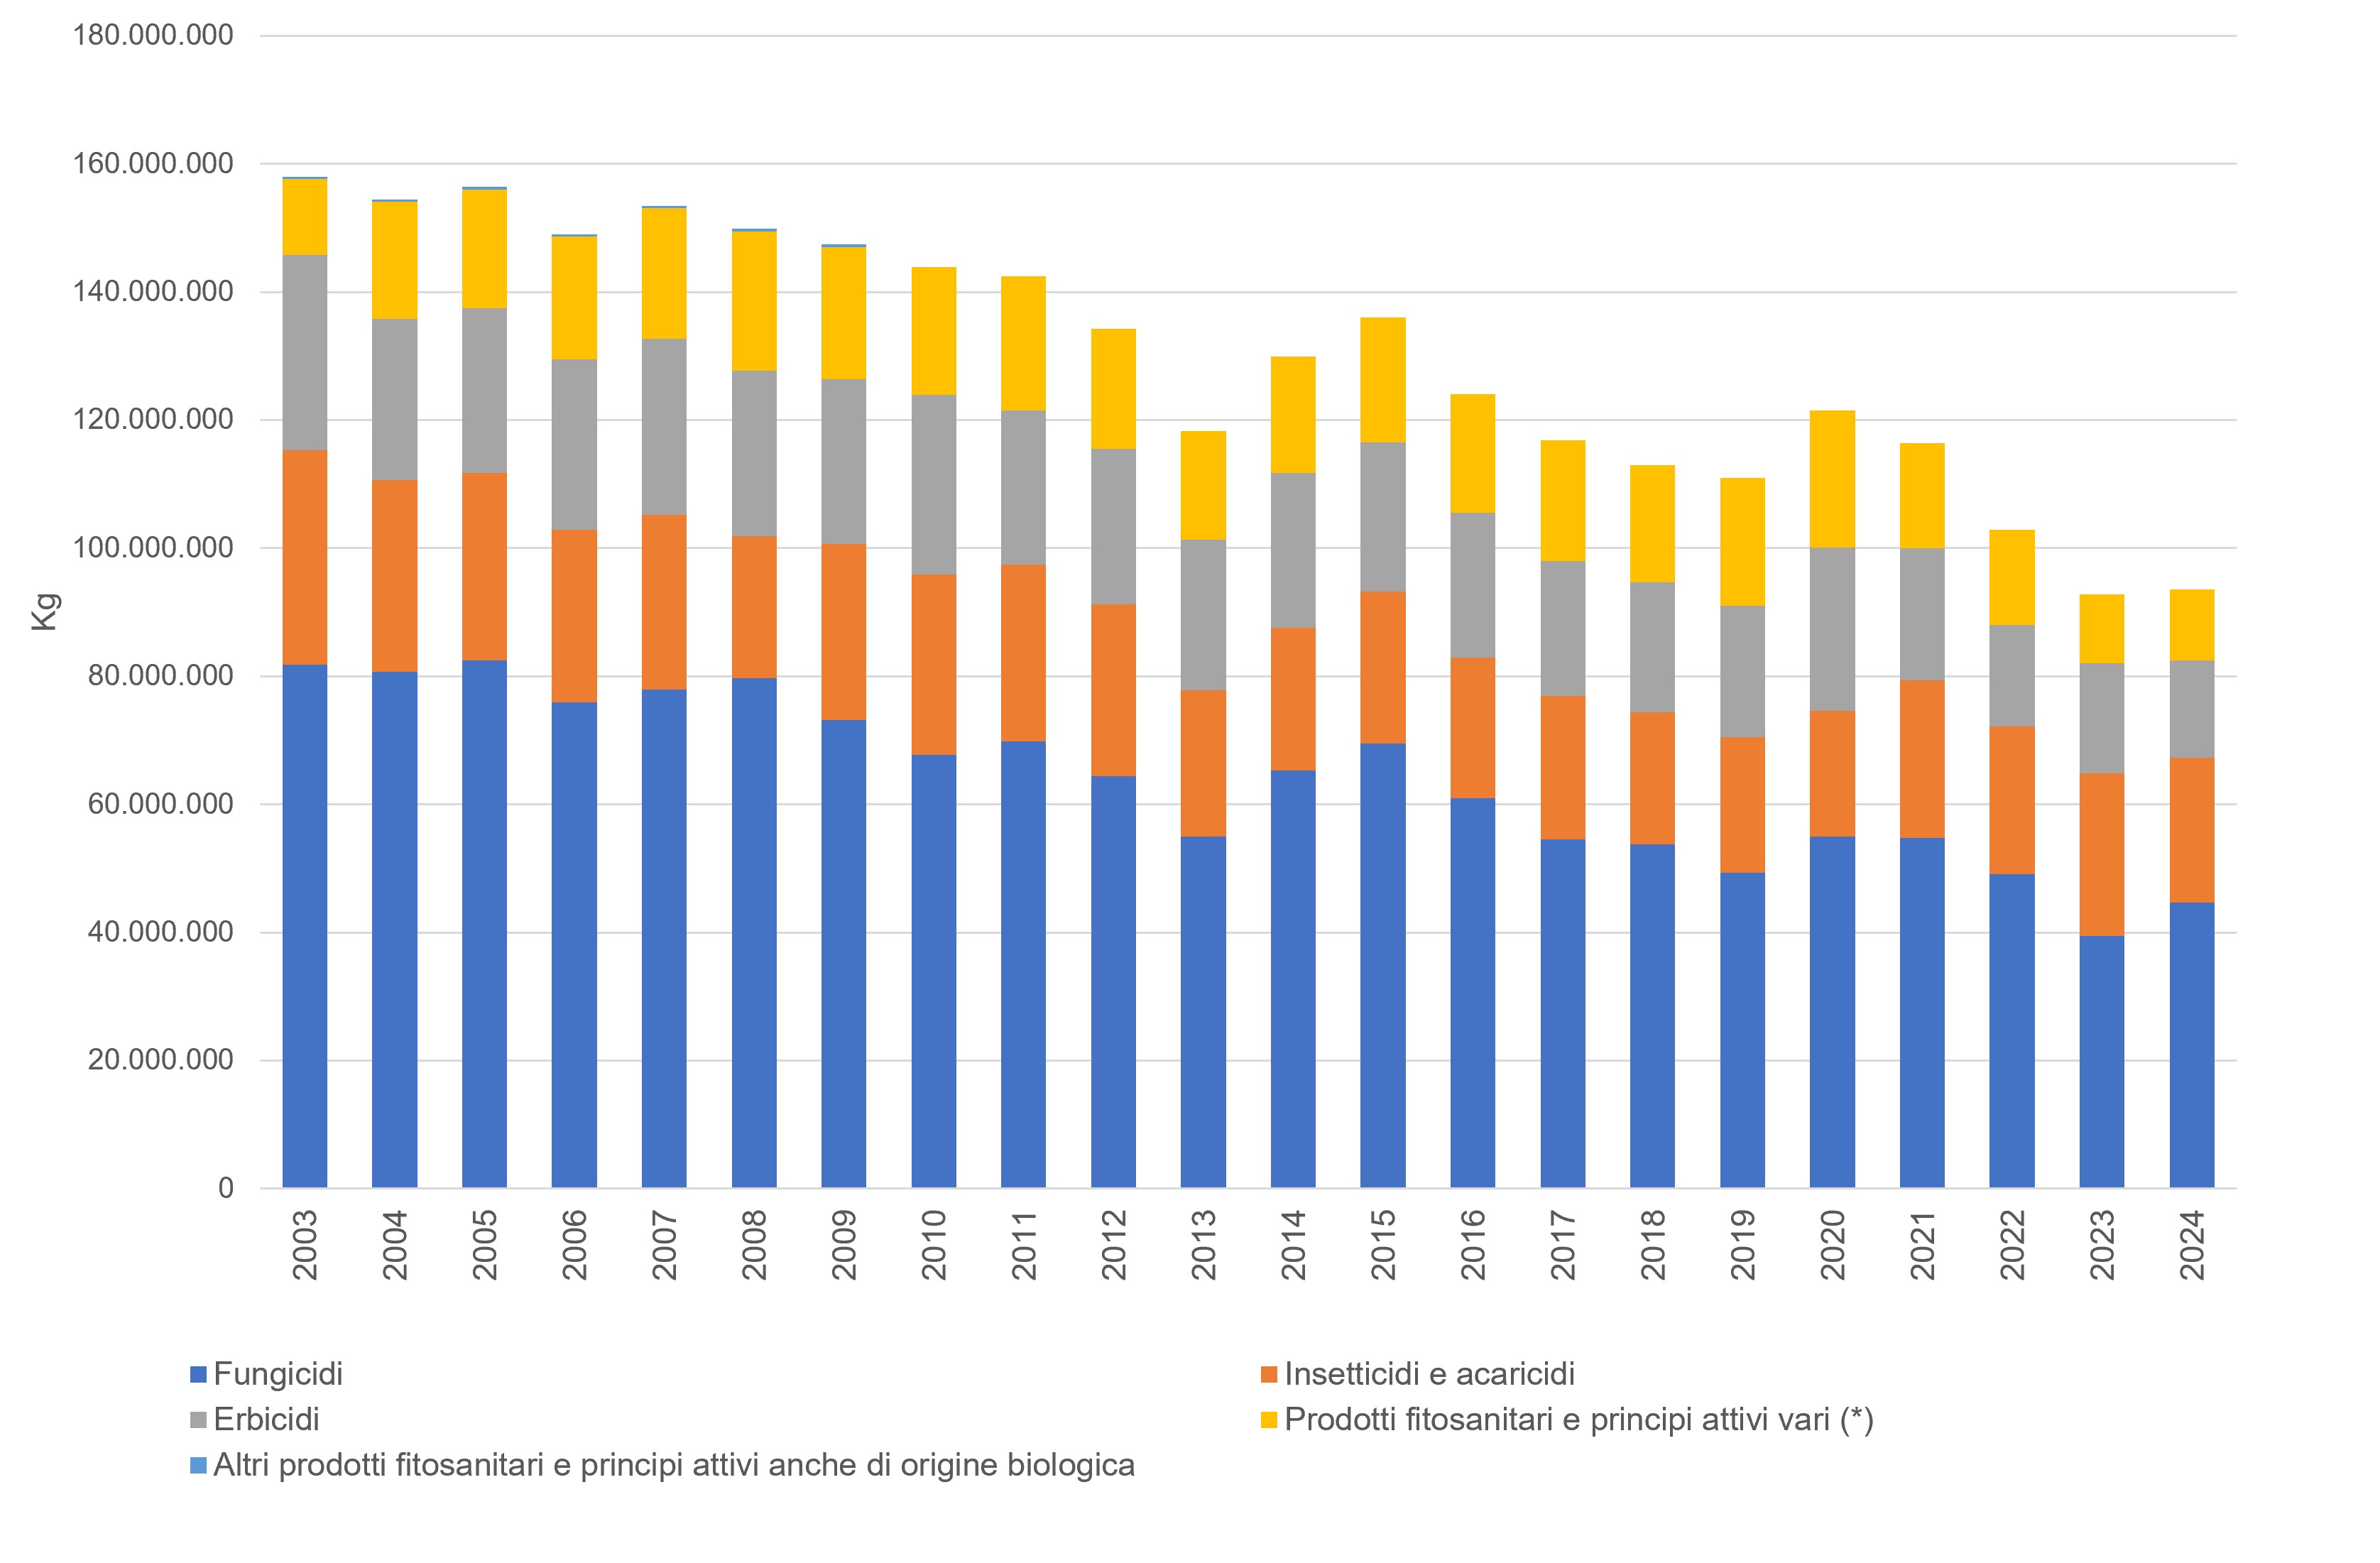
In 2024, approximately 93.6 thousand tonnes of plant protection products (PPPs) were placed on the market. Of the total, 47.7% consisted of fungicides, 24.2% of insecticides and acaricides, 16.3% of herbicides, and 11.8% of other plant protection products (Table 1 and Figure 1).
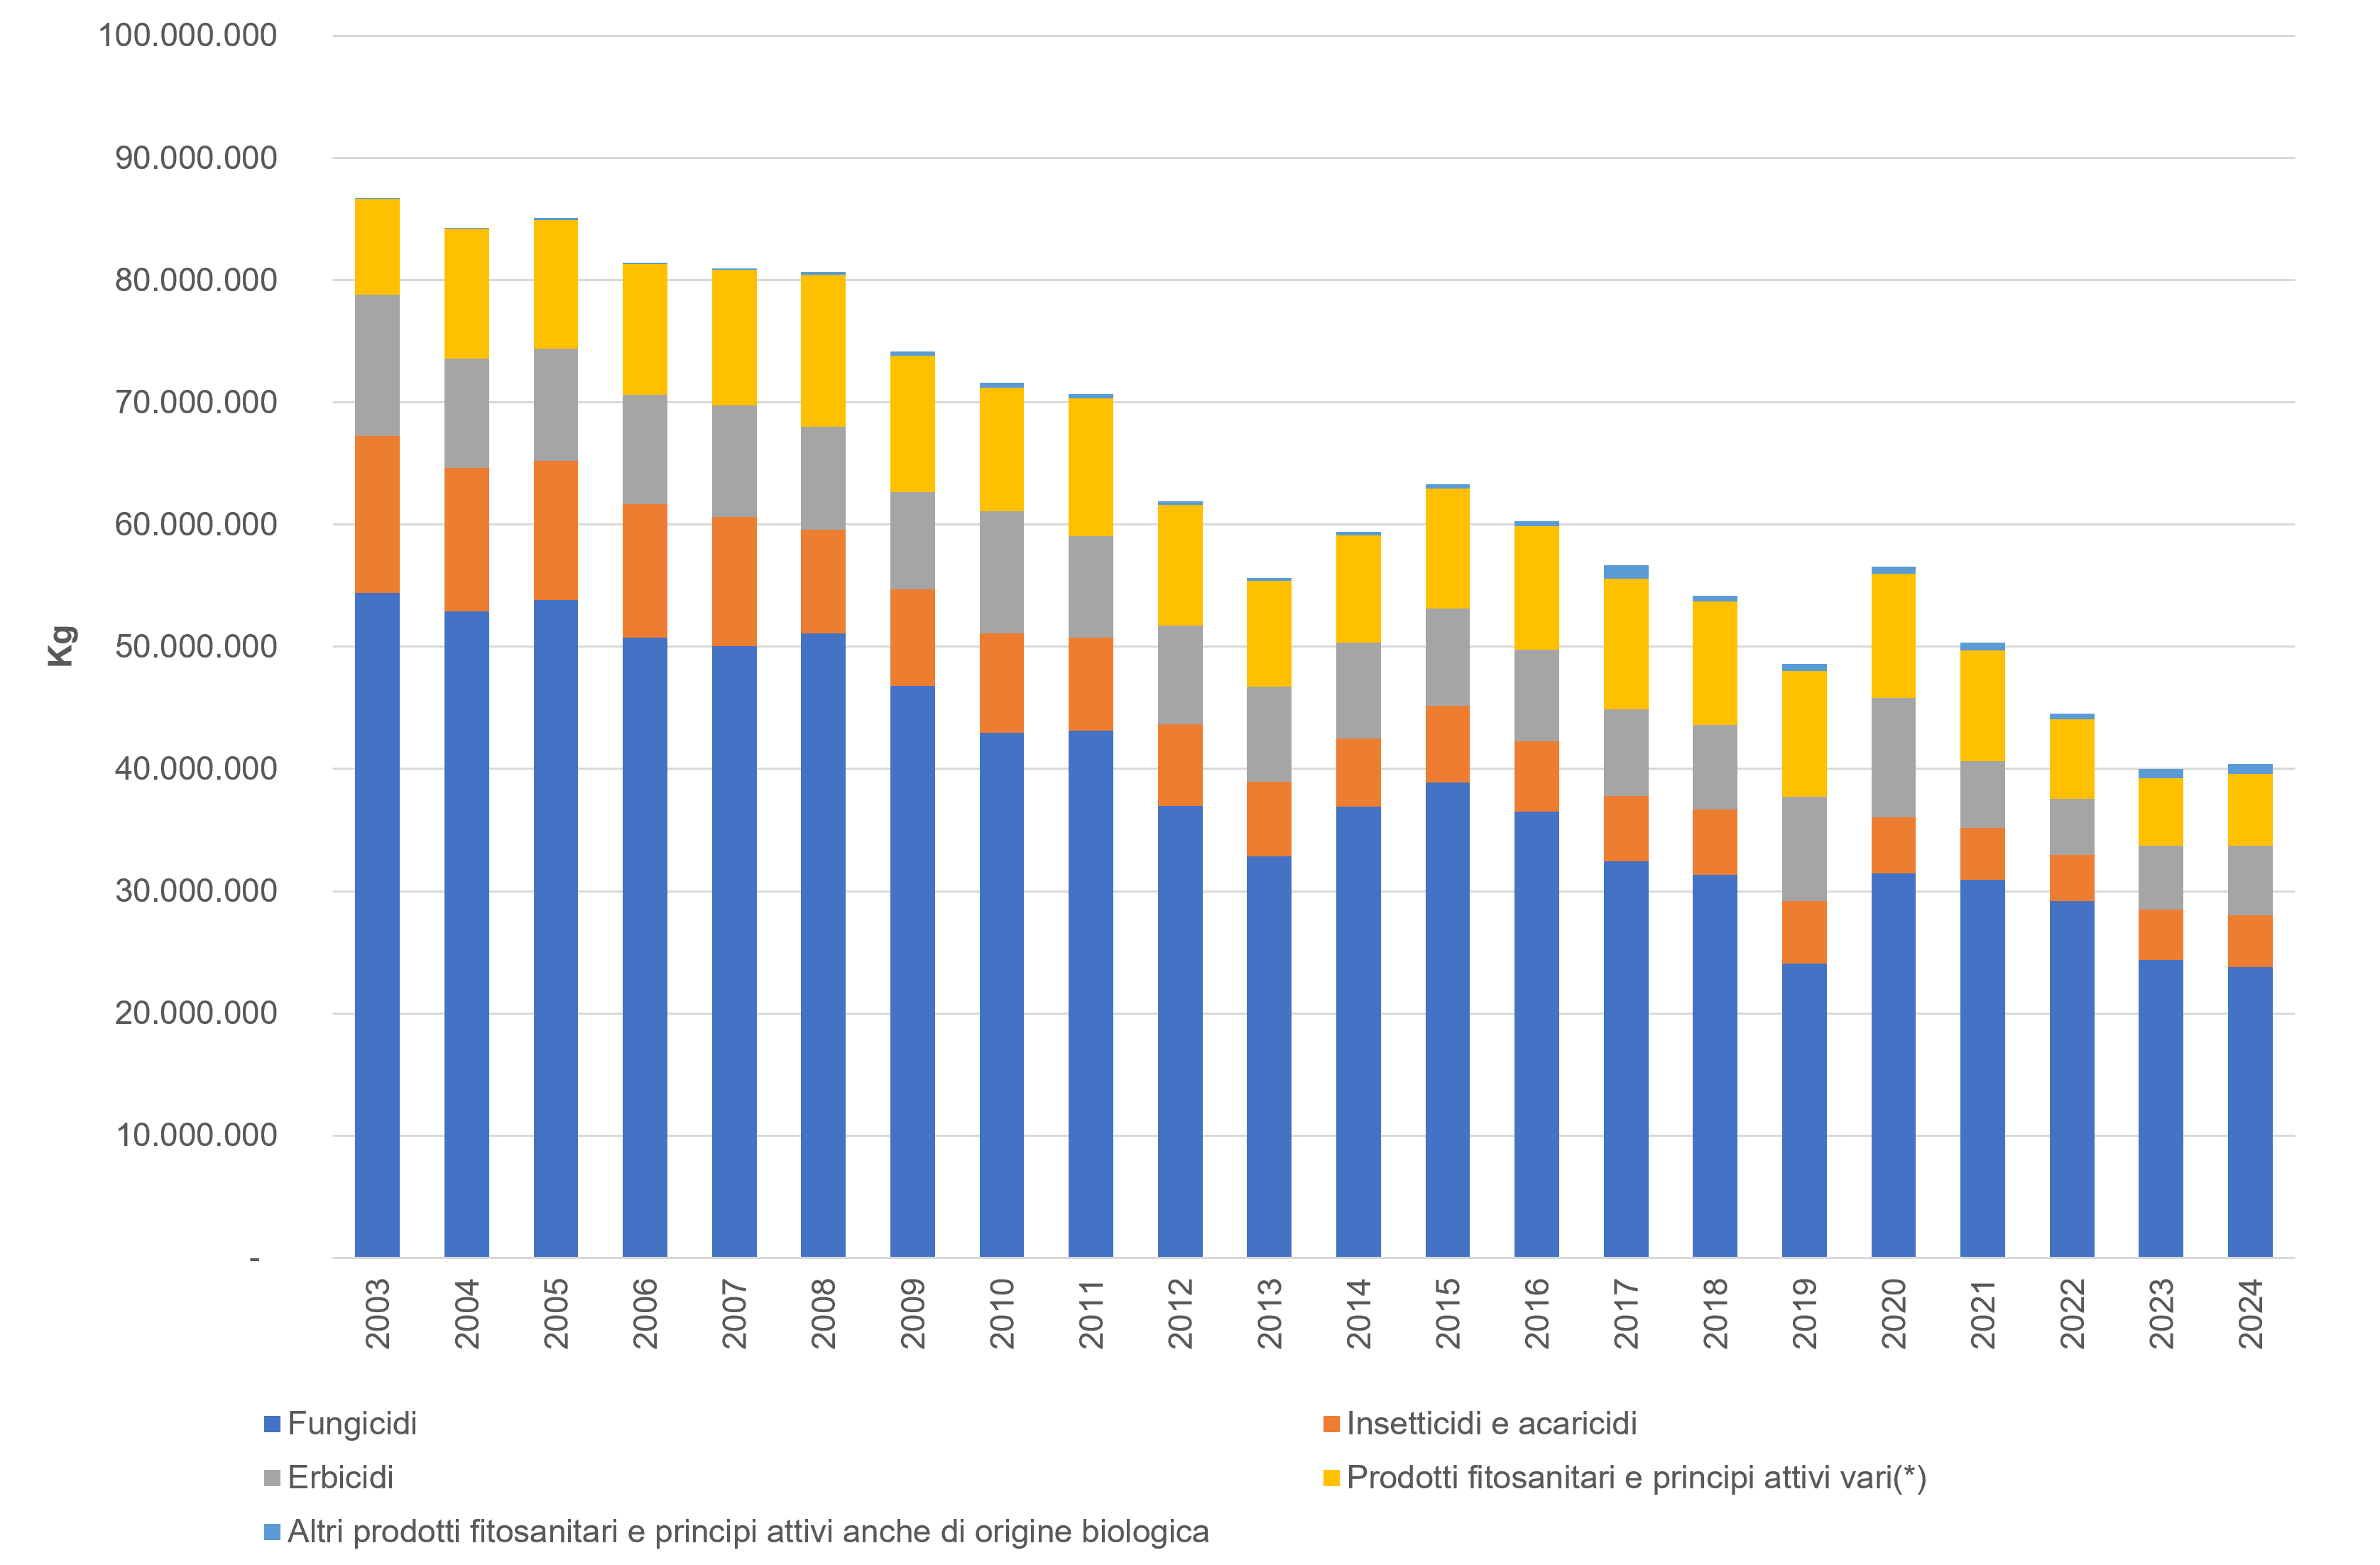
The total amount of active substances was approximately 40.4 thousand tonnes. Fungicides accounted for 58.9% of the total quantity of active substances, followed by other plant protection products (14.6%), herbicides (14.1%), insecticides and acaricides (10.6%), and biological plant protection products (1.9%) (Table 2 and Figure 2).
In 2024, approximately 93.6 thousand tonnes of plant protection product formulations were placed on the market, representing a 28.0% decrease compared with 2014, when the National Action Plan (NAP) for the sustainable use of plant protection products became operational (Table 1).
The quantity of active substances amounted to approximately 40.4 thousand tonnes, corresponding to an overall decrease of 32.1% compared with 2014, equivalent to a reduction of 19,045 tonnes (Table 2).
Over the longer period 2003–2024, the market for plant protection products contracted by 40.8%, with decreases recorded across all product categories.
During the same period, the total quantity of active substances declined by 46.3 thousand tonnes (-53.4%). Trends varied among product categories and were, in some cases, irregular. The quantities of active substances decreased for all categories except biological plant protection products, which continued to increase.
These trends are influenced by technical and agronomic factors, including climatic conditions, although commercial strategies adopted by manufacturers may also have played a role.
| Allegati |
|---|
Headline
Table 1: Quantity of plant protection products distributed, by product categories (2003 - 2024) Data source
Istat, Survey of plant protection products distributed for agricultural use Data legend
The category "Other" includes biological plant protection products.. Note
Since 2010, organic products have been reclassified |
Headline
Table 2: Quantity of active substances contained in plant protection products, by category and year (2003 - 2024) Data source
Istat, Survey of plant protection products distributed for agricultural use
Data legend
The category "Other" includes biological plant protection products. |
Headline
Table 3: Quantity of plant protection products distributed for agricultural use, by region and year (2023 - 2024) Data source
Istat, Survey of plant protection products distributed for agricultural use |
Headline
Table 4: Quantity of active substances contained in plant protection products distributed, by category and region (2023-2024) Data source
Istat, Survey of plant protection products distributed for agricultural use |
File
Headline
Table 5: Quantity of active substances contained in plant protection products per hectare of treatable surface (2024) Data source
Istat, Survey of plant protection products distributed for agricultural use
|
Headline
Table 6: Active substances contained in plant protection products distributed nationally per hectare of treatable surface (2003-2024) Data source
Istat, Survey of plant protection products distributed for agricultural use Data legend
Biologicals are included in the Various |
Thumbnail
Headline
Figure 1: Quantity of plant protection products distributed by product categories Data source
Istat, Survey of plant protection products distributed for agricultural use |
Thumbnail
Headline
Figure 2: Quantity of active substances contained in plant protection products, by category and year Data source
Istat, Survey of plant protection products distributed for agricultural use
|
In 2024, commercial formulations contained, on average, 43.1% active substances.
Compared with the previous year, the overall quantity of plant protection products placed on the market increased slightly by 0.8%, from 92.8 million kilograms in 2023 to 93.6 million kilograms in 2024 (Table 1). The quantity of fungicides increased by 13.1%, whereas insecticides and acaricides decreased by 10.7% and herbicides by 11.1%. The category of other plant protection products recorded a slight increase of 2.2%.
In 2024, the northern regions of Italy recorded a 9.6% increase in the quantity of plant protection products distributed compared with 2023, whereas the Centre (-11.2%) and the South and Islands (-8.7%) experienced declines (Table 3). With approximately 17,773 tonnes distributed, Veneto recorded an increase of 4,853 tonnes (+37.7%) compared with the previous year, making it the region with the highest distribution of plant protection products nationwide, followed by Emilia-Romagna with 16,773 tonnes. Together with Puglia, these three regions accounted for 48% of the national total. Fungicides represented by far the largest product category and were distributed mainly in northern Italy, which accounted for 62.1% of the national total. The highest quantities were recorded in Veneto (11,546 tonnes) and Emilia-Romagna (7,512 tonnes), both of which showed a marked increase in fungicide distribution compared with 2023.
In 2024, the quantity of active substances distributed per unit of agricultural area (Table 6) remained below 2003 levels for all product categories at the national level.