Carmela Cascone, Elisa Quaranta (PhD student, Alma Mater Studiorum University of Bologna)
The indicator analyses the capacity of national agriculture to stimulate economic growth while simultaneously reducing environmental pressures and impacts. The purpose of the indicator is to measure the eco-efficiency of the agricultural sector, defined as the ability to decouple economic growth factors from increasing pressure and impact factors. The evolution of the variables demonstrates a positive trend in the eco-efficiency of Italian agriculture over the analysis period (2000–2023). This is evident when comparing the trend of the economic variable (represented by the value added at basic prices) with that of the environmental pressures, which are all lower than the values recorded in the reference year (2000).
The indicator analyses the capacity of the national agricultural sector to stimulate economic growth while simultaneously reducing environmental pressures and impacts,. It is developed in line with both the European Commission’s Strategy on the Sustainable Use of Natural Resources (EC, 2005) and the objectives of the European Green Deal (EC, 2019), the 2030 Agenda for Sustainable Development (UN, 2015), and the Kunming-Montreal Global Biodiversity Framework (UN, 2022).
The Strategy calls for the development of aggregated indicators to evaluate the effectiveness of national policies in decoupling GDP growth (as a proxy for overall economic activity) from environmental degradation and resource depletion within a European framework. This is particularly relevant for the agriculture and fisheries sectors, where policymaking falls under the exclusive competence of the European Commission.
The indicator is expressed as a composite index that compares the value added at basic prices with resource use variables such as Utilised Agricultural Area (UAA), irrigated agricultural land, permanent grasslands and pastures, and energy consumption. At the same time, it accounts for environmental pressures such as air emissions, the use of plant protection products and fertilizers, and impacts on biodiversity.
Measuring the eco-efficiency of the agricultural sector—namely, its capacity to decouple economic growth drivers from increasing environmental pressures and impacts—is in line with the requirements of Communication COM(2005) 670 and is among the objectives of the 2023–2027 Common Agricultural Policy (CAP), the European Green Deal, the 2030 Agenda for Sustainable Development, and the Kunming-Montreal Global Biodiversity Framework (K-M GBF).
This indicator specifically assesses the ability of the national agricultural sector to foster economic growth, represented by the value added at basic prices, while simultaneously reducing pressures such as air emissions and the use of plant protection products and fertilizers. Such an approach is developed in accordance with the European Commission’s Strategy on the Sustainable Use of Natural Resources (EC, 2005) and supports the evaluation of national policies in separating GDP growth from environmental degradation.
Deliberation CIPE No. 57 of 2 August 2002;
Deliberation CIPE No. 108 of 22 December 2017;
Deliberation CITE No. 1 of 18 September 2023;
COM(2020) 381 final;
COM(2020) 380 final;
COM(2020) 98;
COM(2019) 640;
COM(2005) 670;
Decision No. 1386/2013/EU of the European Parliament and of the Council of 20 November 2013;
Decision No. 2022/591/EU of the European Parliament and of the Council of 6 April 2022;
Regulation (EU) 2020/2220 of the European Parliament and of the Council of 23 December 2020.
The sustainable use of natural resources, during both the production and consumption phases, is a fundamental factor for long-term prosperity at national, continental, and global levels. In 2015, the United Nations adopted the Sustainable Development Goals (SDGs) set out in the document “Transforming our world: the 2030 Agenda for Sustainable Development”. These goals, which are valid for the 2015–2030 period, replace and expand upon the Millennium Development Goals (MDGs) that expired at the end of 2015.
Among these objectives is the sustainable and efficient use of resources: Goal 15 aims to "protect, restore and promote sustainable use of terrestrial ecosystems, sustainably manage forests, combat desertification, halt and reverse land degradation and halt biodiversity loss". Goal 2 seeks to end hunger, achieve food security and improved nutrition, and promote sustainable agriculture. Goal 6 is to ensure the availability and sustainable management of water and sanitation for all, while Goal 12 ensures sustainable consumption and production patterns.
In 2022, the 15th Conference of the Parties (COP 15) to the United Nations Convention on Biological Diversity (CBD) adopted the Kunming-Montreal Global Biodiversity Framework (K-M GBF). This framework sets an ambitious path to achieve the 2050 Vision of “living in harmony with nature”. Key elements of the Framework include four long-term goals for 2050 and 23 action-oriented targets for 2030 aimed at halting and reversing biodiversity loss. This historic agreement supports the achievement of the SDGs and represents the first comprehensive global effort to ensure the stability of ecosystem services essential for human security, economic development, nature conservation, and climate change mitigation.
At the European Union level, the European Green Deal [COM(2019) 640] represents a new growth strategy that aims to transform the EU into a fair and prosperous society with a modern, resource-efficient, and competitive economy. It envisions a future where net greenhouse gas emissions are reduced to zero and economic growth is decoupled from resource use. The new Circular Economy Action Plan [COM(2020) 98], “For a cleaner and more competitive Europe,” significantly contributes to achieving climate neutrality by 2050 and decoupling economic growth from the use of natural resources, while ensuring long-term EU competitiveness and leaving no one behind.
The 8th Environment Action Programme (8EAP) to 2030 [Decision (EU) 2022/591] aims to accelerate the transition to a climate-neutral, resource-efficient, and regenerative economy that gives back to the planet more than it takes. To monitor progress, a new framework has been proposed to assess how well we are living within planetary boundaries. Furthermore, the “Farm to Fork” [COM(2020) 381] and “Biodiversity for 2030” [COM(2020) 380] strategies establish specific targets for the agricultural sector by 2030, such as dedicating at least 25% of EU agricultural land to organic farming and achieving a 50% reduction in the overall use and risk of chemical pesticides.
These instruments reinforce policy pathways designed to enable economic growth decoupled from environmental pressures and impacts resulting from natural resource use, as previously outlined in the 7th Environment Action Programme, the Circular Economy Package and its Action Plan [COM(2015) 614], the Roadmap to a Resource Efficient Europe [COM(2011) 571], and the updated EU Bioeconomy Strategy [COM(2018) 673].
In Italy, Law No. 221 of 28 December 2015, “Provisions on environmental matters to promote green economy measures and contain excessive use of natural resources,” introduced various measures relating to nature protection, sustainable development, environmental assessments, energy, green public procurement, waste management, soil conservation, and water resources. Additionally, the National Strategy for Sustainable Development (SNSvS), approved by CIPE Deliberation No. 108/2017 and updated in 2022 (CITE Deliberation No. 1/2023), represents the first step in translating the principles and goals of the 2030 Agenda into national policies
ISPRA, 2025[a]. Italian Greenhouse Gas Inventory 1990-2023. National Inventory Document 2025. Annual Report for submission under the UN Framework Convention on Climate Change and the Paris Agreement. Relationship ISPRA 411/2025 Available: https://www. isprambiente. gov. it/files2025/pubblicazioni/rapporti/nid2025_italy_stampa. pdf
ISPRA, 2025[b]. Italian Emission Inventory1990 – 2023 Informative Inventory Report 2025. Annual Report for submission under the UNECE Convention on Long-range Transboundary Air Pollution and European Union National Emission Ceiling Directive . ISPRA Report 410/2025. Rome, Italy. Available: https://www. isprambiente. gov. it/resolveuid/49eac1a1425e45d58c7bfd3f65178353
ISPRA, 2011. Agriculture. National emissions into the atmosphere from 1990 to 2009. Ispra Report 140/2011. Rome, Italy. Available: http://www. isprambiente. gov. it/it/pubblicazioni/rapporti/agricoltura-emissioni-nazionali-in-associazione-dal
ISTAT, 2025. Territorial economic accounts and aggregates 1995-2023 [Added value in millions of euros - added value by branch of activity - at basic prices - chained values with reference year 2020 - raw data - updated March 2025]. Available: https://esploradati. istat. it/databrowser/#/it/dw/categories/IT1, DATAWAREHOUSE,1.0/UP_ACC_ANNUAL/IT1,92_1225_DF_DCCN_ANA1_1,1.0
ISTAT, 2024 Agricultural Census 2020 – update Available: https://esploradati. istat. it/databrowser/#/it/censimentoagricoltura ISTAT, 2025. Means of Production [Fertilizers and Plant Protection Products - update 2023]. Available: https://esploradati. istat. it/databrowser/#/it/dw/categories/IT1, Z1000AGR,1.0/AGR_MEANS
ISTAT, 2022. 7th General Agricultural Census. Agricultural year 2019-2020
ISTAT, 2021. Structure of agricultural companies [Companies and surfaces for cultivation - update 2016]. Available: http://dati. istat. it/Index. aspx? QueryId=31590#
ISTAT, 2019. Structure and characteristics of the economic units of the agricultural sector. Year 2017
ISTAT, 2017. Survey on the structure and production of agricultural companies. Year 2016
ISTAT, 2011. 6th General Agricultural Census
Ministry of the Environment and Energy Security - MASE, 2024. The national energy situation in 2023. Energy Department - General Directorate of Energy Sources and Qualifying Certificates - Available: https://sisen. mase. gov. it/dgsaie/api/v1/cmis/documents/0900fde8800c6708
United Nations , 2022. Kunming-Montreal Global Biodiversity Framework (CBD/COP/DEC/15/4) United Nations , 2015. The Millennium Development Goals Report 2015
United Nations , 2015. Transforming our world: the 2030 Agenda for Sustainable Development . A/RES/70/1
For further development of the indicator, it would be appropriate to integrate quantitative information on the evolution of the agricultural surface with qualitative information, to evaluate, for example, the extent of the agricultural surface transformed into forms of use with a lower degree of naturalness (infrastructure, construction, etc.) and the degree of fragmentation of the agricultural landscape.
ISPRA (Higher Institute for Environmental Protection and Research) ISTAT (National Institute of Statistics) MiTE (Ministry of Ecological Transition). MSE (Ministry of Economic Development)
ISPRA, Inventory of atmospheric emissions (http://www. sinanet. isprambiente. it/it/sia-ispra/serie-storiche-emissioni)
ISTAT, Survey on the structure and production of agricultural companies (SPA) (http://dati. istat. it/)
ISTAT, Annual national economic accounts and aggregates (http://dati. istat. it/)
ISTAT, 7th General Agricultural Census. Agricultural year 2019-2020 (https://www. istat. it/it/archivio/273753)
ISTAT, Agricultural Census 2020 - update ( https://esploradati. istat. it/databrowser/#/it/censimentoagricoltura)
Ministry of the Environment and Energy Security - MASE, 2023. The national energy situation in 2022 (https://www. mase. gov. it/sites/default/files/Archivio_Energia/LA%20RELAZIONE%20SULLA%20SITUAZIONE%20ENERGETICA%20NAZIONALE%20NEL%202022_MASE%20Luglio%202023. pdf)
MiSE, National Energy Balance (https://dgsaie. mise. gov. it/ben. php)
MiTE, National Energy Situation (https://dgsaie. mise. gov. it/situazione-energetica-nazionale)
National Rural Network & Lipu (2024). Farmland Bird Index national and population trends of the species in Italy in the period 2000-2023
SINAB, “Bio in Figures 2023” data ( https://www. sinab. it/content/bio-statistiche)
National
2000-2023
The indicator compares the value added at basic prices—that is, the difference between the value of goods and services produced by the agricultural sector and the value of intermediate goods and services consumed during the reference period—with the use of resources, represented by the Utilised Agricultural Area (UAA), irrigated agricultural area, permanent grasslands and pastures, and energy consumption. It also considers environmental pressures such as air emissions, the use of plant protection products and fertilizers, and the impacts on biodiversity. The trend of these variables over the 2000–2023 period is assessed using an indexed approach, with the year 2000 as the baseline (index value = 100)
"The status of the indicator is not defined, as it is an index number that aggregates multiple components aimed at describing the efficiency of the agricultural sector. It is therefore intended to highlight trends over time, particularly the decoupling of environmental pressures from economic growth, as well as the impacts on biodiversity"
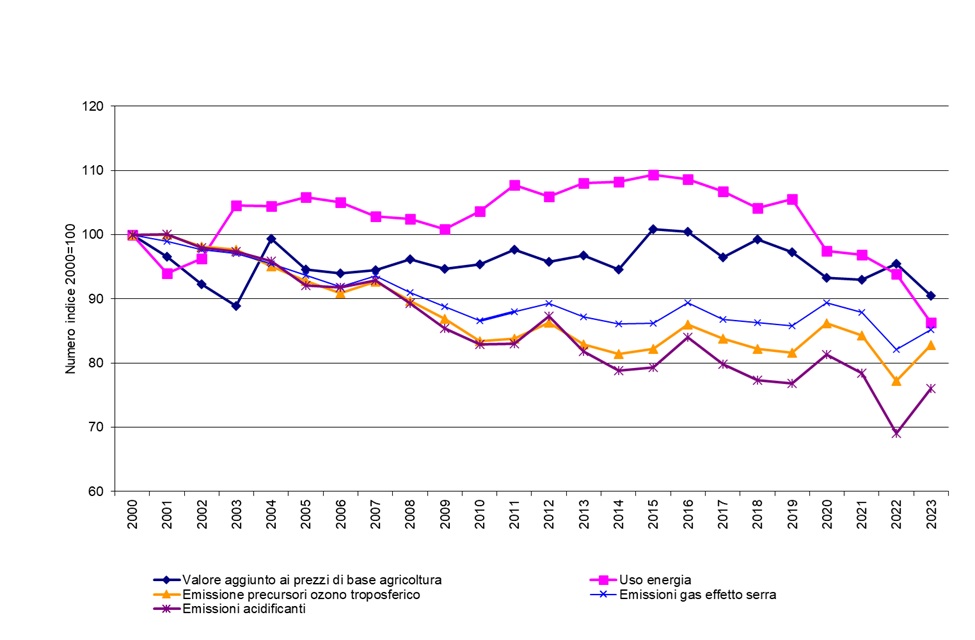
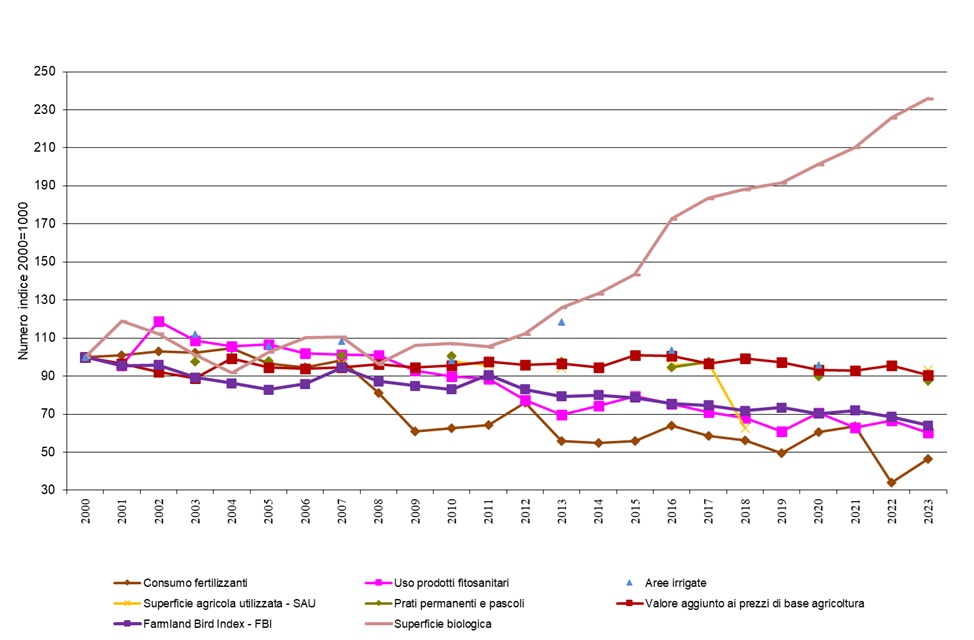
The evolution of the variables demonstrates a generally positive trend in the eco-efficiency of Italian agriculture over the 2000–2023 period. Nevertheless, a clear decoupling trend is not evident, as there is also a slight decrease in the economic variable, represented by the gross value added at basic prices (Figures 1 and 2). The environmental pressures appear to have all decreased compared to the reference year (2000)
| Data |
|---|
Thumbnail
Headline
Figure 1: Eco-efficiency in agriculture, expressed as a composite index of value added at basic prices in agriculture, energy use, and pollutant emissions Data source
ISPRA processing of ISPRA, ISTAT, and MASE data |
Thumbnail
Headline
Figure 2: Eco-efficiency in agriculture, expressed as a composite index of value added at basic prices in agriculture, natural resource use, consumption of technical inputs, and impact on biodiversity Data source
ISPRA processing of ISTAT, Rural Network & LIPU, and SINAB data |
Greenhouse gas emissions from the agricultural sector recorded a slight increase (index number of 85) compared to 2022 (index number of 82), although the general trend remains downward, with a reduction of 15 percentage points compared to the 2000 baseline. Regarding acidifying emissions—which include ammonia, nitrogen oxides, carbon monoxide, non-methane volatile organic compounds (NMVOCs), and sulfur oxides—the agricultural sector's contribution is primarily driven by ammonia. This category also saw a growth of 8 percentage points compared to the previous year; however, the overall reduction reached -24 percentage points (index number of 76) in 2023.
NMVOCs and nitrogen oxides are considered precursors of tropospheric ozone. The agricultural sector's contribution to the total national production of these gases is very limited; the trend shows a significant decrease starting from 2009, despite a slight increase of 5 percentage points in 2023 (index number of 83) compared to 2022 (index number of 78, the minimum value of the series). Energy consumption, which had remained above the reference value until 2019, reached its minimum level in 2022, at 6 percentage points below the 2000 baseline.
Fertilizer consumption, which has remained constant below the reference value since 2005, recorded an increase (index number of 52) in 2023 compared to the minimum value (index number of 34) in 2022, although the overall trend is one of decrease (-48 percentage points compared to 2000). The quantity of active substances contained in plant protection products (PPPs) distributed has remained below 2000 reference levels since 2009 (41 percentage points lower in 2023).
This coincides with a decrease in the Utilised Agricultural Area (UAA) in 2023 compared to 2000 (-7 percentage points), totaling 12.286 million hectares according to the latest survey. Within the UAA, the irrigated component—after reaching its minimum value in 2010 (2 points below 2000), a sharp increase in 2013 (20 points above 2010), and a significant reduction in 2016 (14 points below 2013)—increased by one point in 2020, indicating a greater use of water resources in agriculture.
The component represented by permanent grasslands and pastures reached its minimum value of 2.986 million hectares in 2023. The area under organic farming, despite a fluctuating trend until 2008, has recorded continuous growth, more than doubling since 2020; this represents an increase of 236 percentage points in 2023 compared to the 2000 baseline. Specifically, in 2023, the Italian organic surface area grew by 4.5% over the previous year—an increase of over 106,000 hectares—reaching a total of 2,456,019 hectares as of 31 December 2023.
In light of the European Commission's objectives defined in the "Farm to Fork" and "Biodiversity for 2030" strategies—which aim for at least 25% of EU agricultural land to be dedicated to organic farming by 2030—Italy is a significant contributor. In 2023, the country reached 20% of organic agricultural area relative to the total Utilised Agricultural Area (UAA). Conversely, the national Farmland Bird Index (FBI) values for the 2000–2023 period show a progressive reduction in bird species typical of agricultural habitats. By 2023, the index (with a 2000 baseline) dropped to 63, representing a worrying net loss of 37 percentage points compared to the reference year.
Overall, these trends highlight typical aspects of an agriculture that is gradually reducing its highly intensive character, though this transition is not uniform across time or the national territory. The long-term increase in eco-efficiency is clearly linked to European and national legislative and economic measures, particularly those promoting organic agriculture and biodiversity protection. Unfortunately, the improvements in agronomic practices seen over the last decade have not yet guaranteed an environmental quality level sufficient to maintain all elements of agricultural biodiversity in good condition. While recent years require further evaluation, the trend of the economic component (gross value added at basic prices), coupled with the simultaneous decrease in almost all environmental pressures, demonstrates a favorable overall trajectory.