Federico SILVESTRI
The indicator estimates the scale of the agricultural sector and its potential environmental impact through the number of agricultural and livestock holdings and the Utilised Agricultural Area (UAA). A comparison of data from the last two Agricultural Censuses (2010 and 2020) reveals a nationwide reduction of 488,000 holdings (-30.1%) and a decline of 424,000 hectares in Utilised Agricultural Area (-3.3%). Moreover, analysis of the change in the average size of holdings shows that the UAA per holding increased from 8 to 11 hectares, highlighting a significant trend toward the concentration of agricultural enterprises.
The indicator estimates the size of the agricultural sector and its potential impact on various environmental components through the number of agricultural and livestock holdings and the Utilised Agricultural Area (UAA). The UAA consists of arable land (mainly cereals, temporary fodder crops, industrial and horticultural crops, including fallow land), permanent crops (such as olive groves, vineyards, fruit trees, citrus trees, including chestnut orchards), and permanent grassland and pasture. The data used to compile the indicator originates from ISTAT.
To indicate the number of holdings engaged in agricultural and livestock production and to estimate the territorial area utilised. Of this total area, the portion allocated to agricultural use is assessed, with its temporal evolution analysed at both national and regional levels. The indicator provides a comprehensive overview of agriculture across the territory.
The Seventh General Agricultural Census (GAC) is governed, at the European level, by Regulation (EU) 2018/1091 of the European Parliament and the Council of 18 July 2018 on integrated farm statistics (which repeals Regulations (EC) No 1166/2008 and (EU) No 1337/2011). This regulation mandates its implementation by all Member States and defines the modalities of its conduct, emphasizing its compulsory nature. Additionally, it is supported by Implementing Regulation (EU) 2018/1874 of the Commission, dated 29 November 2018, concerning the data to be reported for the year 2020, pursuant to Regulation (EU) 2018/1091. This includes the list of variables and their definitions.
https://7censimentoagricoltura.it/ Statistica Report 7° Censimento generale dell’agricoltura – primi risultati (2022), ISTAT
https://esploradati.istat.it/databrowser/#/it/censimentoagricoltura
The indicator does not provide information on the transformation dynamics of agricultural areas. It is therefore not possible to interpret their evolution or the alternative land use options (such as industrial activities, urbanised zones, etc.), nor to analyse the resulting environmental impact.
The Seventh Agricultural Census is the last decennial General Agricultural Census. Going forward, the agricultural census will become a continuous operation and will integrate available administrative data with specific survey-based collections involving only agricultural holdings selected through a representative sample. The use of administrative sources will reduce costs and statistical burden on respondents, while at the same time improving the quality and consistency of the data produced.
ISTAT
ISTAT, VI e VII Censimento Agricoltura (https://www.istat.it/it/archivio/273753)
https://www.istat.it/it/archivio/294595
- National level;
- Regional level
2010, 2020
Census Survey
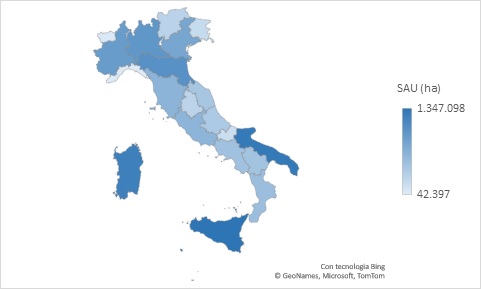
As of 2020, the number of Italian agricultural and livestock holdings amounted to 1,133,006, covering 12,431,808 hectares of Utilised Agricultural Area (UAA), with an average size of 11 hectares of UAA per holding. The majority of agricultural production units is concentrated in the Southern regions and Islands: Apulia, Sicily and Calabria are the top three regions, hosting over 436,000 holdings (38.5% of the national total), although their average size in terms of UAA is below the national average.
A comparison of data from the last two Agricultural Censuses (2010 and 2020) shows a nationwide decrease of 30.1% in the number of agricultural holdings and a 3.3% reduction in the Utilised Agricultural Area (UAA). Furthermore, analysis of changes in the average farm size indicates that the UAA per holding increased from 8 to 11 hectares. Overall, the data reflect an evolutionary trend marked by the inevitable and gradual market exit of holdings no longer able to sustain their operations, primarily small-scale and family-run enterprises.
| Allegati |
|---|
Thumbnail
Headline
Figure 1: Utilised Agricultural Area (UAA) by Region (2020) Data source
ISTAT |
Headline
Table 1: Utilised Agricultural Area (UAA) and Total Number of Agricultural Holdings Data source
ISPRA processing of ISTAT data
|
Headline
Table 2: Agricultural Holdings with Utilised Agricultural Area (UAA) by Type of Cropping (2020) Data source
ISTAT Data legend
*: The total area of arable crops does not include greenhouse kitchen gardens (275 hectares)
|
In 2020, the Southern Regions and Islands held the largest number of agricultural holdings (662,157) and the widest extent of Utilised Agricultural Area (UAA), totalling 5,993,594 hectares (Table 1 and Figure 1). More than half of the UAA continued to be cultivated with arable crops (57.8%), followed by permanent grassland and pasture (24.7%), permanent crops (17.4%) and kitchen gardens (0.1%) (Table 2).