Data aggiornamento scheda:
Il numero di invasi classificati come Grandi Dighe, ai sensi della Legge 21 ottobre 1994 n. 584 e successiva Circ. Ministero LL.PP. 482/1995, risulta pari a 522 (dicembre 2024) mentre, sulla base dei censimenti forniti dalle regioni e/o reperiti in rete fino a settembre 2025, il numero degli specchi d'acqua (invasi artificiali, vasche, laghi naturali, stagni, paludi etc) è pari a 41.918. Per le Grandi Dighe l’informazione è completa a livello nazionale. Per i piccoli invasi di competenza regionale, il censimento o la stima è disponibile per tutte le regioni, ma in alcuni casi risulta parziale e incompleto, e si stima che almeno il 35% di questi sia dotato di opere di sbarramento.
Data aggiornamento scheda:
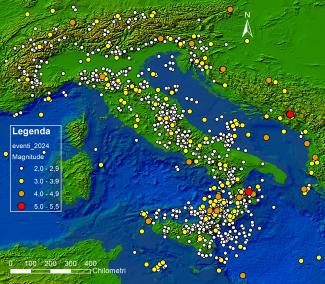
L'indicatore descrive gli eventi sismici avvenuti nell’anno di riferimento nel territorio italiano, in base alle Magnitudo registrate dalla Rete Sismica Nazionale dell’INGV. Nel 2024 nessun evento sismico è stato distruttivo in Italia. Solo un evento ha raggiunto Magnitudo 5, in provincia di Cosenza che, comunque, non ha procurato effetti di rilievo in superficie. Inoltre, si sono verificati 13 eventi di Magnitudo compresa tra 4 e 4,6 con epicentro sul territorio italiano e oltre confine fino a una distanza di 100 chilometri. Il numero di terremoti di Magnitudo pari o superiore a 2 avvenuti nel 2024 (2.031) è comparabile col numero degli analoghi eventi avvenuti nei cinque anni precedenti, a parte una lieve flessione nel 2021. Essi si sono maggiormente concentrati, come sempre, lungo l’arco appenninico, l’arco alpino orientale e la Sicilia orientale.
Data aggiornamento scheda:

Al 31 dicembre 2024, nei comuni classificati come zone in cui la probabilità che capiti un forte terremoto è alta sono situati 16.729 beni, pari al 7,3% del totale.
Data aggiornamento scheda:

L’indicatore analizza la distribuzione delle grandi e piccole dighe rispetto alla classificazione sismica del territorio nazionale (Mappa delle zone sismiche OPCM 20 marzo 2003, n. 3274 e successive integrazioni), all'Indice di Franosità del Progetto IFFI (Inventario dei fenomeni franosi in Italia) e alla distribuzione delle aree in frana. Per l’anno 2024, l’indicatore evidenzia che le superfici di acqua dei laghi artificiali e naturali fortemente modificati (perimetro dell’acqua per grandi e piccole dighe) che ricadono in zone con Indice di Franosità (IF) nullo sono il 71,6%, mentre solo l'1,8% ricade nelle zone con IF più alto (IF>30). Rispetto alla sismicità, il 7,4% di grandi dighe e il 2,2% di piccole dighe ricadono nella zona a sismicità alta (zona sismica 1), mentre rispettivamente il 20,6% e l'11,9% nelle aree a sismicità bassa (zona sismica 4). Non essendoci ancora dati completi sulla distribuzione dei piccoli invasi a scala nazionale il risultato è ancora da considerarsi parziale.
Data aggiornamento scheda:

Questo indicatore è focalizzato sull'evoluzione della classificazione sismica e della normativa antisismica del territorio italiano, con particolare riferimento alla microzonazione sismica (MS). Per quanto riguarda la classificazione sismica, benché dal 2006 non sia più il riferimento normativo per la progettazione antisismica, per la quale si rimanda direttamente alle Norme Tecniche per le Costruzioni (DM del 17 Gennaio 2018), essa continua a essere il riferimento per i controlli tecnico-amministrativi. L’ultimo aggiornamento fornito dal Dipartimento della Protezione Civile, relativo ad aprile 2021, classifica il territorio in quattro classi principali e sedici sottoclassi, secondo quanto proposto da ciascuna regione per i propri comuni. Relativamente alla normativa che regola le indagini di microzonazione sismica, il Dipartimento di Protezione Civile di concerto con la Conferenza delle Regioni e Province Autonome ha definito nel 2008 gli indirizzi e criteri generali. Negli anni successivi alcune regioni hanno emanato specifiche norme tecniche che adattano gli indirizzi generali al proprio territorio in funzione delle precipue fragilità, in riferimento ai problemi di amplificazione sismica e, in alcuni casi, anche alla pericolosità da fagliazione superficiale. La sequenza sismica che ha colpito l’Italia Centrale dal 24 agosto 2016 ha dato impulso alla realizzazione degli studi di microzonazione sismica di III livello in tutti i 140 comuni da essa interessati, validati dal gruppo di lavoro istituito all’uopo dal Commissario Straordinario per la ricostruzione nel Centro Italia. Sono in corso vari studi di approfondimento sulle faglie attive e capaci nell'ambito delle MS di III livello che verranno portati a compimento entro la fine del 2021.
Data aggiornamento scheda:
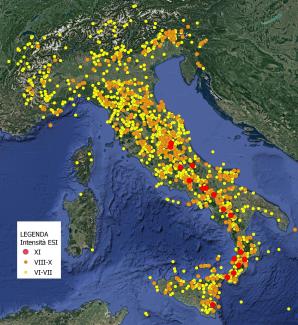
L’indicatore descrive gli effetti indotti sull'ambiente dai terremoti e rappresenta la suscettibilità del territorio italiano a tali effetti. La suscettibilità dipende dal diverso grado di sismicità presente nelle diverse porzioni del territorio italiano e dalle locali caratteristiche geomorfologiche e geologiche. Viene, inoltre, presentata una mappa dei valori ESI (Environmental Seismic Intensity) che sono stati raggiunti durante la storia sismica conosciuta nel territorio italiano e rappresentativi degli effetti che potrebbero riverificarsi in futuro a seguito di terremoti analoghi.
Nel 2022 si è registrato un solo terremoto per cui sono stati riportati effetti ambientali sismo-indotti. Si tratta del sisma avvenuto il 4 dicembre 2022 nelle isole Eolie, di magnitudo 4,5, che ha indotto modesti fenomeni di crollo in alcuni siti di Lipari e Vulcano.
Data aggiornamento scheda:

L'indicatore fornisce informazioni su eventi di fagliazione superficiale associati alla riattivazione di faglie capaci che interessano il territorio italiano, generalmente in occasione di forti terremoti, ma anche a seguito di terremoti di magnitudo relativamente bassa, se questi sono superficiali, come avviene in contesti vulcano-tettonici, quale ad esempio quello dell’Etna. Proprio nell’area etnea, a seguito del terremoto di Fleri del 26 dicembre nel 2018 (Mw 4.9, H=1 km; INGV), si è riattivato, come altre volte nel recente passato, il sistema di faglie Fiandaca - Acicatena - Aciplatani.
Lungo la faglia di Fiandaca è stata documentata una fagliazione superficiale per una lunghezza di circa 5 km. La rottura lungo la faglia di Aciplatani non è stata invece cosismica, ma è comparsa alcune ore dopo l’evento sismico, con fratture aperte pochi cm che dopo alcuni giorni dall’evento hanno raggiunto una lunghezza totale di circa 700 metri. Questi movimenti asismici, cioè non legati a sismi, di dicono per creep, e sono comuni in alcuni settori dell’apparato etneo.
Il danneggiamento legato all’evento sismico è stato localizzato essenzialmente lungo le zone di fagliazione superficiale, che erano state interessate dallo stesso fenomeno più volte in passato, anche molto recentemente, a dimostrazione dell’importanza di evidenziare le aree ove sono presenti faglie capaci e di tenerne conto nella pianificazione territoriale.
Le faglie che si sono riattivate nel 2018 erano già contenute nel database ITHACA, l'inventario delle faglie capaci in Italia realizzato da ISPRA, che fornisce lo stato delle conoscenze sulla distribuzione nel territorio nazionale delle faglie potenzialmente in grado di produrre fagliazione in superficie.
Data aggiornamento scheda:

L’indicatore fornisce una stima del livello di esposizione delle aree urbane alla pericolosità da fagliazione superficiale. Per ciascuna zona sismogenetica della zonazione ZS9 l’indicatore misura l’estensione areale dell’urbanizzato esposto a pericolosità da fagliazione superficiale in quanto in prossimità di faglie capaci (Catalogo ITHACA). Queste ultime sono perimetrate tenendo conto della cinematica prevalente della faglia, con un’estensione che è funzione dei massimi rigetti attesi.
Le maggiori criticità si confermano in Sicilia orientale, soprattutto nell’area etnea. Dal confronto rispetto all’ultima elaborazione (nel 2014) emerge un incremento imputabile alla maggiore espansione delle aree urbane in prossimità di faglie capaci, ma anche alla presenza di un numero maggiore di faglie capaci in ITHACA dovuto al progressivo aumento delle conoscenze sull’attività tettonica recente di alcune strutture.