CITES CONTROLS
Data aggiornamento scheda:The number and outcomes of inspections carried out over the last 14 years (2010-2023) to verify compliance with the Washington Convention on International Trade in Endangered Species of Wild Fauna and Flora (CITES) are analyzed. The indicator shows a rise in offenses in recent years.
Over the last six years (2018-2023), the total number of offenses increased from an average of 299 (2012-2017) to 769. In 2023a total of 4,063 inspections were conducted, identifying 769 offenses, of which 483 were administrative violations and 286 were criminal offenses, leading to fines amounting to €1,471,412 for administrative infractions.
CONSERVATION STATUS OF SPECIES PROTECTED UNDER THE BIRDS DIRECTIVE (2009/147/EC)
Data aggiornamento scheda:This indicator provides a national overview of the conservation status of 268 breeding bird species assessed in the reporting under Article 12 of the Birds Directive 2009/147/EC. The assessment includes species of community interest listed in Annexes I and II of the Directive, as well as those that justify the designation of Special Protection Areas (SPAs).
At the national level, the percentage of species with a favourable conservation status increased from 51% (reporting period 2007-2012) to 56% (reporting period 2013-2018). However, this increase was insufficient to meet the target set by the EU Biodiversity Strategy 2020 (76%).
The short-term population trends, which reflect processes occurring in the last decade, indicate that 46% of species are increasing or stable, while nearly 25% of species are in decline (the population trend of the other 33% remains unknown). Regarding short-term trends in distribution range, the proportion of declining species is lower, as only the most severe declines result in range contractions: 21% of species show a contraction, while the remaining 79% have stable or expanding ranges.
FRAGMENTATION OF NATURAL AND AGRICULTURAL LAND
Data aggiornamento scheda:Territorial fragmentation is the process that leads to a progressive reduction in the area of natural and semi-natural environments and an increase in their isolation. This process, which transforms large land patches into smaller and more isolated parts, is primarily driven by urban expansion phenomena, which can take more or less sustainable forms, and the development of infrastructure networks aimed at improving connections between urbanized areas through linear works. In 2023, 42.34% of the national territory was classified as highly and very highly fragmented. The regions with the largest areas of very high fragmentation are Veneto (39.98%), Lombardia (33.57%), Emilia-Romagna (25.87%), and Campania (25.69%). This data confirms the strong correlation between fragmentation and urbanization density.
MOUNTAIN GREEN COVER INDEX
Data aggiornamento scheda: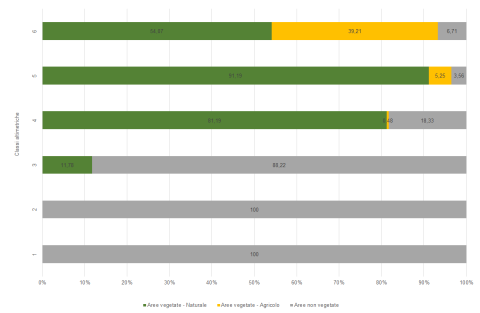
The index evaluates the percentage of vegetation cover in mountain areas, defined according to the six altitude classes with elevations above 300 m above sea level proposed by FAO in 2015 (UNEP-WCMC). The data is expressed in terms of total mountain vegetation area and with reference to the distinction between natural and agricultural areas.
The analysis reveals a significant presence of vegetated areas, especially in classes 5 and 6, which are between 300 and 1,500 m above sea level. The changes observed are mostly associated with a reduction in vegetated areas, while increases are recorded in higher altitude bands, with a maximum of just over 1,800 hectares in Veneto and slightly more than 1,000 hectares in Lombardia. Significant increases in mountain vegetation cover are also found in Marche and Tuscany, which, together with Lombardia and Veneto, are the only regions showing an overall increase in mountain green areas, net of reductions.
PRIMARY EXPENDITURE FOR ENVIRONMENTAL PROTECTION, USE, AND MANAGEMENT OF NATURAL RESOURCES WITH REFERENCE TO BIODIVERSITY
Data aggiornamento scheda:In 2022, Italy's primary environmental expenditure increased by 163% compared to 2021, reflecting a greater political interest in environmental issues. However, the share of key sectors (biodiversity and landscape protection, forest and wildlife management) in total environmental spending declined from 9.1% to 4.2%.
Despite the increase in available resources, spending capacity varies across sectors, with efficiency rates ranging from 88.5% for biodiversity to 69.1% for forest management. This trend highlights the need to optimize investments to ensure the protection of natural heritage, in alignment with the sustainable development goals of the 2030 Agenda.
RICHNESS AND RED LIST STATUS OF PLANT SPECIES
Data aggiornamento scheda:Italy hosts a remarkable floristic heritage, both in terms of species and subspecies richness (2,815 lichens, 1,209 bryophytes, and 8,241 native vascular entities) and biogeographical value. Of the 8,241 Italian vascular plant,1,702 species (equal to 20.65%) are endemic, meaning they exist exclusively in the country. Among these, 1,128 species are regionally endemic, with their range restricted to a single Italian region (data updated to April 2024).
The indicator also highlights the IUCN risk status of 2,430 vascular plant entities (representing 29.5% of Italy’s vascular flora), identifying the main threats affecting them. Unfortunately, the overall conservation status cannot be considered satisfactory: 2.2% (54 species) of the 2,430 evaluated entities are extinct or likely extinct; 24.3% (590 species) are at risk of extinction.
Human-induced pressures related to land-use changes represent a major driver of plant species extinction risk. The Red List of vascular flora identifies the most critical pressures affecting species: Modification of natural systems (39% of the 2,430 assessed taxa are subject to this pressure);
Agricultural development (27%); Residential development (27%); Direct human disturbance in natural environments (20%).
SPREAD OF ALIEN SPECIES
Data aggiornamento scheda:The indicator provides an overview of the current presence of alien animal and plant species in Italy through quantitative data, showing the temporal trends of introduction in Italy over the last century, the average annual introduction rate (average number of new alien species introduced each year), the pathways (according to CBD categories), and the distribution of invasive alien species of Union concern. The number of alien species in Italy is progressively and constantly increasing. Based on currently available data, nearly 3,800 exotic species have been introduced into our country, of which 3,659 are currently present in the territory. The average number of species introduced per year has increased exponentially over time, increasing from 6 species/year in the 1970s to 16 species/year in the last decade,reaching nearly 30 species/year in the current decade. The cumulative number of species introduced in Italy since 1900 also confirms this exponential trend, with an increase of over 500% in 120 years.