EMISSION INTENSITY TO AIR IN THE PAPER INDUSTRY
Data aggiornamento scheda:
In 2021, each million euros of value added of the Italian paper industry (€9.27 billion, 2015 prices) generated approximately 540 t of CO₂, 3.65 kg of SOx, 0.476 t of NOx, 52 g of NMVOCs, and 0.051 t of PM10. Compared with 2020, only SOx intensity decreases (–66%), while CO₂ (+0.6%), NOx, NMVOCs and PM10 (all +5.3%) increase. In the long-term comparison (1990–2021), two opposite dynamics emerge: SOx –99% (strong push towards the use of natural gas in the sector) and NMVOCs –97% (discontinuation of some production processes characterised by this type of emission), versus CO₂ +49%, NOx +40% and PM10 +32%, which reflect the increase in the sector’s energy needs.
ATMOSPHERIC EMISSION INTENSITY IN THE NON-METALLIC MINERAL PRODUCTS INDUSTRY
Data aggiornamento scheda:
In 2023, for every million euros of value added, the Italian non-metallic mineral products industry emitted 1,861.4 t of CO₂, 1.8 t of SOx, 2.6 t of NOx, 2.1 t of NMVOC, and 2.3 t of PM10. Compared with 1990, NOx emission intensity declined by 72%, while for the other pollutants—apart from a –63% reduction for SOx—the decrease was less pronounced: NMVOC –40%, CO₂ –42%, and PM10 –15%.
In the most recent year, the indicator improved for SOx (–2%), remained almost unchanged for NOx (+2%), and increased for the other pollutants: NMVOC +24%, PM10 +17%, and CO₂ +7%.
PRTR REGISTER: OFF-SITE TRANSFER OF WASTE
Data aggiornamento scheda:
The PRTR Register provides an annual overview of the quantities of waste transferred outside the boundaries of industrial installations subject to reporting obligations. The 2023 update shows that the industrial sector (excluding waste and wastewater management activities – Annex I to Regulation (EC) No 166/2006) transferred a total of 13 million tonnes (Mt) of special waste, of which 9.7 Mt were non-hazardous and 3.2 Mt hazardous. Compared with 2022, quantities show a slight decrease (–7.6% for non-hazardous waste and –14.3% for hazardous waste).
Material recovery remains the preferred destination, accounting in 2023 for 76% of non-hazardous waste and almost 54% of hazardous waste.
CO₂ EMISSION INTENSITY IN INDUSTRY RELATIVE TO VALUE ADDED
Data aggiornamento scheda:
The efficiency indicator, developed for the years 1995–2023, expresses carbon dioxide emissions per unit of value added in manufacturing and construction industry in Italy. The substantial reduction in emission intensity over time (–45.5% between 1995 and 2023) indicates an improvement in the efficiency level achieved by the Italian manufacturing and construction sectors.
INDUSTRIAL PRODUCTION INDEX
Data aggiornamento scheda:
The Industrial Production Index (IPI) describes, through the monthly survey of actual production volumes, the trend of Italian industrial activity (in the strict sense). The level of industrial production is a determinant related to environmental pressures. The dynamics of industrial production in Italy generally follow the trend of major European industrial countries and the euro area average (while remaining above it). In 2020, the series reached its historical minimum (89) due to COVID-19 pandemic control measures, which forced the closure or severe restriction of production activities. Industrial production recovered in 2021 (100), matching France but exceeding Germany, and aligning with the euro area average. After stagnation between 2021 and 2022 (100.3), the index decreased again in 2023 (98.3) and 2024 (94.4). Almost all of the variability in industrial production over time is explained by changes in manufacturing activity volumes.
INTENSITY OF ATMOSPHERIC EMISSIONS IN THE CHEMICAL INDUSTRY
Data aggiornamento scheda:
In 2023, for every million euros of value added, the Italian chemical industry emitted 3,179 tonnes of CO₂, compared with 0.58 t of SOx, 0.97 t of NOx, 0.44 t of NMVOCs, and 3.13 t of CO. Compared with 1990, SOx and NOx intensities have almost been eliminated (–97% and –92%), while CO₂ has fallen by only 22%, indicating that energy decarbonisation remains the main challenge. Over the last year, emissions intensities decreased for almost all pollutants (CO₂ –6%, SOx –24%, NOx –14%, NMVOCs –4%), confirming a trend of progressive decoupling between economic growth and environmental pressures. Calculated for 1990–2023 and updated annually with ISPRA and ISTAT data, the indicator provides an immediate reading of the evolution of atmospheric emissions relative to the economic activity of the whole chemical sector, consistent with what is reported each year to the European Commission under the EU greenhouse-gas monitoring mechanism and for implementation of the Kyoto Protocol.
EMISSION INTENSITY TO AIR IN THE METALLURGICAL INDUSTRY
Data aggiornamento scheda:
In 2022, for every million euros of value added, the Italian metallurgical industry, which includes the steel industry and the non-ferrous metals sector, emitted 1,124 t of CO₂, compared with 1.2 t of SOx, 1.8 t of NOx, 1.4 t of NMVOCs, and 19.2 t of CO. Compared with 1990, the emission intensity of SOx has almost been reduced to zero (89%), while those of CO decreased by (–68%), NOx (–61%), CO₂ (–50%), NMVOCs (–22%). The indicator’s pattern and trend are dominated by what occurs in the steel sector. In 2022, compared with the previous year, emission intensity improves, confirming a decrease for all pollutants (CO₂ –9%, SOx –22%, NOx –8%, NMVOCs –1%, CO –7.4%).
PRTR REGISTER: NUMBER OF PRTR FACILITIES AND ACTIVITIES
Data aggiornamento scheda:
The EPRTR (European Pollutant Release and Transfer Register) is the integrated register established by the EU through Regulation (EC) No 166/2006 to provide public access to information on the environmental impacts of industrial installations that exceed specific thresholds for pollutant emissions or transfers of pollutants and waste.
In 2023, the industrial sources most relevant for emissions to air, water, and soil numbered 4,105, of which 3,066 were located in Northern Italy, 542 in Central Italy, 491 in Southern Italy and the Islands, and 6 offshore.
RESEARCH AND DEVELOPMENT EXPENSES IN THE INDUSTRIAL SECTOR
Data aggiornamento scheda:
The 2022 update highlights the continued recovery of intramural Research and Development (R&D) expenditure by industrial enterprises, reaching €11.39 billion (+3.1% compared to 2021), surpassing for the first time the pre-pandemic peak of 2019. Almost all of this expenditure (98.9%) continues to be borne by the manufacturing sector, while the contribution of extractive activities, energy supply, and waste management services accounts for just 1.1%. Over the decade 2012–2022, total investment grew by more than a third (+36.6%), as shown in Table 1. When related to GDP, the share stood at approximately 1.31% in 2023 (1.37% in 2022), a level that keeps Italy below the euro area average and behind its main European industrial partners.
INDUSTRIAL ENTERPRISES
Data aggiornamento scheda:
The indicator measures the number of industrial enterprises in the strict sense, their local operational units, and the employed workforce, providing a snapshot of the national production structure and its evolution.
In 2022, the number of active enterprises in the industrial sector (in the strict sense) amounted to 390,580, a figure that remained essentially stable compared to 2021 (+0.02%). The territorial distribution remains polarized, with over half of the enterprises concentrated in the northern part of the country. In terms of employment, the number of workers totaled 4,137,637, marking a 1.5% increase compared to the previous year. Overall, the manufacturing sector remains the dominant component, accounting for over 90% of industrial employment.
ENVIRONMENTAL PROTECTION INVESTMENTS
Data aggiornamento scheda:
In 2022, gross fixed investments by industrial enterprises aimed at environmental protection suffered a dramatic collapse: the total value dropped from €1,454.3 million to €508.7 million, marking a contraction of approximately 65% compared to the peak reached just a year earlier. The downturn affected both “end-of-pipe” technologies (−71.5%) and integrated technologies (−47.6%) in a similar manner, so the share of integrated solutions in total investment remained essentially unchanged at just over 40%.
At the sectoral level, manufacturing remained the top investor with almost €300 million, although it reduced its outflows by more than half; electricity and gas lost most of the commitments made in 2021 (−87%), while water management settled at €125 million (−62%). Among CEPA categories, despite steep declines, “Wastewater Management” (€171.7 million) and “Air and Climate Protection” (€126.4 million) remained the most significant.
PRTR REGISTER: AIR EMISSIONS (FORMERLY INES REGISTER: AIR EMISSIONS)
Data aggiornamento scheda:
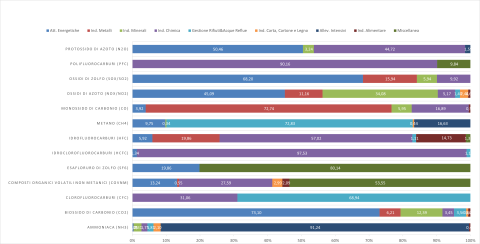
The EPRTR (European Pollutant Release and Transfer Register) is the integrated register developed by the EU under Regulation (EC) No 166/2006, with the aim of making publicly available information on environmental impacts from industrial facilities that meet the criteria established in the legislation. This indicator represents the total air emissions from industrial facilities that have reported such emissions to the national PRTR register. The air emissions declared for 2020 refer to 34 substances (non-zero values). Comparing 2020 data with 2007, it is observed that for 25 substances, total national atmospheric emissions have decreased (for 23 of these, reductions exceed 40%), while for 8 substances, overall emissions have increased (including: hydrogen cyanide +356% from 2007, hydrofluorocarbons +19%, and ammonia +109%).
PRTR REGISTER: WATER EMISSIONS (FORMERLY INES REGISTER: WATER EMISSIONS)
Data aggiornamento scheda:
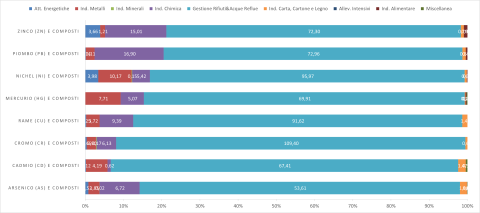
The EPRTR (European Pollutant Release and Transfer Register) is the integrated register established by the EU based on Regulation (EC) No. 166/2006, aimed at making publicly available information on environmental impacts caused by industrial facilities falling under the criteria set out in the regulation.
This indicator represents total emissions into surface waters and pollutant transfers in wastewater from industrial facilities that reported such data to the national PRTR register. For the year 2020, 60 substances were reported as present in emissions into surface water bodies, while 49 substances were declared in pollutant transfers via wastewater conveyed through pipelines to external treatment facilities.
The PRTR activity groups that contribute the highest percentages of reported pollutant emissions into both wastewater and surface waters are generally those related to "Waste and Wastewater Management" and "Chemical Industry".