Andrea Gagna
The EPRTR (European Pollutant Release and Transfer Register) is the integrated register developed by the EU under Regulation (EC) No 166/2006, with the aim of making publicly available information on environmental impacts from industrial facilities that meet the criteria established in the legislation. This indicator represents the total air emissions from industrial facilities that have reported such emissions to the national PRTR register. The air emissions declared for 2020 refer to 34 substances (non-zero values). Comparing 2020 data with 2007, it is observed that for 25 substances, total national atmospheric emissions have decreased (for 23 of these, reductions exceed 40%), while for 8 substances, overall emissions have increased (including: hydrogen cyanide +356% from 2007, hydrofluorocarbons +19%, and ammonia +109%).
The indicator represents the total air emissions from the largest industrial facilities within national territory, which are required to report to the national PRTR (Pollutant Release and Transfer Register). It also reflects the pressure exerted by installations subject to IED permits (formerly IPPC), and included in the scope of the regulation. The emission values reported are derived through measurements, calculations, or estimates and may include both point source (channelled) and diffuse (unchannelled or fugitive) emissions. Qualitative and quantitative information on air emissions is collected via PRTR declarations, based on the criteria set by the relevant legislation (Regulation (EC) No 166/2006; Presidential Decree 157/2011; and Article 30 of Legislative Decree 46/2014). These criteria include a list of pollutants (Annex II to the Regulation), each accompanied by a threshold value for emissions to a given medium (air, water, soil). The total air emission of a pollutant is declared by a PRTR facility only if it exceeds the corresponding threshold value.
The purpose is to provide qualitative and quantitative information on air emissions produced by PRTR activity categories, including those subject to IED (ex IPPC), as declared in the national PRTR register. For each substance or group of substances, the indicator reports the total value declared to the PRTR register for the given reference year and the contribution from the PRTR activity group to which the main reported activity belongs.
Regulation (EC) No 166/2006, Presidential Decree 157/2011, and Article 30 of Legislative Decree 46/2014. The objective of this legislation is to make the described environmental information publicly accessible. Compared to the previous INES Register, the PRTR covers more companies, more substances, and more monitored activities.
The PRTR data collection system is based on self-declaration by facilities and validation by competent authorities. This offers opportunities for further improving the quality and completeness of the database. The annual quality assessment of data declared to the PRTR, carried out by the authorities, may result in further adjustments to the database and to the level of national air emissions.
ISPRA
The data on total air emissions from the facilities included in the official communication to the European Commission (Art. 7 of Regulation (EC) No 166/2006) are accessible to the public on the E-PRTR (European Pollutant Release and Transfer Register) website: https://industry.eea.europa.eu/#/home
National
2007-2020
Values are obtained by aggregating data by substance and PRTR activity group.
The information collected in the PRTR register covers the years from 2007 to 2020 and refers to a list of 41 substances for the “atmosphere” medium. The air emissions reported for 2020 concern 34 substances (Table 1), a lower number than in 2019 (37 substances). Overall, the change in emissions from 2019 to 2020 was negative for 27 of the 34 substances considered.
Regarding emission trends, comparing 2020 data to 2007 shows that for 25 out of the 33 monitored substances, total national air emissions have decreased (for 23 of them, reductions exceed 40%, including: hydrochlorofluorocarbons -89.9%, nickel -87.5%, 1,2-dichloroethane -100%, SOx -76.6%, NOx -57.8%, and zinc -75.2%). For 8 substances, emissions have increased (including: hydrogen cyanide +356%, mercury +88%, dichloromethane DCM +78%, and ammonia +109.7%), while for 8 declared substances, data is missing for the relevant years (Table 1 and Figures 1–5).
| Allegati |
|---|
Thumbnail

Headline
Figure 5: Percentage distribution of air emissions of other substances among PRTR groups, in 2020 Data source
ISPRA – National Register for the Pollutant Release and Transfer Register (PRTR) |
Thumbnail
Headline
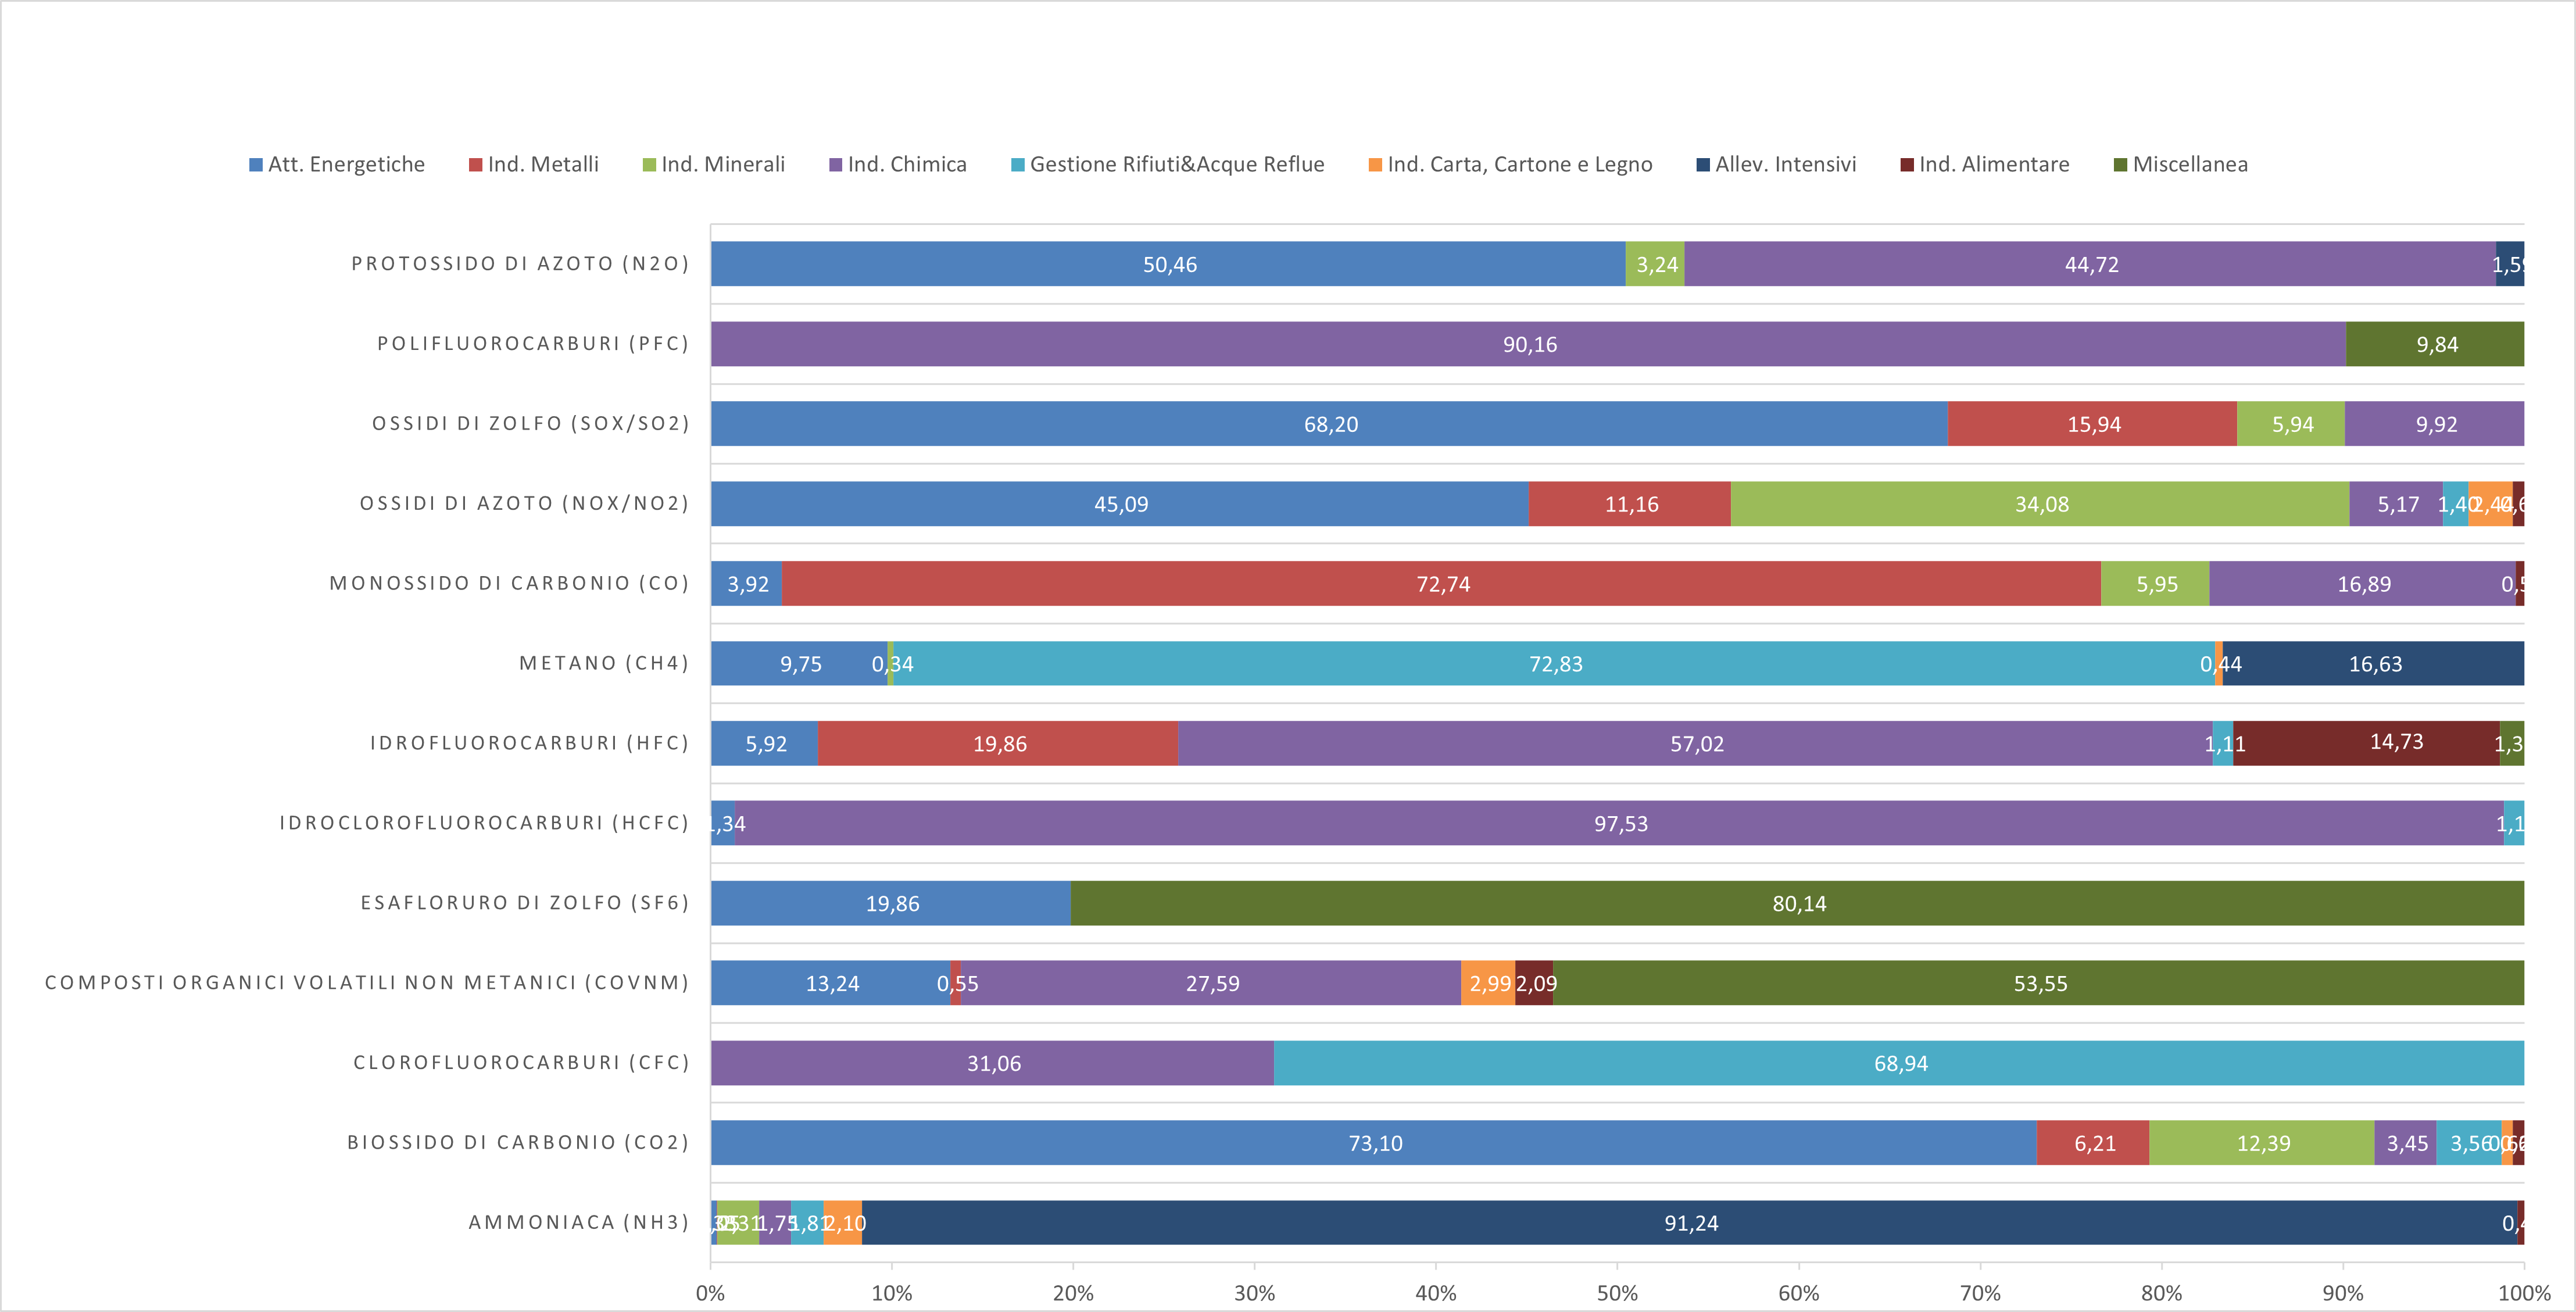
"Figure 1: Percentage distribution of air emissions of conventional and greenhouse gases among PRTR groups, in 2020" Data source
ISPRA – National Register for the Pollutant Release and Transfer Register (PRTR) |
Thumbnail

Headline
Figure 2: Percentage distribution of air emissions of heavy metals among PRTR groups, in 2020 Data source
ISPRA – National Register for the Pollutant Release and Transfer Register (PRTR) |
Thumbnail

Headline
Figure 3: Percentage distribution of total air emissions of chlorinated organic substances among PRTR groups, in 2020 Data source
ISPRA – National Register for the Pollutant Release and Transfer Register (PRTR) |
Thumbnail

Headline
Figure 4: Percentage distribution of air emissions of other organic substances among PRTR groups, in 2020 Data source
ISPRA – National Register for the Pollutant Release and Transfer Register (PRTR) |
Headline
Table 1: Total air emissions, broken down by PRTR group, in 2020" Data source
ISPRA – National Register for the Pollutant Release and Transfer Register (PRTR) |
I valori delle emissioni in atmosfera sono relativi alle sostanze incluse nell'elenco previsto dalla normativa di riferimento. I dati dichiarati dal singolo stabilimento, poiché maggiori dei valori delle corrispondenti soglie fissate per la dichiarazione PRTR, sono stati sottoposti a valutazione di qualità da parte delle autorità competenti. Le caselle vuote presenti in tabella indicano che, per l'anno considerato, non è disponibile un dato nazionale di emissione in aria per una certa sostanza, poiché i dati relativi non sono stati dichiarati dagli stabilimenti al Registro PRTR. Le Figure 1, 2, 3, 4 e 5 permettono di osservare che le attività energetiche emettono in aria la percentuale più alta di CO2,SOx, NOx, N2O, Hg, Pb, As e Cd; le attività di gestione rifiuti e acque reflue emettono in aria più del 72% del CH4 e il 68% dei CFC; gli allevamenti intensivi emettono oltre il 91% dell'ammoniaca totale in atmosfera e il settore dell'industria dei metalli emette le percentuali più alte di CO, Cr, Ni, Cu, diossine, naftalene e PM10.