Giovanni Finocchiaro, Mariangela Soraci
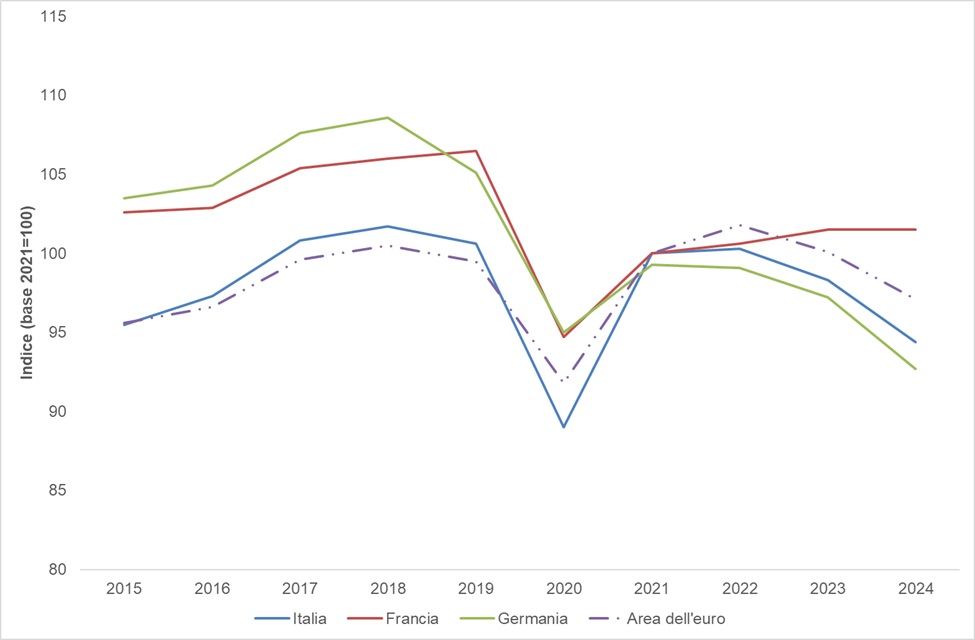
The Industrial Production Index (IPI) describes, through the monthly survey of actual production volumes, the trend of Italian industrial activity (in the strict sense). The level of industrial production is a determinant related to environmental pressures. The dynamics of industrial production in Italy generally follow the trend of major European industrial countries and the euro area average (while remaining above it). In 2020, the series reached its historical minimum (89) due to COVID-19 pandemic control measures, which forced the closure or severe restriction of production activities. Industrial production recovered in 2021 (100), matching France but exceeding Germany, and aligning with the euro area average. After stagnation between 2021 and 2022 (100.3), the index decreased again in 2023 (98.3) and 2024 (94.4). Almost all of the variability in industrial production over time is explained by changes in manufacturing activity volumes.
The general Industrial Production Index (IPI), compiled by ISTAT, measures over time the change in the physical volume of production carried out by the industry in the strict sense and its main industrial groupings. According to the ATECO 2007 classification – 2022 update, the industry in the strict sense includes economic activity sections:
B: Mining and quarrying
C: Manufacturing
D: Electricity, gas, steam, and air conditioning supply
E: Water supply; sewerage, waste management, and remediation activities
The index is based on a monthly statistical sample survey conducted on a longitudinal panel of approximately 5,400 industrial enterprises, mostly with more than 20 employees. These enterprises report monthly production flows (around 9,500) for a basket of elementary products (about 1,190), generally in physical quantities. The volume of production for the goods in the representative basket of the Italian industry is recorded monthly as the basis of the survey.
Provide a measure of the evolution over time of the output of the industrial sector, measured in terms of gross production. This information gives a descriptive and contextual representation of one of the anthropogenic (economic) determinants most correlated with environmental and health impacts.
EU Regulation 2019/2152 (European Parliament and Council, 27 November 2019) on European business statistics
Council Regulation (EC) 1165/98 on short-term statistics
No specific targets are defined for this indicator
-
-
Bank of Italy
Istat
Eurostat
- ISTAT database http://dati. istat. it/ to the entries:
- Industry and Construction/
- Production/
- Industrial production index/
- Previous bases/
- Industrial Production Index – Monthly (base 2021)
- Detail of economic sectors (Ateco4 digits) - base 2021=100
- Previous bases/
- Industrial production index/
- Production/
2. EUROSTAT database https://ec. europa. eu/eurostat/web/main/data/database to the entries:
- Detailed datasets/
- Industry, trade and services/
- Short-term business statistics/
- Industry/
- Production in industry/
- Production in industry – annual data
- Production in industry/
- Industry/
- Short-term business statistics/
- Industry, trade and services/
National
2014-2024
Base data are presented as-is or after minimal mathematical processing (e.g., year-over-year percentage change). Annual indices are calculated as the simple arithmetic mean of monthly indices.
From January 2022, ISTAT moved from fixed-base to moving-base methodology (annual chaining), consistent with methodological manuals.
Elementary indices are calculated using Laspeyres formula, with weights updated annually reflecting the industrial value-added distribution in the base year. Indices are then referenced to the standard base, with 2021 as the base year from 2023 onwards.
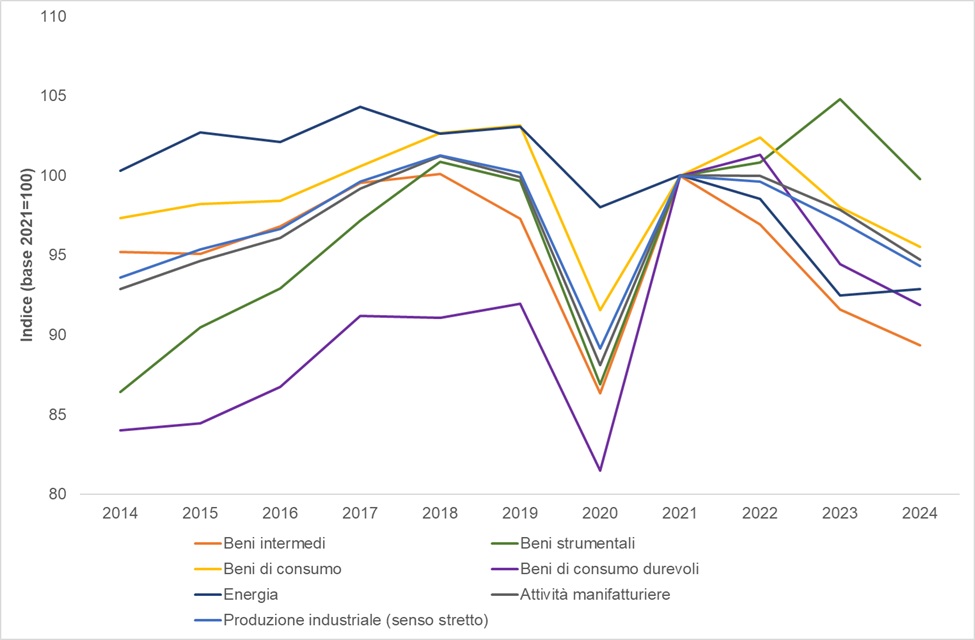
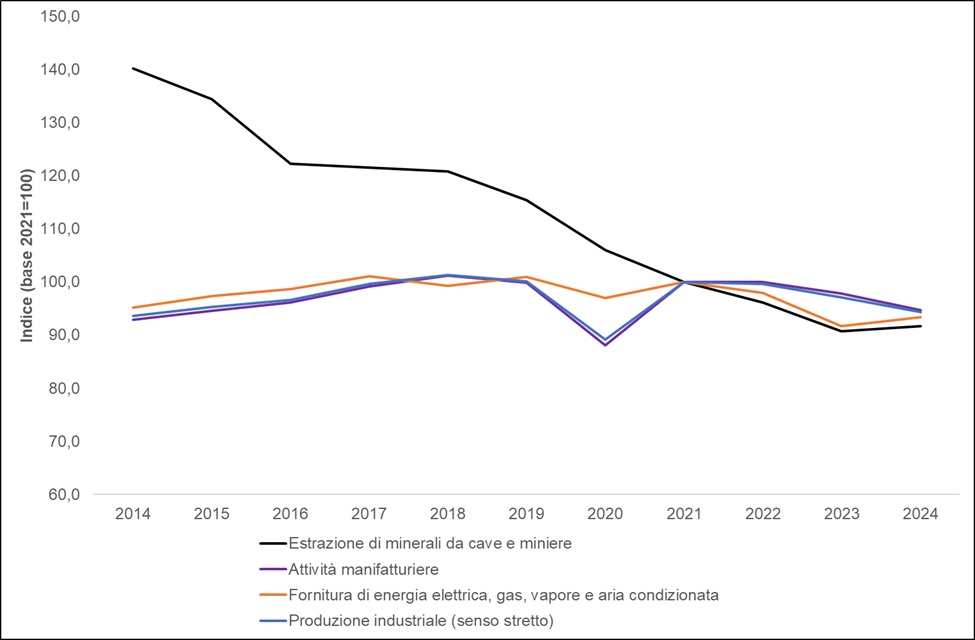
In 2024, compared to the previous year, a decline was recorded, in particular, for the production of durable consumer goods (from 94.5 to 91.9), non-durable consumer goods (from 98.6 to 96.1), intermediate goods (from 91.6 to 89.4) and capital goods (from 104.8 to 99.8), as well as manufacturing activities (from 97.9 to 94.7) (Table 1 and Figure 1). However, the supplies of electricity, gas, steam and air conditioning increased (from 91.7 to 93.4), the extraction of minerals from quarries and mines (from 90.7 to 91.7) and energy (from 92.5 to 92.9). With reference to the European context, despite the decline, the Italian industrial production index (94.4) remains higher than that of Germany (92.7, decreasing), but below that of France (101.5, increasing), however lower than the euro area average (97.1, decreasing) (Table 2 and Figure 3).
In 2024, the volume of industrial production, after a year of post-pandemic growth, decreases with values still higher than those reached in the pre-pandemic period (2014-2019) (Table 1 and Figure 1).
In fact, in the pre-pandemic period, industrial production volumes (in the strict sense) as a whole grew by 6.6 percentage points, while in the post-pandemic period (2021-2024) they decreased by 5.7 p. p. In detail, in the pre-pandemic period, capital goods recorded the greatest growth (13.2 p. p.), followed by durable consumer goods (8 p. p.), while a decline was recorded in the post-pandemic period especially for intermediate goods (10.7 p. p.). The performance of the Energy index does not faithfully follow the underlying dynamics of the sector (Figure 1) and grows slightly (0.4 p. p.) in the pre-pandemic period, losing 7.1 p. p. In the following period. Almost all the variability in industrial production over time is linked to the change in the volume of manufacturing activities, whose curve overlaps almost perfectly with the general one of industry in the strict sense (Figures 1 and 2). What is totally disconnected from the main dynamics is the mining industry, of which the monotonous decreasing trend of the volume is clearly evident, which collapses by 24.9 p. p. In the pre-pandemic period and 8.3 p. p. In the post-pandemic period.
In the pre-pandemic period, the production of Italy, France, Germany and the euro area average were misaligned but still growing: Italian production volumes remained above (5.1 p. p.) by several percentage points (Table 2 and Figure 3), until the collapse of 2020 (89 p. p.), where the series of all countries converge, with moderate deviations from the average (while Italian production remained above the average of the euro area). In the two years after the pandemic crisis, the recovery of the Italian industry is full, returning in line with the euro area and then decreasing in 2023 (98.3 p. p.) and 2024 (94.4 p. p.); the dynamics between the main European industrial countries are once again diverging.
| Data |
|---|
Headline
Table 1: Industrial production indices, overall and by main industrial groupings and ATECO sections (Base 2021=100)0) Data source
ISPRA elaboration on ISTAT data Note
Calendar-corrected indices |
Headline
Table 2: Industrial production indices, Italy, France, Germany, and euro area (Base 2021=100) Data source
ISPRA elaboration on Eurostat data Note
Annual data corrected for working days; from 2023 euro area countries increased from 19 to 20; 2023 value is Eurostat estimate |
Headline
Table 3: Industrial production index, manufacturing industry and selected subsections (Base 2021=100)0) Data source
ISPRA elaboration on ISTAT data Note
Calendar-corrected indices; annual index is the arithmetic mean of monthly indices |
Headline
Figure 1: Industrial production indices, overall and main industrial groupings Data source
ISPRA elaboration on ISTAT data Note
Calendar-corrected indices |
Headline
Figure 2: Industrial production indices, overall and components Data source
ISPRA elaboration on ISTAT data Note
Calendar-corrected indices |
Headline
Figure 3: Industrial production indices, Italy, France, Germany, and euro area Data source
ISPRA elaboration on Eurostat data Note
Annual data corrected for working days; from 2023 euro area countries increased from 19 to 20; 2023 value is Eurostat estimate |
Headline
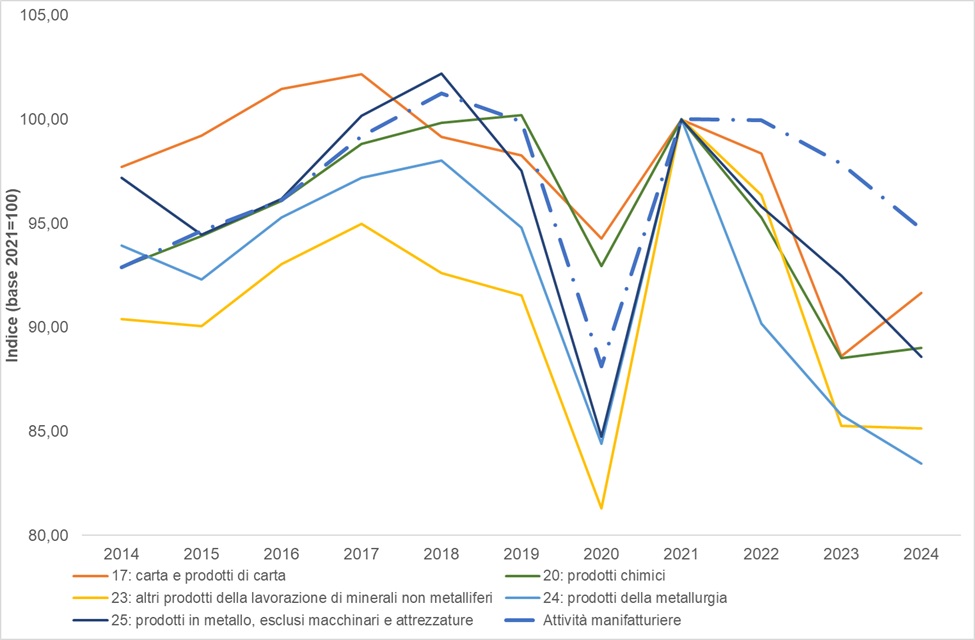
Figure 4: Industrial production index, manufacturing activities and selected divisions Data source
ISPRA elaboration on ISTAT data Note
Calendar-corrected indices |
Thumbnail
Titolo
Figure 1: Industrial production indices, overall and main industrial groupings Fonte
ISPRA elaboration on ISTAT data Note
Calendar-corrected indices |
Thumbnail
Titolo
Figure 2: Industrial production indices, overall and components Fonte
ISPRA elaboration on ISTAT data Note
Calendar-corrected indices |
Thumbnail
Titolo
Figure 3: Industrial production indices, Italy, France, Germany, and euro area Fonte
ISPRA elaboration on Eurostat data Note
Annual data corrected for working days; from 2023 euro area countries increased from 19 to 20; 2023 value is Eurostat estimate |
Thumbnail
Titolo
Figure 4: Industrial production index, manufacturing activities and selected divisions Fonte
ISPRA elaboration on ISTAT data Note
Calendar-corrected indices |
A comparison is proposed between the trend of the industrial production index of manufacturing activity as a whole and the trend of some industrial-manufacturing sub-sectors whose specific emissions and CO2 are monitored by their own indicators in the industry theme. The ATECO 2007 economic divisions examined for comparison are: "17: paper and paper products"; “20: chemicals”; “23: products from the processing of non-metallic minerals”; “24: metallurgy products”; “25: metal products, excluding machinery and equipment” (Figure 4).
In 2024, the selected divisions present decreasing production volumes compared to the previous year, except for paper and paper products (from 88.6 to 91.64) and chemical products (from 88.53 to 89.01), in line with Manufacturing Activities (from 97.86 to 94.73). Some divisions decreased significantly: metallurgy products from 85.79 to 83.44; metal products excluding machinery and equipment from 92.48 to 88.57; others less: other products from the processing of non-metallic minerals from 85.27 to 85.14. The decline is recorded in the post-pandemic period (2021-2024), in particular the manufacturing sector decreases as a whole (-5.28 p. p.), metallurgy products are those that lose the most production volume (-16.57 p. p.), followed by other products from the processing of non-metallic minerals (-14.87 p. p.), metal products excluding machinery and equipment (-11.42 p. p.), chemical products (-10.99 p. p.) and paper and paper products (-8.34 p. p.) (Table 3 and Figure 4).