Data aggiornamento scheda:
I valori di defogliazione indicano il livello di resilienza o di suscettività delle specie all’impatto causato da deposizioni atmosferiche e inquinanti gassosi. I dati rilevati negli ultimi 28 anni (1997-2024) mostrano un andamento altalenante fino al 2020, con anni di attenuazione e anni di crescita del fenomeno e una maggiore sensibilità delle latifoglie. A partire dal 2021, invece, è stato registrato un peggioramento del fenomeno, con valori di defogliazione molto alti, mai raggiunti prima. Tali valori, nel 2023, hanno toccato il 45% per latifoglie e aghifoglie. Questo trend di peggioramento, che andrà verificato sulla base delle rilevazioni dei prossimi anni, si è lievemente attenuato nel 2024 in cui si sono registrati valori del 35,6% di defogliazione delle aghifoglie e del 43,3% delle latifoglie.
Data aggiornamento scheda:
Il fenomeno degli incendi, analizzato sulla base dei dati raccolti dal 1970 al 2024 dal CUFA dell'Arma dei Carabinieri (ex Corpo Forestale dello Stato) presenta un andamento altalenante, con anni di picco (1993, 2007, 2017, 2021) che si alternano ad anni di attenuazione (2013, 2014, 2018, 2024). La presenza degli incendi all’interno delle Aree Protette (registrata a partire dal 2003), pur mostrando oscillazioni annuali, rimane elevata, con una media negli ultimi tre anni di 11.000 ettari percorsi dal fuoco. Molto alta l’incidenza degli incendi di origine volontaria, che rappresentano circa la metà degli eventi registrati, arrivando in alcuni anni a superare il 60%.
Data aggiornamento scheda:
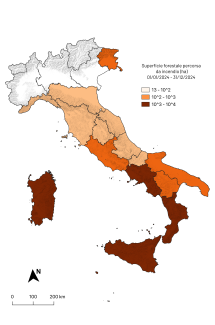
L’indicatore prende in esame la serie di dati relativi alla superficie forestale percorsa da grandi incendi su scala nazionale, regionale e nelle aree protette nel periodo tra il 2018 e il 2024.
La distribuzione e l’estensione delle superfici forestali percorse da incendi mostra in genere una rilevante variabilità interannuale. Il 2024, in particolare, è risultato un anno meno gravemente affetto dall’estensione delle aree forestali colpite da incendi rispetto agli anni precedenti. La superficie forestale bruciata, infatti, risulta superiore solo a quanto bruciato nel 2018 e nel 2019, ma decisamente inferiore rispetto a tutti gli anni dal 2020 al 2023.
Nel 2024 le regioni maggiormente colpite sono la Sicilia (2.588 ha), la Calabria (2.494 ha) e la Sardegna (1.734 ha), che insieme rappresentano il 66% di tutta la superficie forestale a livello nazionale colpita da incendi.
Le classi forestali più colpite sono le latifoglie sempreverdi (es. leccete e macchia mediterranea), seguite in misura di poco inferiore dalle latifoglie decidue (es. quercete e faggete) e decisamente inferiore dalle conifere (es. pinete, abetaie e lariceti).
L’analisi mediante regressione lineare della serie dei dati di copertura forestale nazionale percorsa da incendio non mostra un trend in aumento, sebbene la dimensione della serie non consenta valutazioni di medio e lungo periodo. È stato invece osservato un debole ma statisticamente significativo trend in aumento per le regioni Puglia, Basilicata e Calabria.