UN - SDG Goals
Goal 13: Climate action
Adottare misure urgenti per combattere il cambiamento climatico e le sue conseguenze.
The indicator represents the time series of national greenhouse gas emissions from 1990 to 2023, broken down by sector of origin. Data analysis shows that in 2023 there was a significant reduction in emissions compared to 1990 (-26.4%), explained by the economic recession, which curbed consumption in recent years, but also by a greater use of renewable energy sources. This resulted in a reduction in CO₂ emissions from the energy sector (-26.9% compared to 1990).
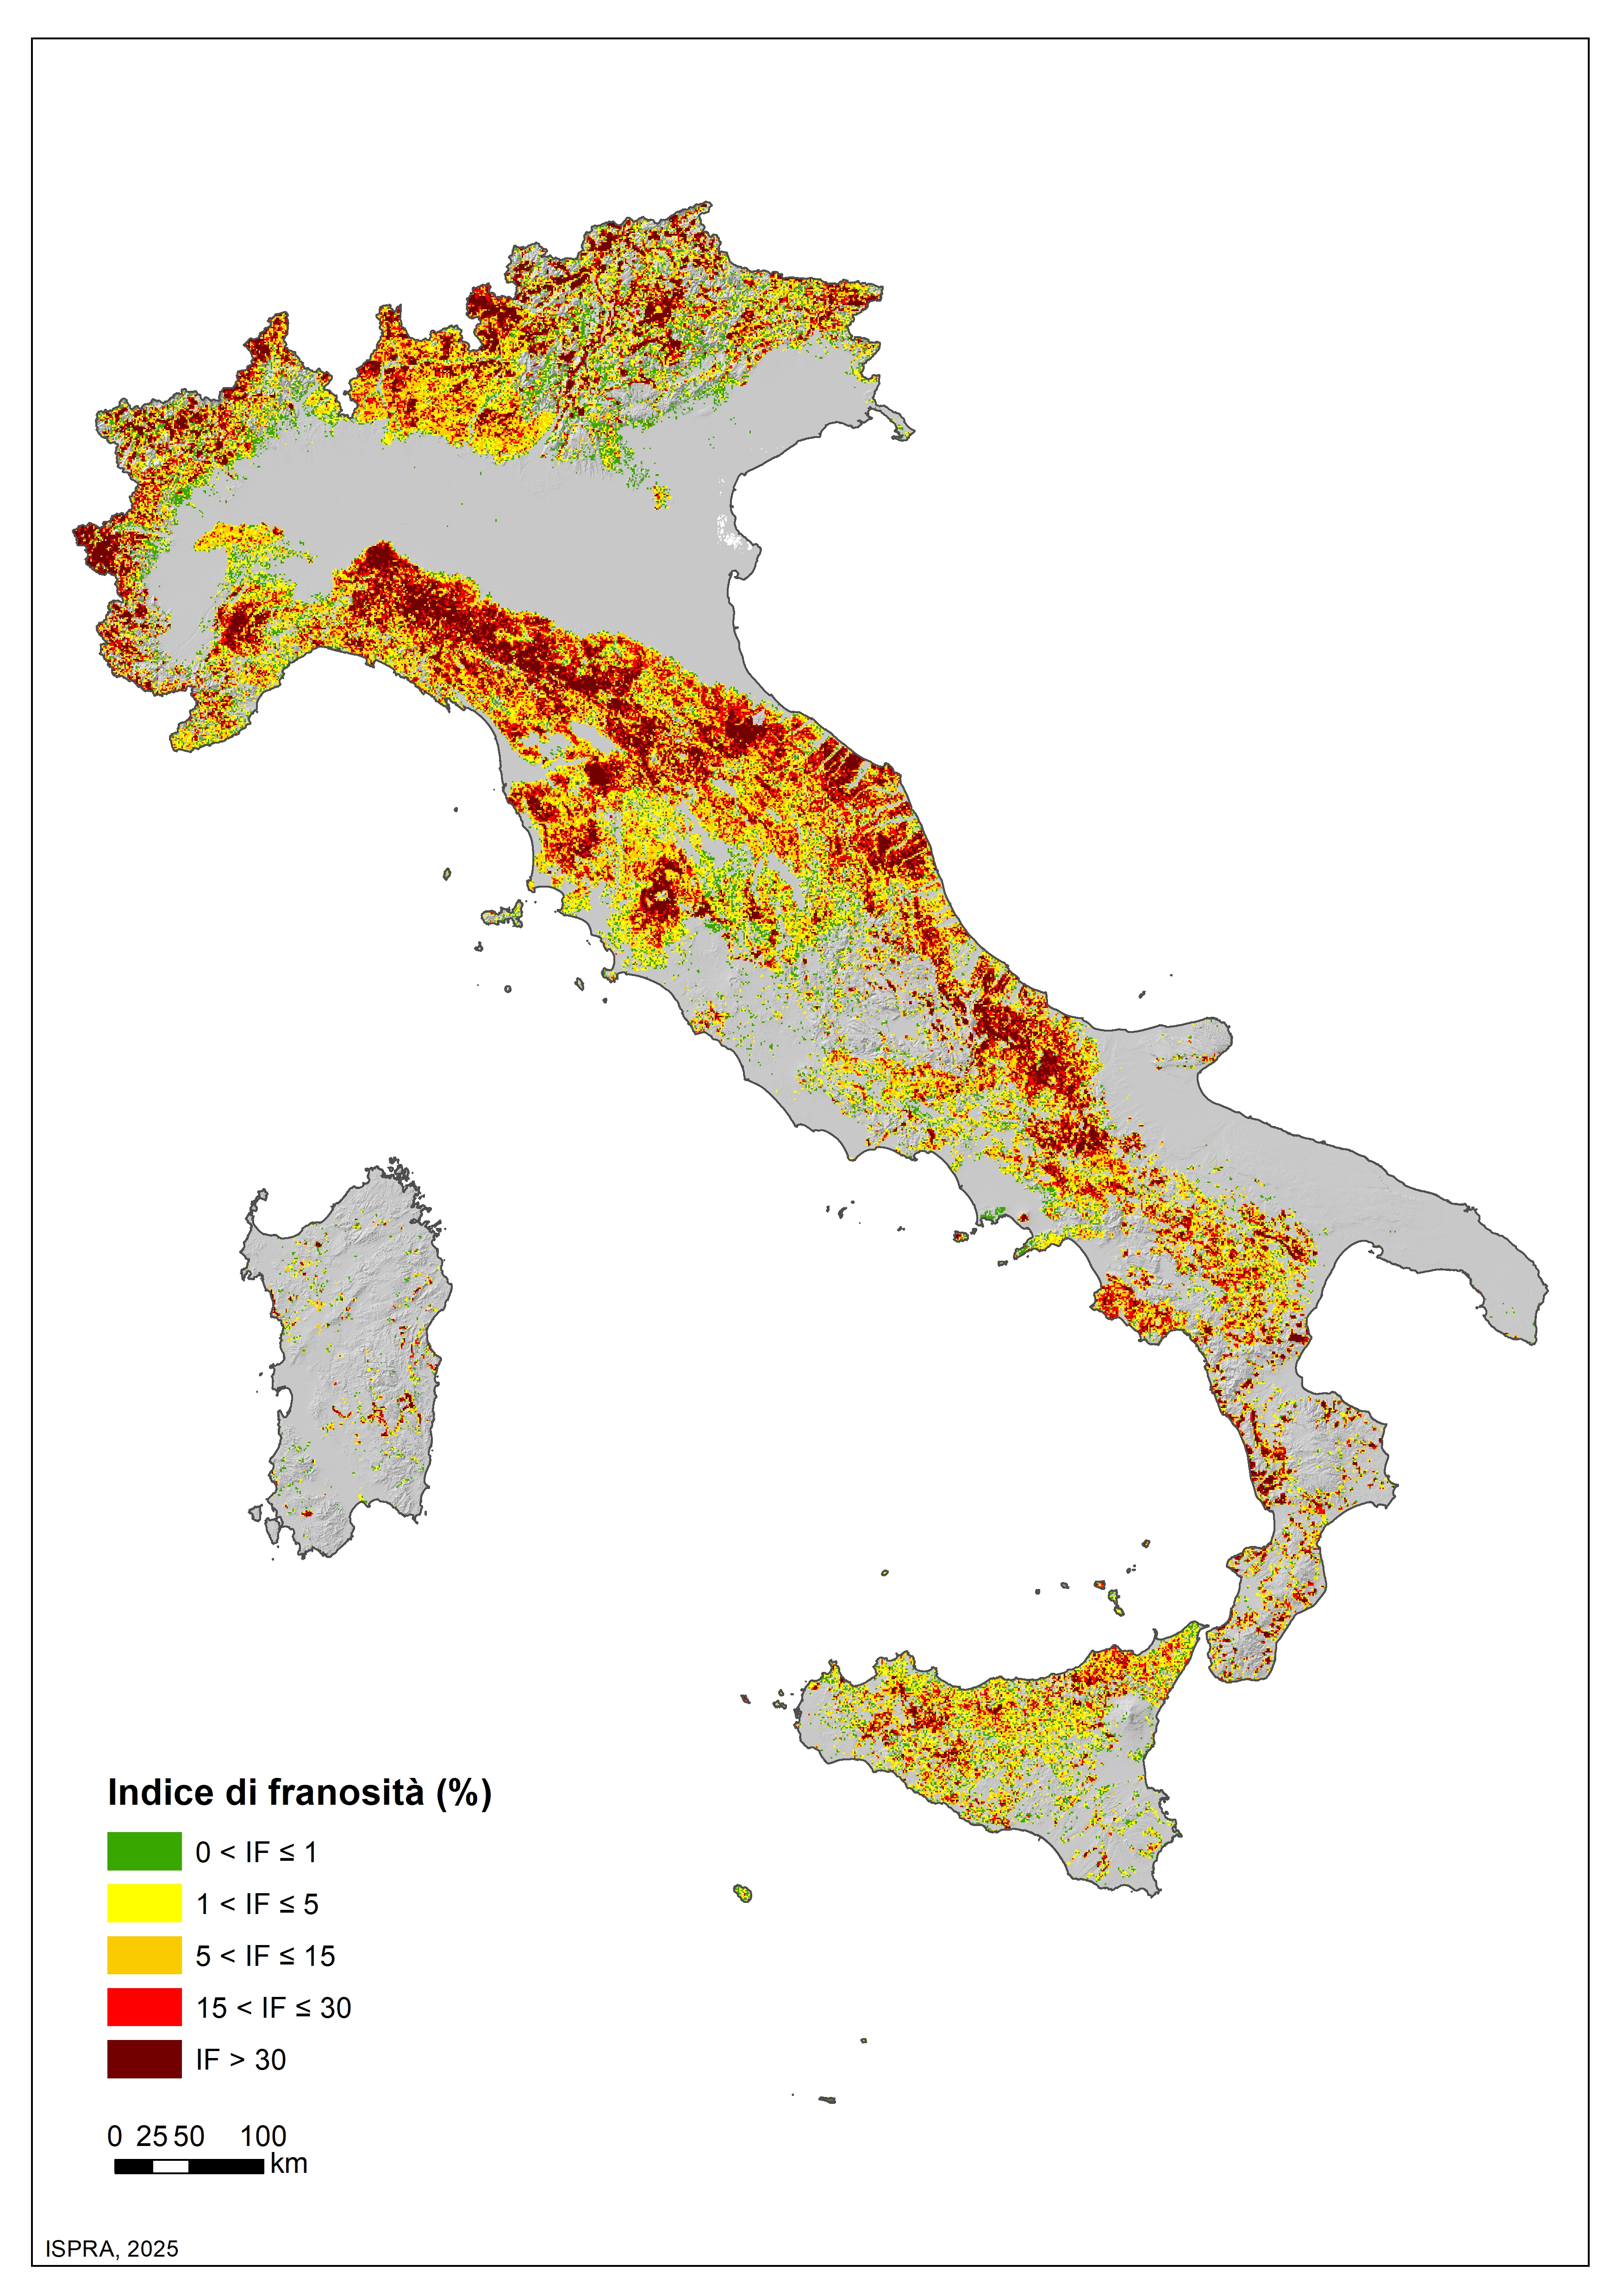
The indicator provides information on the number and distribution of landslides in Italy. More than 636,000 landslides have been recorded (reference period 1116–2025), affecting an area of over 25,100 km², equivalent to 8.3% of the national territory.
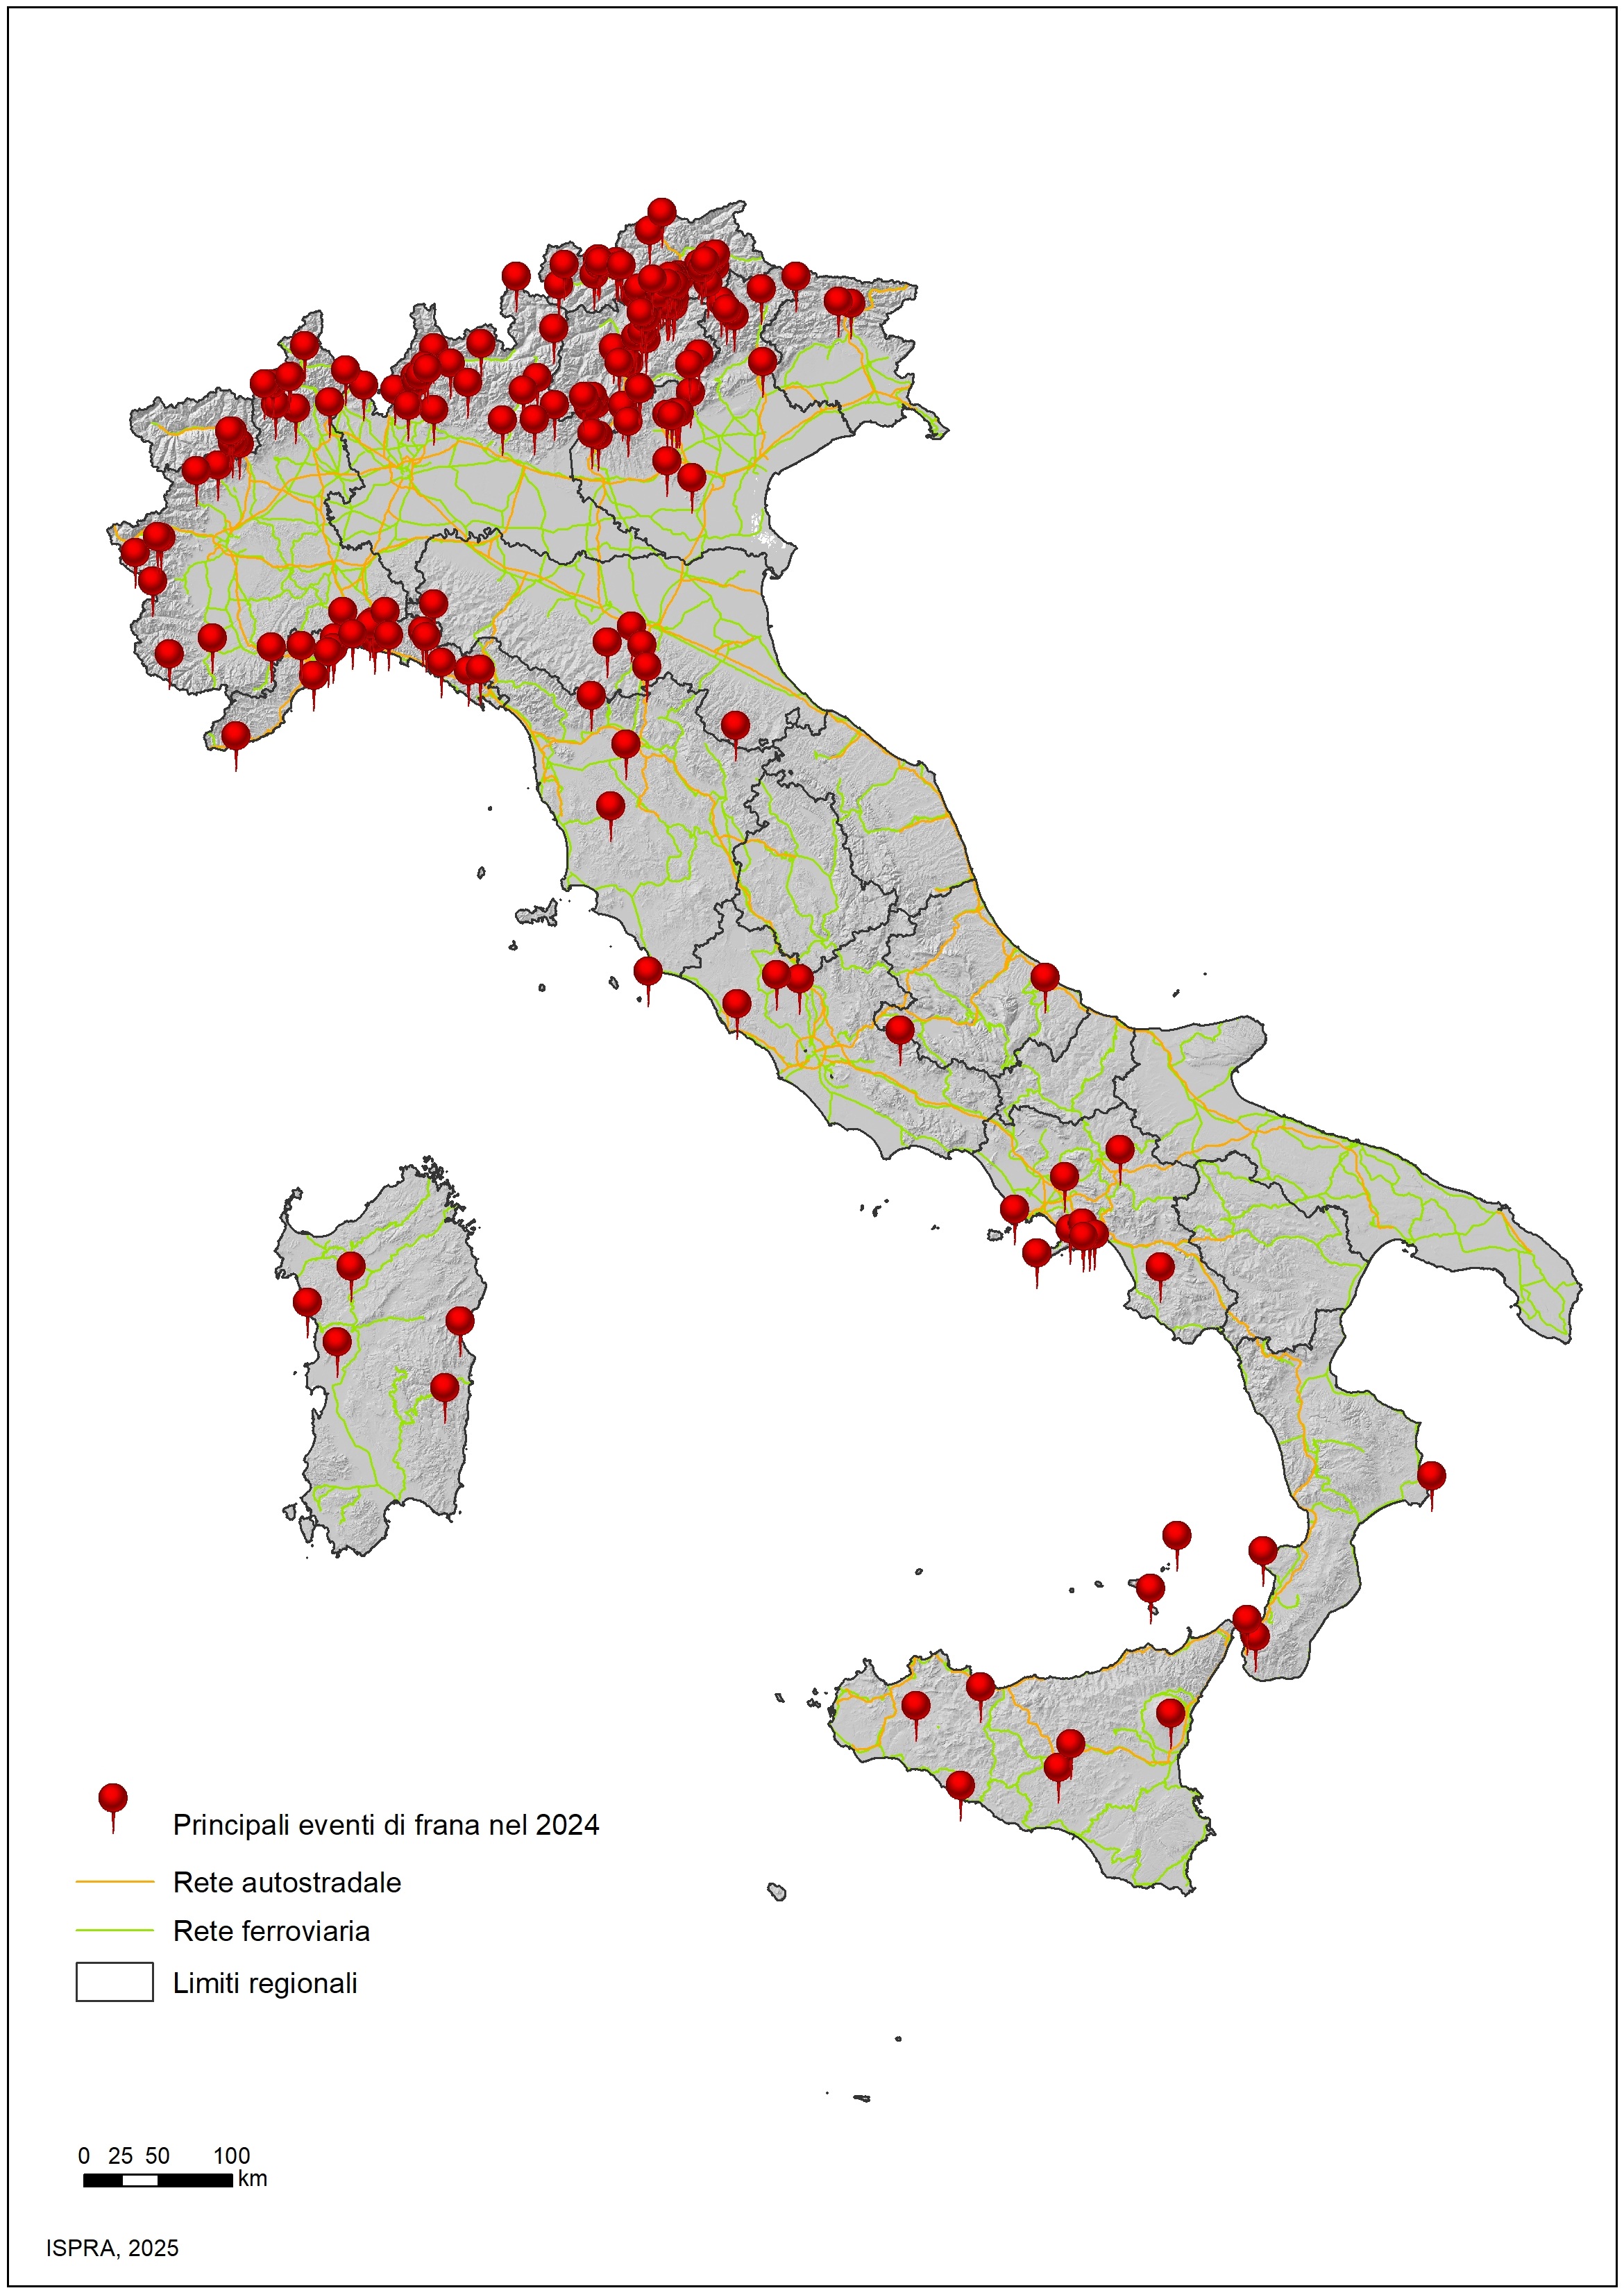
The indicator provides information on the main landslide events that caused fatalities, injuries, evacuations, and damage to buildings, cultural heritage assets, primary linear communication infrastructures, and service networks across the national territory over the past year. In 2024, there were 185 major landslide events, resulting in 5 deaths, 18 injuries, and predominantly causing damage to the road network and buildings.

The indicator is defined as the number of volcanic eruptions that produced significant impacts on human activities during the year.
In 2024, both Etna and Stromboli were active, with the most pronounced peaks occurring between July and August.
The indicator describes the trend of mean temperature in Italy.
The increase in mean temperature recorded in Italy over the last thirty years has often exceeded the global average over land. In 2024, the mean temperature anomaly in Italy, relative to the 1991–2020 climatological baseline, was +1.33 °C—higher than the global land surface anomaly of +1.03 °C. In Italy, 2023 ranked as the warmest year in the entire annual time series starting from 1961. Since 2000, temperature anomalies relative to the 1991–2020 baseline have consistently been positive, except for four years (2004, 2005, 2010, and 2013).
The indicator represents projections of national greenhouse gas emissions up to 2055, considering the scenario based on policies in place as of 31 December 2022 — thus including those under the National Recovery and Resilience Plan (NRRP) — and the scenario with additional policies and measures defined by the National Integrated Energy and Climate Plan (PNIEC).
The scenario was developed starting from the latest consolidated historical data for 2023, as well as the expected evolution of key macroeconomic drivers according to the information provided to the European Commission.
Information available for 2024 and data relating to the first seven months of 2025 were also taken into account.
The projected reductions in total greenhouse gas emissions (including LULUCF) estimated for 2030 compared to 1990 are -42% in the current policies scenario and -53% in the additional policies scenario.

The indicator provides an estimate of the population at risk of landslides (risk of personal injury: dead, missing, injured, evacuated) on a national, regional, provincial and municipal basis. In Italy, the population at risk of landslides residing in areas with high and very high PAI danger (P3+P4) amounts to 1,284,960 inhabitants, equal to 2.2% of the total.
The indicator represents, over the period 1990-2023, the trend of greenhouse gas emissions in Italy per capita and relative to GDP. A decrease is observed for both, accentuated by the growth of the population and GDP, which highlights a decoupling between drivers and pressures.

The indicator analyzes the distribution of large and small dams in relation to the seismic classification of the national territory (Map of seismic zones OPCM March 20, 2003, n. 3274 and subsequent integrations), the Landslide Index of the IFFI Project (Italian Landslide Inventory), and the distribution of landslide-prone areas. For the year 2024, the indicator shows that the water surface of artificial and heavily modified natural lakes (the water perimeter for large and small dams) in areas with a null Landslide Index (IF) constitutes 71.6%, while only 1.8% falls in areas with a higher IF (IF>30). In terms of seismic activity, 7.4% of large dams and 2.2% of small dams are are located in the most dangerous area (seismic zone 1), while 20.6% and 11.9%, respectively, are in the least dangerous area (seismic zone 4). Due to incomplete data on the distribution of small reservoirs at the national level, the result is considered partial.

In 2023, Italy experienced one of the hottest years in the last 150 years, second only to 2022. The average and maximum temperatures reached new records with October recording temperatures more than 3°C higher than the 1991-2021 average, marking the highest value since 1961. During the summer, intense heatwaves affected the country, with record temperatures of 48.2°C recorded on July 24 in Jerzu and Lotzorai in Sardinia, and 41.2°C in Rome in early August. Drought continued to be a significant problem, with Northern and Central Italy experiencing severe drought conditions in the first four months of the year, which later eased. However, in the last three months of the year, Sicily and parts of Ionian Calabria suffered from extreme drought with a significant precipitation deficit.
Extreme weather events affected several regions, causing severe damage. In May, Emilia-Romagna was devastated by two exceptional rainfall events, leading to flooding, landslides, and 17 fatalities. On November 2, heavy thunderstorms in Tuscany caused flooding and 8 deaths, with exceptional rainfall recorded in the provinces of Pisa, Livorno, Pistoia, and Prato.
In summary, 2023 was characterized by record temperatures, persistent drought, and extreme weather events that had a significant impact on various italian regions.

This indicator provides an overview of the population residing in flood-prone areas (population exposed to flood risk) at the national, regional, provincial, and municipal levels. In Italy, the population residing in areas with high hazard/probability is 4.1% of the total national population (2,431,847 people); those exposed to medium hazard/probability are 11.5% (6,818,375 people), while the population in areas with low hazard/probability is 20.6% (12,257,427 people).