Panel 1
Daniela Romano
The indicator represents the trend of national persistent organic pollutant emissions by sector, from 1990 to 2022. The target set as a lower emission value than in 1990 was achieved for both PAHs (-30%) and dioxins and furans (-43%), with different trends.
Polycyclic Aromatic Hydrocarbons (PAHs), dioxins and furans are organic compounds that derive from energy production activities, thermal plants and industrial processes. Other minor sources of emissions are the traffic and incineration of organic waste. PAHs are also released into the atmosphere from natural sources such as volcanic eruptions, forest fires and the activity of some species of microorganisms. These groups of substances have health relevance for their toxicity and persistence in the environment (they give rise to bioaccumulation phenomena) and, as carcinogens of different intensity, 2,3,7,8 Tetrachlorodibenzo-para-dioxin are classified by IARC as certain carcinogens, PAHs are probable, and dioxins and furans are possible.
The estimation of total and disaggregated national emissions by production process of PAHs, dioxins and furans, makes it possible to assess the emission trend in the period under review and compare it with the objective set by the Aarhus Protocol.
The Aarhus Protocol on Persistent Organic Pollutants (1998), under the Geneva Convention on Long-Range Transboundary Air Pollution (1979), sets as an target the reduction of emissions of dioxins, furans and PAHs below the levels achieved in 1990 (or, alternatively, every other year between 1985 and 1995).
Panel 2
ISPRA, 2024. Italian Emission Inventory 1990-2022. Informative Inventory Report 2024
ISPRA, Pantaleoni M., Taurino E., De Lauretis R.. Emissioni in atmosfera di PCB e HCB in Italia dal 1990 al 2006, 2008.
R. De Lauretis, Dioxin and furan Italian national and local emission inventories, in “Dioxin’99, 19th International Symposium”, vol.41 pp 487-490, Venezia, 1999
Pastorelli G., De Lauretis R., De Stefanis P., Fanelli. R, Martines C., Morselli L., Pistone L., Viviano G., Sviluppo di fattori di emissione da inceneritori di rifiuti urbani lombardi e loro applicazione all’inventario nazionale delle diossine, su Ingegneria Ambientale ANNO XXX N.1 Gennaio 2001, 2001
Data quality assessment
ISPRA
National
1990 - 2022
Indicator assessment
Estimate made as part of the preparation of the national inventory of emissions into the atmosphere. As far as PAHs are concerned, the unit of measurement is the tonne (t). For dioxins and furans, emissions are reported in grams of toxic equivalent according to the I-Teq toxicity classification (g I-Teq). For air pollutants, the methodology used is that indicated by the European Environment Agency (EMEP/EEA Guidebook - 2019). For the description of the estimation methodology, please refer to the Informative Inventory Report – IIR 2024 (https://www.isprambiente.gov.it/it/pubblicazioni/rapporti/; https://www.ceip.at/status-of-reporting-and-review-results/2024-submission). The annual emission update involves the revision of the historical series on the basis of the latest information and methodological developments, to ensure the consistency and compatibility of the inventory.
The emission values of PAHs in 2022 stood at 63 t, while for dioxins and furans a level of 304 gI-Teq was observed. In 1990, emission levels were 90 t for PAHs and 529 gI-Teq for dioxins and furans. The target set by the Aarhus Protocol, to reduce emissions of dioxins, furans and PAHs below their 1990 levels, has been met for both substances (Tables 1 and 2).
Emissions of PAHs and dioxins and furans, from 1990 to 2022, decreased by 30% and 43% respectively, thus outlining a positive trend (Tables 1, 2 and Figure 1).
Data
Table 1: Emissions of PAHs – Polycyclic Aromatic Hydrocarbons by sector
ISPRA
A: Energy production and transformation industry combustion
B: Non-industrial combustion
C: Industrial combustion
D: Production processes
F: Solvent and product use
G: Road transport
H: Other mobile sources
I: Waste treatment and disposal
L: Agriculture
Emission values have been updated in accordance with the annual update of the national emission inventory.
Table 2: Emissions of Dioxins and Furans by sector
ISPRA
A: Energy production and transformation industry combustion
B: Non-industrial combustion
C: Industrial combustion
D: Production processes
F: Solvent and product use
G: Road transport
H: Other mobile sources
I: Waste treatment and disposal
L: Agriculture
Emission values have been updated in accordance with the annual update of the national emission inventory.
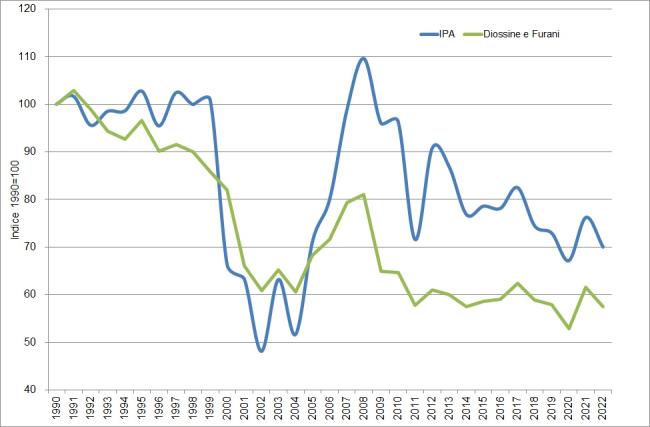
Figure 1: Trend of national emissions of persistent organic pollutants indexed to 1990
ISPRA
Emission values have been updated in accordance with the annual update of the national emission inventory.
Dioxin and furan emissions have decreased in all sectors since 1990, except for production processes (+20%) (Table 2). In 2022, dioxin and furan emissions derive 33% from non-industrial combustion processes, 27% from production processes, 17% from the waste sector, 20% from combustion processes in industry and smaller shares from the road transport sector (3%), combustion processes for energy production (2%). A marked decrease is observed between 1995 and 2002 and between 2008 and 2011 for the use of abatement technologies in the main domestic steel production industry (Table 2, Figure 1). PAH emissions are reduced by 30% in 2022 compared to 1990. In detail, there is a fairly constant trend from 1990 to 1999, followed by a sharp decrease between 1999 and 2000 and a recovery from 2005 onwards. The sharp decline between 1999-2000 is mainly due to technological improvements in production processes (steel mills), whose emissions fall by a total of 85% between 1990 and 2022. On the other hand, emissions from the non-industrial combustion sector rise sharply during the period under review (+58%), accentuated by the large increase in wood consumption for heating purposes. These two sectors account for 12% and 80% of total PAH emissions in 2022, respectively (Table 1, Figure 1).