Panel 1
Daniela Romano
The indicator represents the time series of national greenhouse gas emissions from 1990 to 2023, broken down by sector of origin. Data analysis shows that in 2023 there was a significant reduction in emissions compared to 1990 (-26.4%), explained by the economic recession, which curbed consumption in recent years, but also by a greater use of renewable energy sources. This resulted in a reduction in CO₂ emissions from the energy sector (-26.9% compared to 1990).
Greenhouse gas emissions are largely due to carbon dioxide (CO₂), mainly linked, in terms of anthropogenic activities, to the use of fossil fuels. Methane (CH₄) also contributes to the greenhouse effect; its emissions are mainly related to livestock activities in the agricultural sector, waste disposal, and leakages in the energy sector. Nitrous oxide (N₂O) emissions mainly originate from agricultural and energy activities, including transport. The overall contribution to the greenhouse effect of F-gases or fluorinated gases (HFCs, PFCs, SF₆, NF₃) is lower compared to the above-mentioned pollutants, and their presence derives primarily from industrial and refrigeration activities. Greenhouse gas emissions are calculated according to the IPCC methodology and are all expressed in tonnes of CO₂ equivalent, applying the Global Warming Potential (GWP) coefficients for each compound.
The indicator, which represents an estimate of national greenhouse gas emissions and their sectoral breakdown, aims to assess emission trends and the achievement of targets established under the United Nations Framework Convention on Climate Change (UNFCCC) and the Paris Agreement.
United Nations Framework Convention on Climate Change (UNFCCC), 1992.
Kyoto Protocol, 1997.
Law No. 65/1994; Law No. 120/2002.
CIPE Resolution No. 123/2002.
Law No. 316/2004 (conversion into law, with amendments, of Decree Law No. 273/2004 on urgent provisions for the implementation of Directive 2003/87/EC on greenhouse gas emission allowance trading within the European Community).
Legislative Decree No. 51/2008; Effort Sharing Decision 406/2009/EC.
Legislative Decree No. 30/2013; EU Regulation No. 525/2013.
Legislative Decree No. 111/2015; Paris Agreement, 2015.
Law No. 79/2016; EU Regulation No. 842/2018.
EU Regulation No. 1999/2018; EU Directive No. 2001/2018.
Italy ratified the United Nations Framework Convention on Climate Change (UNFCCC) through Law No. 65/1994, established during the 1992 Rio Earth Summit. The Convention’s objective is to stabilize greenhouse gas concentrations in the atmosphere at a level that would prevent dangerous anthropogenic interference with the climate system. The Kyoto Protocol, signed in 1997 and ratified by Law No. 120/2002, entered into force in 2005 and constituted the first implementing instrument of the Convention. Italy committed to reducing its total national greenhouse gas emissions by 6.5% compared to 1990 levels during the period 2008–2012.
In Italy, the monitoring of greenhouse gas emissions is ensured by ISPRA, under Legislative Decree No. 51 of 7 March 2008 and Legislative Decree No. 30 of 13 March 2013, which established the National System for the greenhouse gas emission inventory. For the years 2013–2020, the Doha Amendment to the Kyoto Protocol was adopted on 8 December 2012. The EU and its Member States committed, in this second phase of the Protocol, to collectively reduce emissions by 20% below 1990 levels or another base year.
A new global agreement was reached in Paris in December 2015 for the period after 2020. The agreement aims to strengthen the global response to the threat of climate change by keeping the global temperature rise well below 2°C above pre-industrial levels, while pursuing efforts to limit the temperature increase to 1.5°C. The Paris Agreement entered into force on 4 November 2016.
Law No. 79/2016, ratifying and implementing the Doha Amendment to the Kyoto Protocol, defines a National Low-Carbon Development Strategy, establishes the National System on policies, measures, and projections, and sets rules for monitoring and reporting greenhouse gas emissions and climate change information.
At the European level, the greenhouse gas emission reduction targets for 2020 were set by EU Regulation No. 525/2013, concerning the EU Monitoring Mechanism for greenhouse gas emissions, and for 2030 by the 2030 Climate and Energy Framework. In particular, the European Union and its Member States, under the UNFCCC, the Kyoto Protocol, the 2012 Doha Amendment, and the 2015 Paris Agreement, committed to reducing collective emissions by 20% by 2020 and 40% by 2030 compared to 1990 levels. In December 2020, the EU’s binding climate target for 2030 was updated to a net domestic reduction in greenhouse gas emissions (after accounting for removals) of at least 55% compared to 1990 levels.
Panel 2
ISPRA, 2022. The provincial-level disaggregation of the national emissions inventory. Reports 369 / 2022. Available at: http://www. isprambiente. gov. it/it/pubblicazioni/rapporti ISPRA, 2022.
ISPRA, 2022. Greenhouse gas emissions in Italy at the end of the second period of the Kyoto Protocol: energy reduction and efficiency objectives. Reports 362 / 2022.
ISPRA, 2024. Greenhouse gas emissions in Italy. Reduction targets for 2030. Reports 399/2024.
IPCC Guidelines for National Greenhouse Gases Inventories, Revised 1996, IPCC, 1997
IPCC/WMO/UNEP, Good Practice Guidance and Uncertainty Management in National Greenhouse Gas Inventories, IPCC, 2000
IPCC, 2003. Good Practice Guidance for Land Use, Land-Use Change and Forestry. IPCC Technical Support Unit, Kanagawa, Japan I
IPCC, 2006 Guidelines for National Greenhouse Gas Inventories, Prepared by the National Greenhouse Gas Inventories Programme, Eggleston H. S., Buendia L., Miwa K., Ngara T. And Tanabe K.(eds). Published: IGES, Japan.
IPCC, 2014. 2013 Revised Supplementary Methods and Good Practice Guidance Arising from the Kyoto Protocol. Hiraishi, T., Krug, T., Tanabe, K., Srivastava, N., Baasansuren, J., Fukuda, M. And Troxler, T. G. (eds). Published: IPCC, Switzerland. ISPRA, De Lauretis R. Romano D., Vitullo M., Arcarese C. National Greenhouse Gas Inventory System in Italy. Year 2019.
ISPRA, Italian Greenhouse Gas Inventory 1990-2023, National Inventory Report 2025.
ISPRA, Quality Assurance/Quality Control Plan for the Italian Emission Inventory, Year 2025.
None
None
Data quality assessment
Uses ISPRA data from the National Inventory of Atmospheric Emissions: http://emissioni.sina.isprambiente.it/interno-nazionale/
National
1990-2023
Indicator assessment
Emission estimates are produced within the framework of the atmospheric emission inventory, using appropriate emission factors and/or estimation models. In the charts and tables, greenhouse gas emissions are expressed as follows: CO₂ in million tonnes (Mt); CH₄ and N₂O in thousand tonnes (kt); F-gases in tonnes (t). Greenhouse gas emissions are then converted into CO₂ equivalent by multiplying emissions by the Global Warming Potential (GWP) of each species relative to CO₂. The reference methodology for greenhouse gases follows the IPCC guidelines: IPCC Guidelines for National Greenhouse Gas Inventories, Revised 1996; Good Practice Guidance and Uncertainty Management in National Greenhouse Gas Inventories, IPCC 2000; Good Practice Guidance for Land Use, Land-Use Change and Forestry, IPCC 2003; 2006 IPCC Guidelines for National Greenhouse Gas Inventories. For a detailed description of the estimation methodology, refer to the National Inventory Document – NID (https://www.isprambiente.gov.it/it/pubblicazioni/rapporti/italian-greenhouse-gas-inventory-1990-2023-national-inventory-document-2025).
Total greenhouse gas emissions amounted to 384 million tonnes of CO₂ equivalent in 2023, representing a decrease of over 26% compared to 1990. While exceeding the EU target for 2020, further effort is required to meet the new 2030 targets (Table 2 and Figure 1).
Total greenhouse gas emissions decreased from 522.8 million tonnes of CO₂ equivalent in 1990 to 384.7 million tonnes in 2023. This trend is mainly driven by the energy sector and CO₂ emissions, which accounted for 80.4% of the total in 2023 (Table 3 and Figure 1). Methane and nitrous oxide also decreased, whereas F-gases have grown significantly since 1990 (Table 2).
Data
Table 1: National carbon dioxide emissions by sector
ISPRA
Emission values have been updated in line with the annual update of the National Emission Inventory.
Table 2: National greenhouse gas emissions in CO₂ equivalent by substance
ISPRA
LULUCF: Land Use, Land-Use Change, and Forestry;
CO₂: carbon dioxide;
CH₄: methane;
N₂O: nitrous oxide;
F-gas: fluorinated gases.
Emission values have been updated in line with the annual update of the National Emission Inventory.
Table 3: National greenhouse gas emissions in CO₂ equivalent by substance and sector
ISPRA
Emission values have been updated in line with the annual update of the National Emission Inventory.
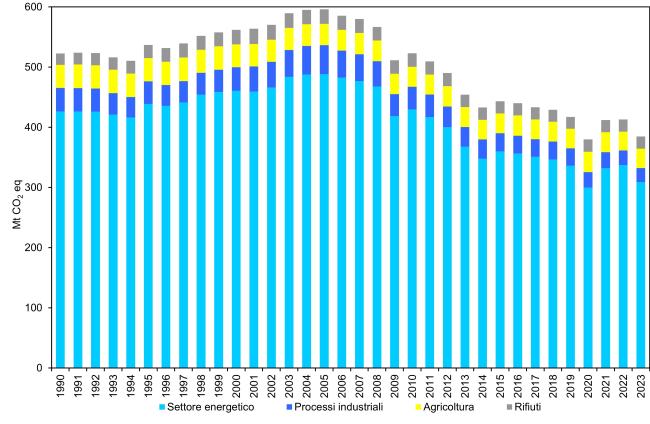
Figure 1: National sectoral greenhouse gas emissions in CO₂ equivalent, according to IPCC classification
ISPRA
Emission values have been updated in line with the annual update of the National Emission Inventory.
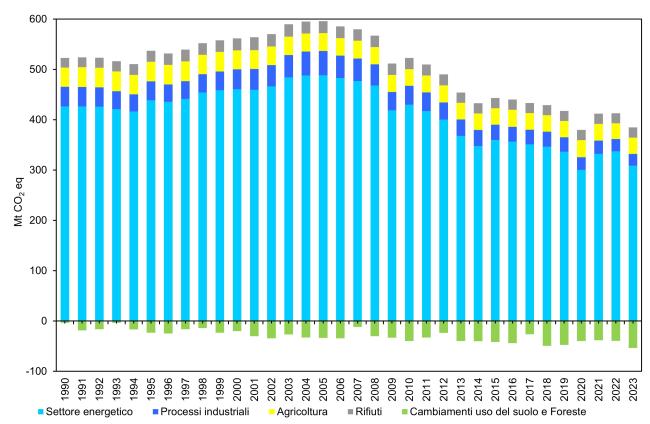
Figure 2: National sectoral greenhouse gas emissions in CO₂ equivalent, according to IPCC classification (including LULUCF)
ISPRA
Emission values have been updated in line with the annual update of the National Emission Inventory.
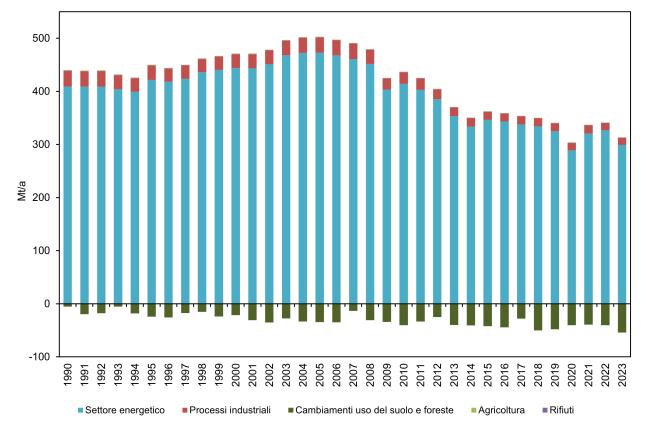
Figure 3: National sectoral CO₂ emissions, according to IPCC classification
ISPRA
Emission values have been updated in line with the annual update of the National Emission Inventory.
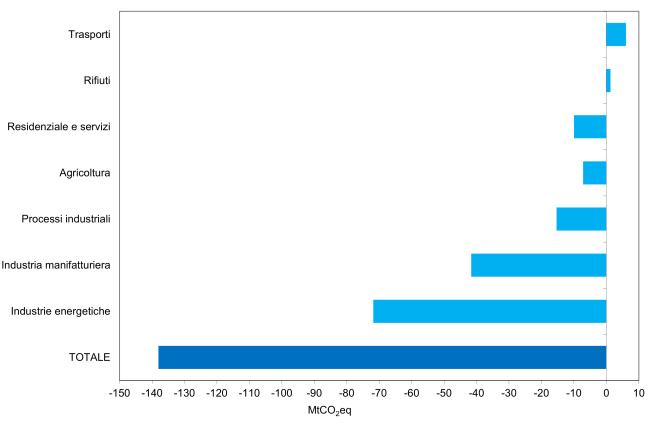
Figure 4: Changes in national greenhouse gas emissions by sector, 1990–2023
ISPRA
Emission values have been updated in line with the annual update of the National Emission Inventory.
Total greenhouse gas emissions from 1990 to 2023 decreased from 522.8 to 384.7 million tonnes of CO₂ equivalent. The trend is mainly driven by the energy sector and CO₂ emissions, representing 80.4% of the total in 2023 (Table 3 and Figure 1). Methane and nitrous oxide also show a downward trend, while F-gases have experienced strong growth since 1990 (Table 2).