Cristina Frizza
In 2024, the seventh edition of the Catalogue of Environmentally Harmful and Environmentally Beneficial Subsidies identified a total of 191 subsidy measures (compared with 183 in 2022). These included EUR 25.4 billion in Environmentally Harmful Subsidies (EHS), a record EUR 71.8 billion in Environmentally Beneficial Subsidies (EBS), and EUR 26.3 billion in Uncertain Environmental Impact Subsidies (UEIS). Among environmentally harmful subsidies, those supporting fossil fuels amounted to EUR 19.6 billion in 2024.
The indicator identifies subsidies with environmentally beneficial, harmful and uncertain effects. Subsidies include incentives, concessions, subsidized financing and tax exemptions directly aimed at protecting the environment. Subsidies are divided into two main categories: direct subsidies (direct transfer of funds, concessions) and indirect (tax expenses, concessions, exemptions). IIndirect subsidies also include implicit subsidies, which arise from ordinary taxation arrangements that may encourage consumption or production patterns with either positive or negative environmental effects. The indicator provides information on both direct and indirect incentives related to energy resources and supports the assessment of fiscal reforms aimed at promoting the decarbonisation of the economy and encouraging environmentally sustainable activities.
Summarize subsidies with favorable and harmful environmental effects to make available to policy makers the information necessary for the removal of harmful ones and the adoption, strengthening and efficiency of environmentally favorable subsidies.
The art. 68 of Law no. 221 of 28 December 2015 has "established at the Ministry of the Environment the Catalogue of Environmentally Harmful Subsidies and Environmentally Beneficial Subsidies, managed on the basis of the human, financial and instrumental resources available under current legislation, without new or greater burdens on public finances". The same article asks for the Catalogue to be updated by June 30th of each year. The objectives of the catalogue are essentially: a) identification of interventions for a tax reform according to the "polluter pays principle", b) reduction of taxation on work and businesses, with simultaneous recovery of tax revenue through forms of environmental taxation that target consumption and production that are harmful to the environment and c) reduction of tax expenses in general.
MASE, Catalogue of Environmentally Harmful Subsidies and Environmentally Beneficial Subsidies
MASE- Ministry of the Environment and Energy Security.
MASE - Catalogue of environmentally beneficial subsidies and environmentally harmful subsidies - https://www. mase. gov. it/portale/catalogo-dei-sussidi-ambientamente-dannosi-e-dei-sussidi-ambientamente-favorevoli
National
2019-2024
The definition of subsidy considered in the Catalogue coincides with that used by the OECD and includes "among others, incentives, concessions, subsidized financing, exemptions from taxes directly aimed at protecting the environment". Both fiscal expenses and direct subsidies must be included in this definition. Regarding the identification of the various subsidies, different methodologies are analyzed (quickscan, checklist, etc.), with the aim of making the information necessary for the removal of environmentally harmful subsidies available to policy makers and the adoption, strengthening and efficiency of subsidies with favorable environmental effects, just as various methodologies are considered for the quantification of subsidies (price gap, marginal social cost, external costs, etc.). More information on the methodology can be found in the MASE Catalogue of environmentally beneficial subsidies and environmentally harmful subsidies.
In 2024, the overall volume of subsidies analyzed reached €123.5 billion. Although Environmentally Harmful Subsidies (EHS) remained substantial (EUR 25.4 billion), their share of the total declined to 20.6%, largely due to the unprecedented increase in Environmentally Beneficial Subsidies (EBS), which reached EUR 71.8 billion and accounted for 58.2% of all monitored subsidies. Overall, the current situation reflects a marked shift in public financial support towards environmentally beneficial measures, although the persistence of a significant volume of environmentally harmful subsidies indicates that further reform efforts remain necessary.
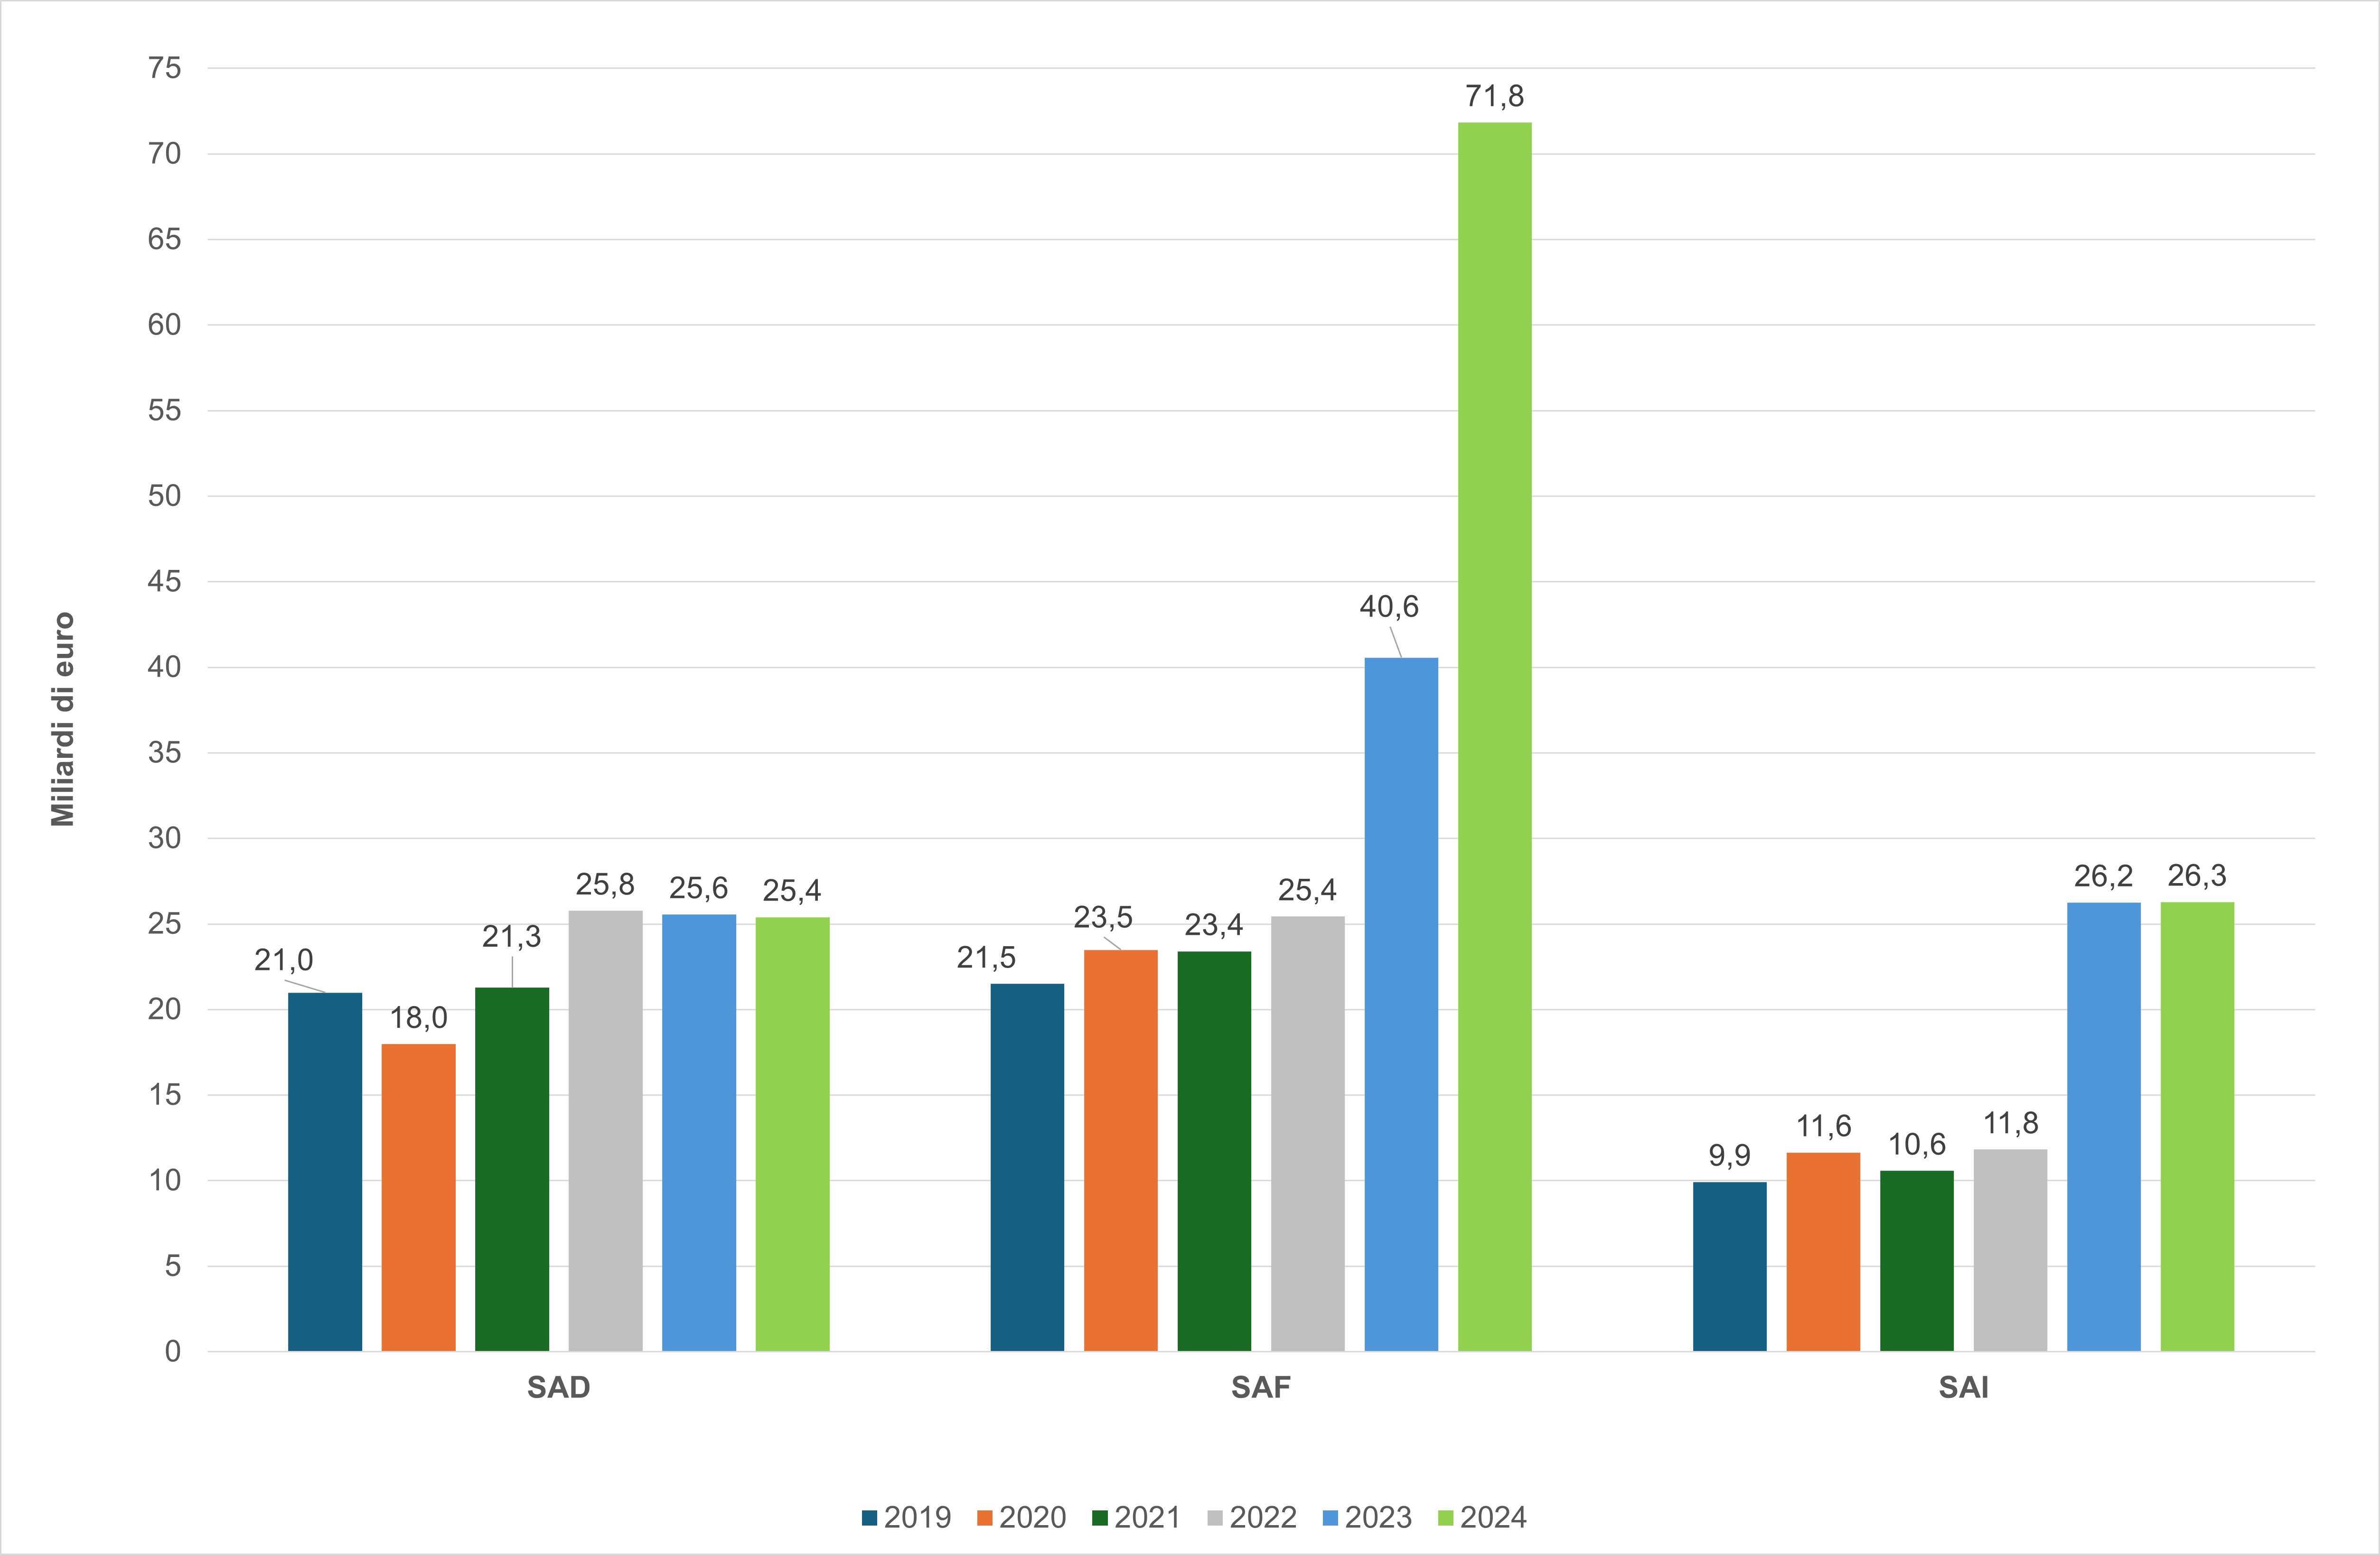
Over the 2019–2024 period, Environmentally Beneficial Subsidies (EBS) recorded an unprecedented increase of 234%, rising from EUR 21.5 billion in 2019 to EUR 71.8 billion in 2024. During the same period, Environmentally Harmful Subsidies (EHS) increased by 21%, from EUR 21.0 billion to EUR 25.4 billion, while Uncertain Environmental Impact Subsidies (UEIS) expanded by 165%, increasing from EUR 9.9 billion to EUR 26.3 billion. Overall, the observed trend has been strongly influenced by public incentive schemes supporting energy efficiency improvements and building renovation programmes, which have substantially expanded the volume of environmentally beneficial subsidies.
| Data |
|---|
Headline
Table 1: Estimate of total annual subsidies by sector and type (million euros) Data source
MASE Data legend
EHS: Environmentally Harmful Subsidy; EBS: Environmentally Beneficial Subsidy; UEIS: Uncertain Environmental Impact Subsidy |
Headline
Table 2: Number and estimate of total annual subsidies Data source
MASE Data legend
EHS: Environmentally Harmful Subsidy; EBS: Environmentally Beneficial Subsidy; UEIS: Uncertain Environmental Impact Subsidy; FFS: Fossil Fuels Subsidy |
Thumbnail
Headline
Figure 1: Total annual subsidies by type of environmental effect Data source
ISPRA elaboration of MASE data Data legend
EHS: Environmentally Harmful Subsidy; EBS: Environmentally Beneficial Subsidy; UEIS: Uncertain Environmental Impact Subsidy |
TThe 2024 distribution of subsidies reveals a high degree of concentration of Environmentally Harmful Subsidies (EHS) within the energy sector and reduced VAT rates. As shown in Table 1, these two categories together account for approximately EUR 23.6 billion of the EUR 25.4 billion total EHS, representing about 93% of all environmentally harmful subsidies. A positive policy development has been the recent abolition of the reduced VAT rate previously applied to landfilling and incineration without energy recovery, a measure formerly classified as environmentally harmful. At the same time, Environmentally Beneficial Subsidies (EBS) reached an unprecedented level of EUR 71.8 billion in 2024 (Figure 1). This exceptional increase is almost entirely attributable to the category "Other subsidies" (Table 1), whose value rose from EUR 2.4 billion in 2019 to EUR 55.9 billion in 2024. This expansion has been driven primarily by large-scale public incentive programmes supporting energy-efficient building renovation and the refurbishment of the existing building stock, including the Ecobonus, Superbonus, and Sismabonus schemes. In 2024, these measures were further complemented by the introduction of the "Transition 5.0" tax credit, aimed at improving the energy efficiency and sustainability of industrial production processes. Uncertain Environmental Impact Subsidies (UEIS) amounted to EUR 26.3 billion in 2024 (Figure 1). Their uncertain classification mainly reflects the absence of explicit environmental conditionality. These subsidies are largely concentrated in reduced VAT rates for building renovation and investment incentives for capital goods, where the overall environmental impact is often difficult to assess (Table 1).